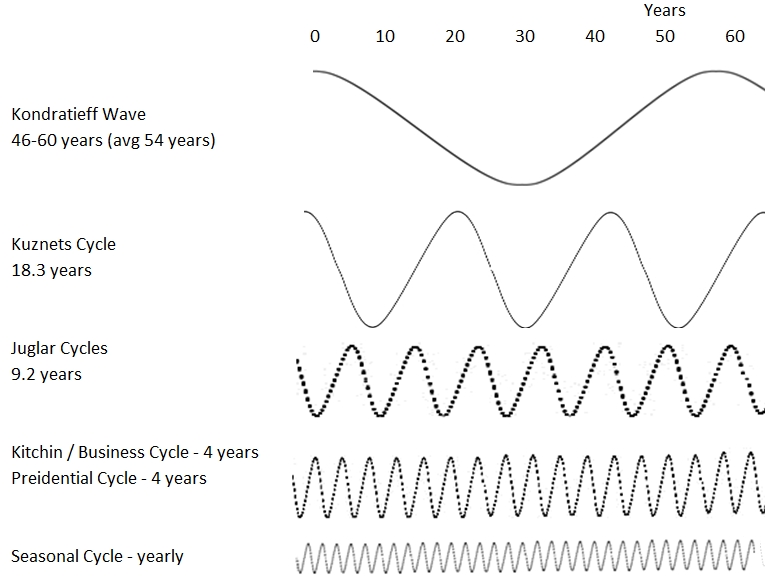
Six waves and cycles influence how our economies, businesses, and financial markets expand and contract. The Kondratieff Wave, Kuznets Cycle, Juglar Cycle, Business Cycle, Presidential Cycle, and Seasonal Cycle will change how you see the world.| Liberated Stock Trader
Our ultimate guide to technical analysis, with its 14 videos and detailed examples covering charts, trends, indicators, patterns, and tools, will fast-track your knowledge.| Liberated Stock Trader
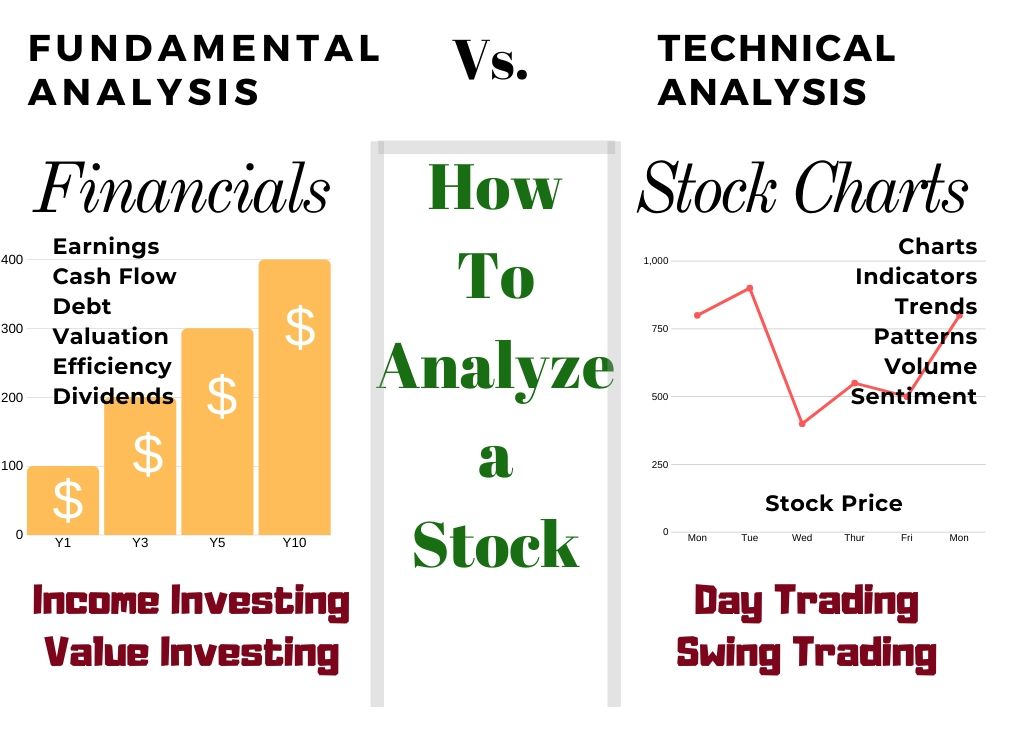
There are two ways to analyze stocks. Fundamental analysis, which evaluates criteria such as PE ratio, earnings, and cash flow. Technical analysis, which involves studying charts, stock prices, volume, and indicators.| Liberated Stock Trader
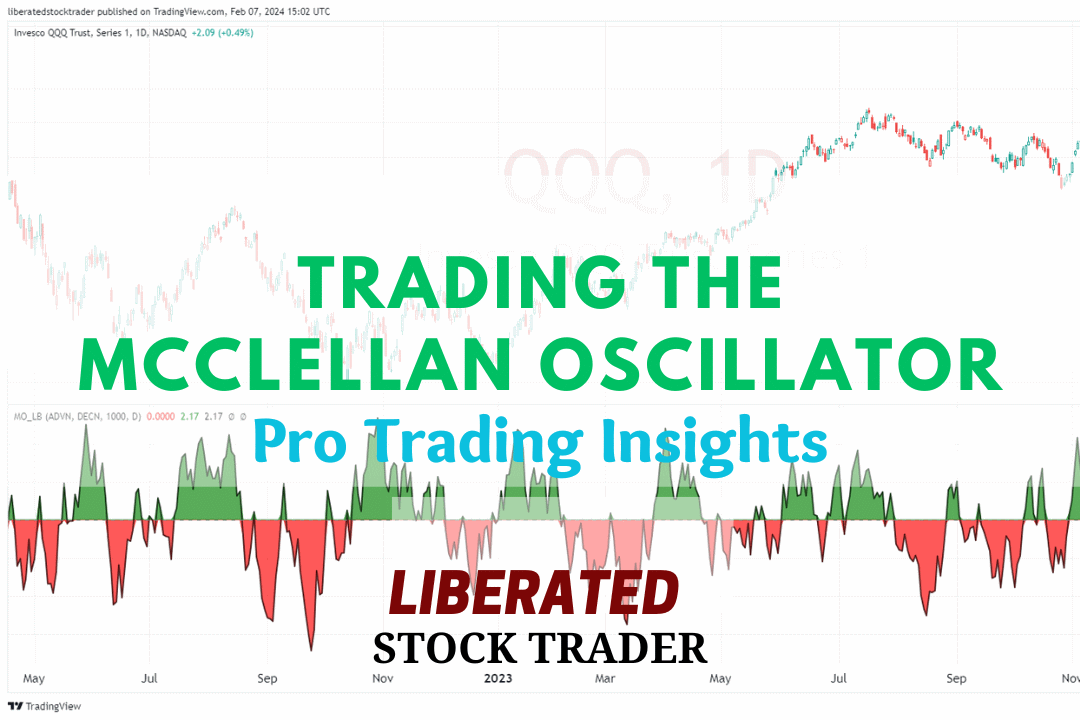
The McClellan Oscillator is a technical analysis tool designed to assess the market breadth of the New York Stock Exchange (NYSE). It is renowned for its effectiveness in revealing the underlying strength or weakness of the market by comparing the number of advancing to declining stocks.| Liberated Stock Trader
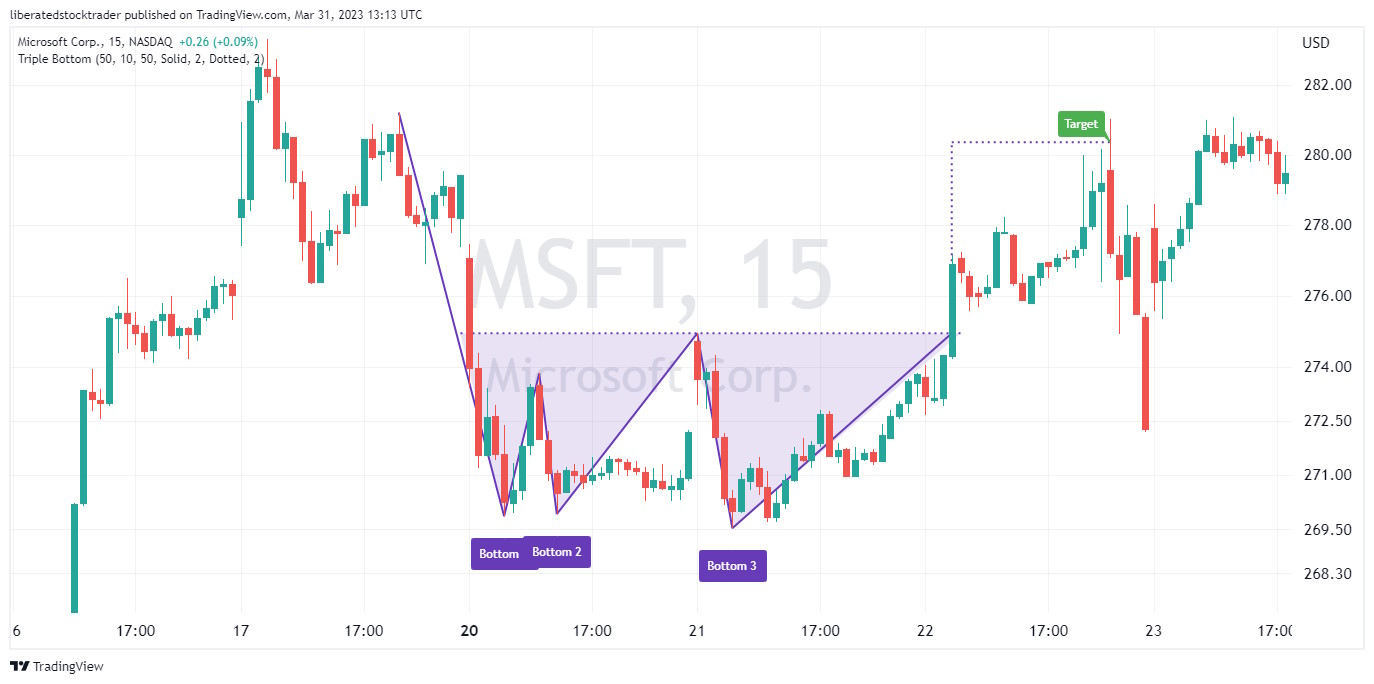
Decades of trading research show the triple-bottom pattern has an 87% success rate in bull markets and an average profit potential of +45%. The triple bottom chart pattern is popular because it is reliable and accurate and generates a good average profit for traders.| Liberated Stock Trader
Learn stock market investing with the complete online stock trading course by Barry D. Moore, a certified financial analyst from the International Federation of Technical Analysts (IFTA).| Liberated Stock Trader
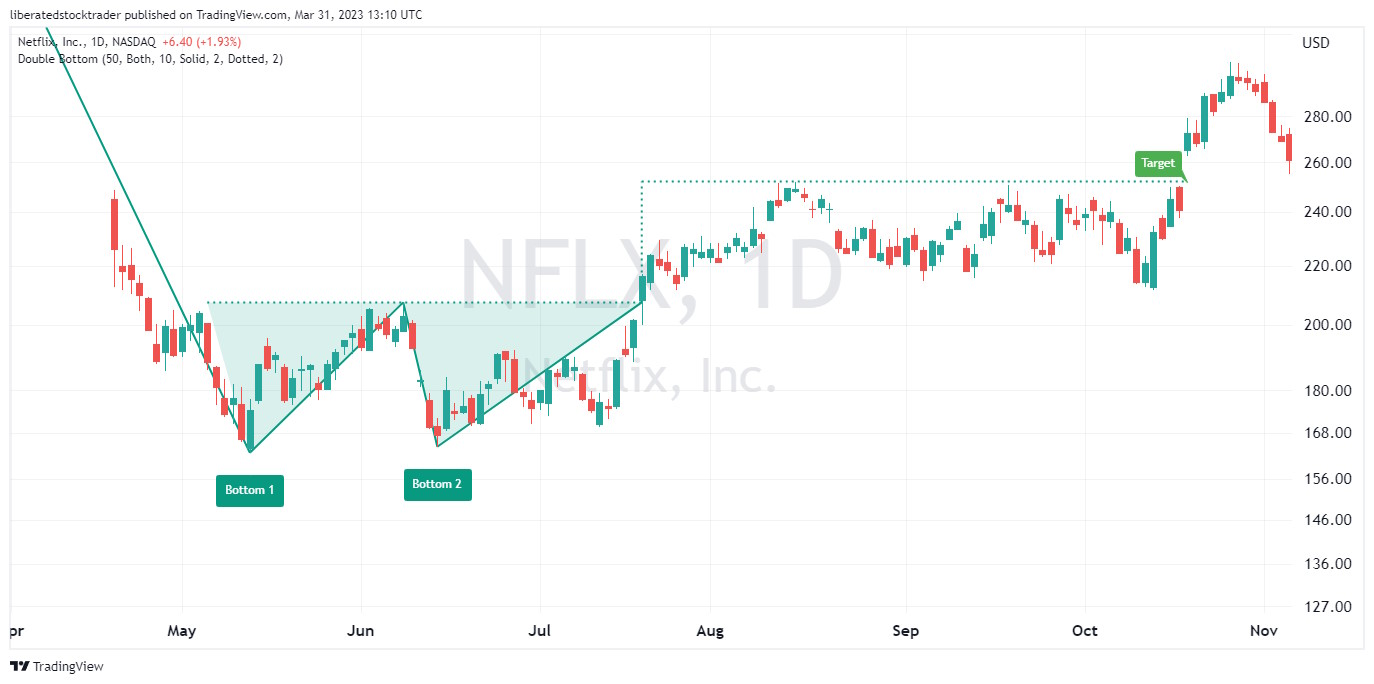
Decades of research reveal the double bottom pattern has an 88% success rate in bull markets and an average profit potential of +50%. The double-bottom chart pattern is one of the most reliable and accurate chart indicators in technical analysis.| Liberated Stock Trader
Professional analysts define all stock market trends using timeframe and direction: Timeframes are short-term, medium-term, and long-term. Direction is described using uptrend, downtrend, or consolidation.| Liberated Stock Trader
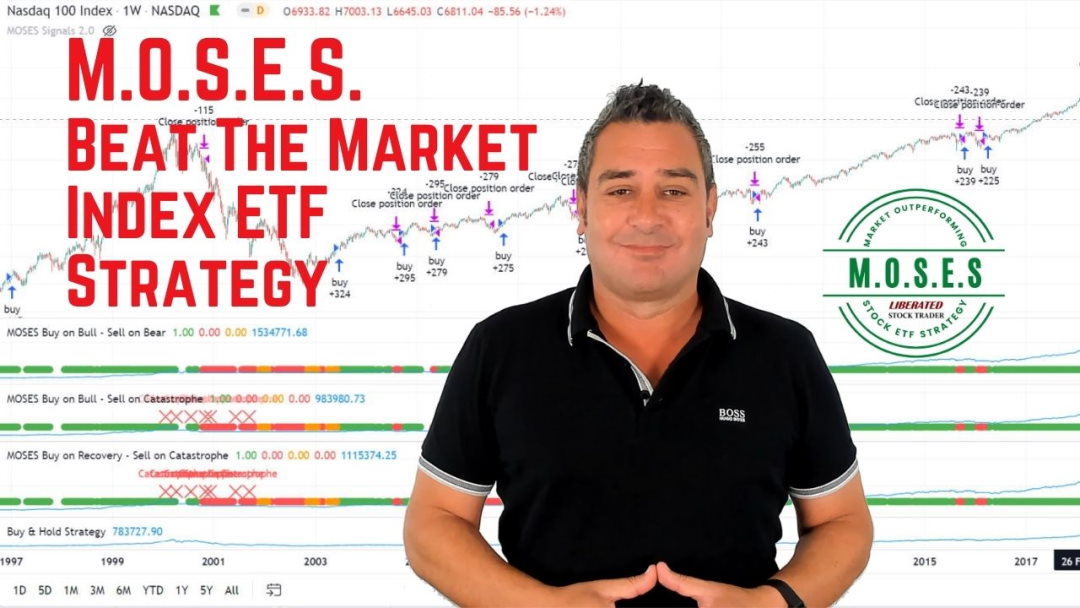
The MOSES ETF investing strategy is a powerful suite of indicators meticulously backtested over 100 years. Designed to empower you to outperform the market, it equips you with the tools to navigate major stock market crashes and unlock greater investing performance.| Liberated Stock Trader
Research shows that the most reliable chart patterns are the Head and Shoulders, with an 89% success rate, the Double Bottom (88%), and the Triple Bottom and Descending Triangle (87%). The Rectangle Top is the most profitable, with an average win of 51%, followed by the Rectangle Bottom with 48%.| Liberated Stock Trader
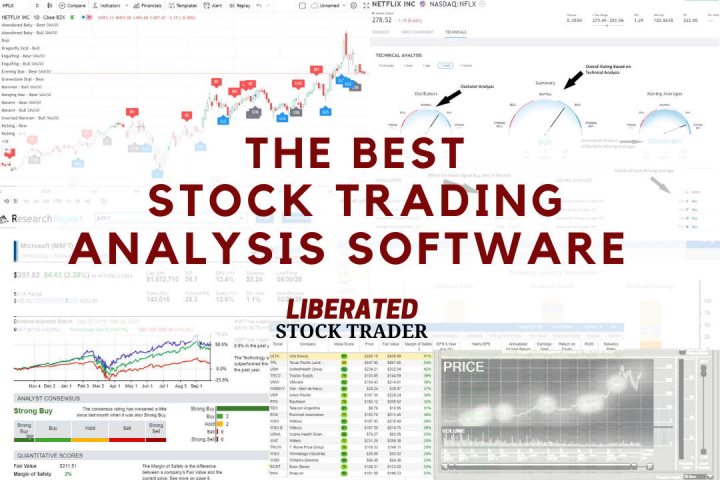
My in-depth testing shows that TradingView, TrendSpider, and Trade Ideas are the best tools for traders, and Stock Rover is superior for investors. Each provides unique benefits, features, and price points.| Liberated Stock Trader
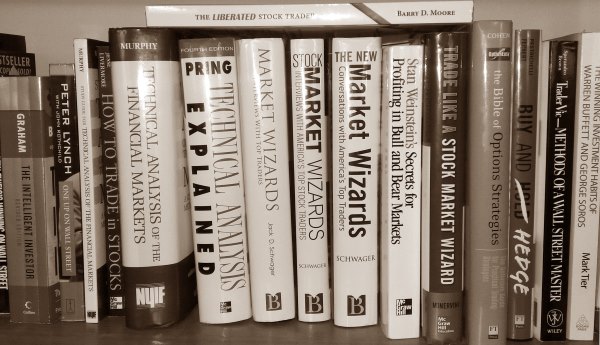
The best technical analysis books leading industry bodies recommend are Technical Analysis of the Financial Markets, Technical Analysis Explained, Cloud Charts, and Forecasting Financial Markets.| Liberated Stock Trader
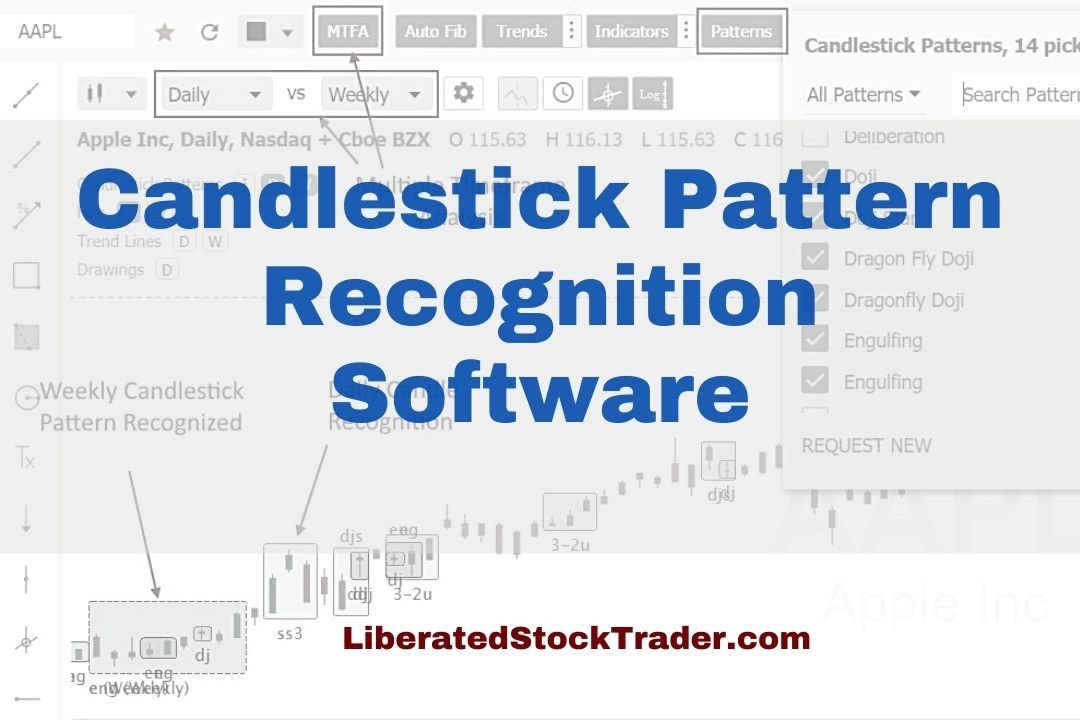
Testing reveals the best stock chart candlestick pattern recognition software is TrendSpider, TradingView, MetaStock, and Finviz.| Liberated Stock Trader