Google Data Studio. We will also touch upon how a Case statement formula can be used for basic data filtering, as well as advanced calculations when combined with different conditions.| LAZARINA STOY.
Ultimate Guide to Data Storytelling, an Essential Skill for Digital Marketing and Data Consultant (Part 2) - Practical Ways to implement Data Storytelling in your day-to-day| LAZARINA STOY.
The Data Studio Dashboard consists of several different sections: Coverage Overview, Mobile Usability Issues, Rich Result Snippet Issues, Google Status, Crawling, Canonical Tags, which will help you answer a ton of questions about the sites you are reporting on.| LAZARINA STOY.
The first step to visualizing and organizing your data in Data Studio is to connect to the Hubspot data source. There are five different ways to do this.| LAZARINA STOY.
Data storytelling mistakes are something all analysts or consultants will make at some point in their reporting journey. Learn from mine, and avoid these pitfalls.| LAZARINA STOY.
In the world of data visualisation, Looker Studio stands out as a powerful tool for creating interactive reports and dashboards. But what really takes your| LAZARINA STOY.
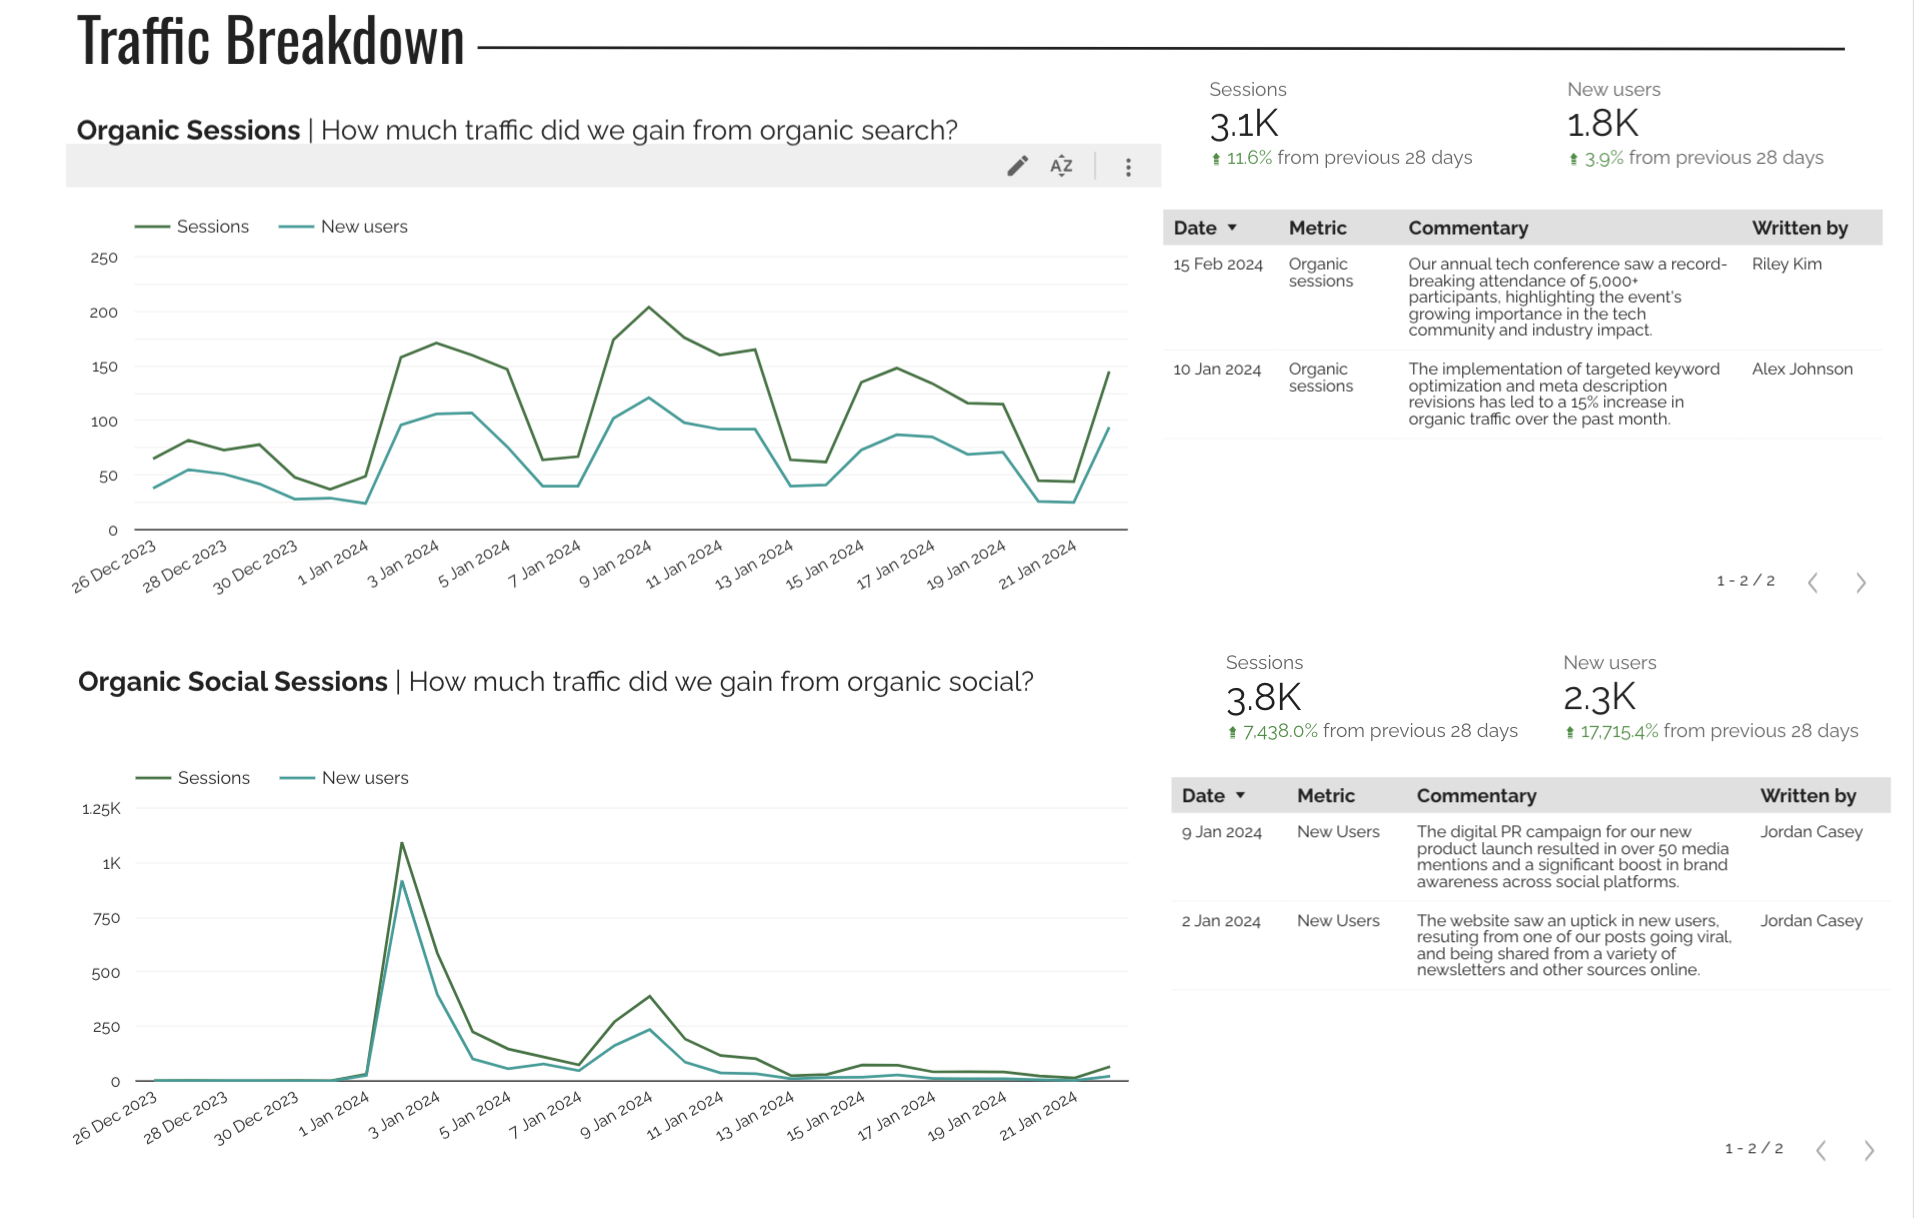
Ever found yourself scratching your head trying to remember why there was a spike in your data last quarter? Custom event annotations in Looker Studio are| LAZARINA STOY.
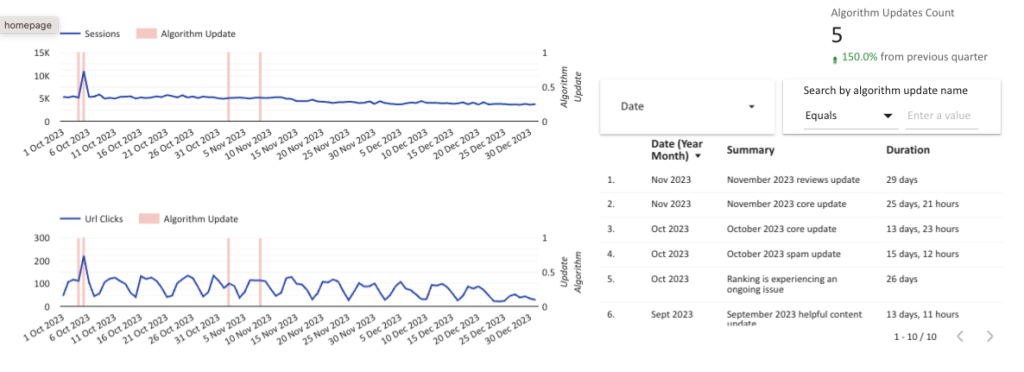
Google has a great tracker table of all of the core algorithm updates they have released to the algorithm for search over the past two years, which is| LAZARINA STOY.