
Box plots: what are they and how to build one without coding | Flourish
Wondering how to make a box plot? Read our box-and-whisker diagram guide to discover the essential elements of a box plot and quickly make your own with Flourish.| Flourish
Wondering how to make a box plot? Read our box-and-whisker diagram guide to discover the essential elements of a box plot and quickly make your own with Flourish.| Flourish
Marimekko charts are great for comparing categorical data while considering the relative proportions of each subcategory. You can now easily create a Marimekko chart with Flourish!| Flourish
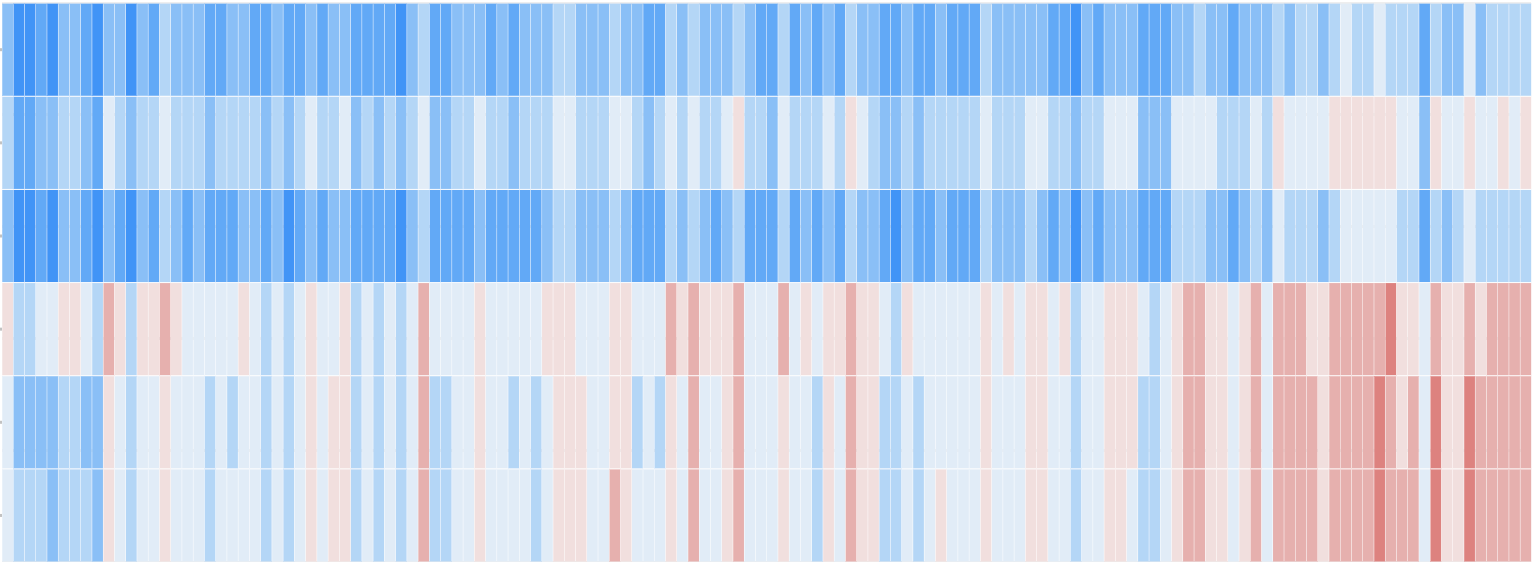
Explore heatmap examples and learn how to make interactive and mobile-friendly heatmap visualizations with Flourish. Create everything from categorical heatmaps to climate stripes.| Flourish
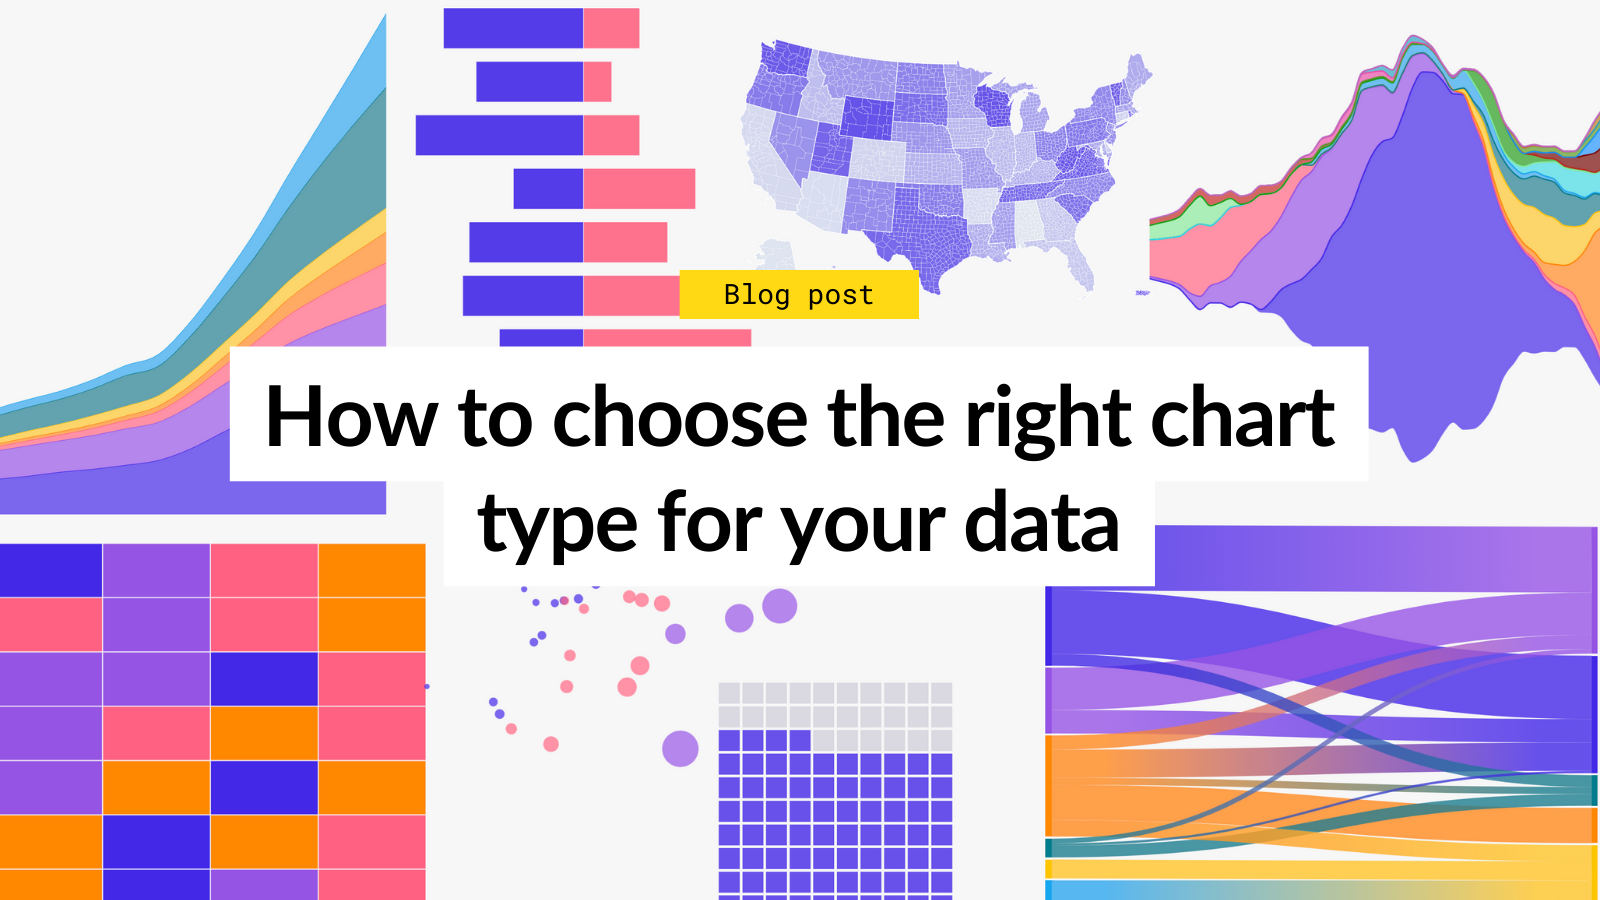
A guide to choosing the right chart type for your content needs with examples of different visualization types you can make in Flourish.| Flourish
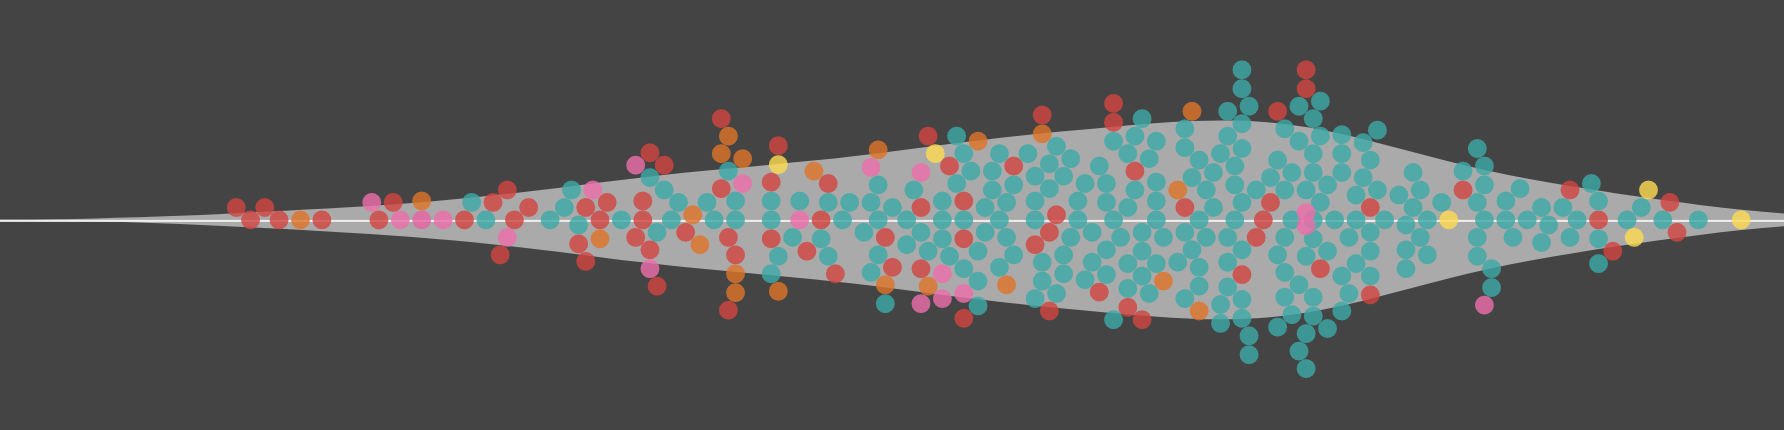
Visualize your data insights with Flourish’s violin plot and beeswarm maker. Read our blog to learn how to use these charts and bring your data to life with our Scatter modes.| Flourish
Master the art of color in data visualization with our guide. Level up your charts, maps and other data visualization and avoid common color mistakes.| Flourish
Beautiful, easy data visualization and storytelling| Flourish
