
Outliers detection in R - Stats and R
Learn how to detect outliers in R thanks to descriptive statistics and via the Hampel filter, the Grubbs, the Dixon and the Rosner tests for outliers| Stats and R
Learn how to detect outliers in R thanks to descriptive statistics and via the Hampel filter, the Grubbs, the Dixon and the Rosner tests for outliers| Stats and R

Learn how to compute a correlation coefficient (Pearson and Spearman) and perform a correlation test in R| Stats and R
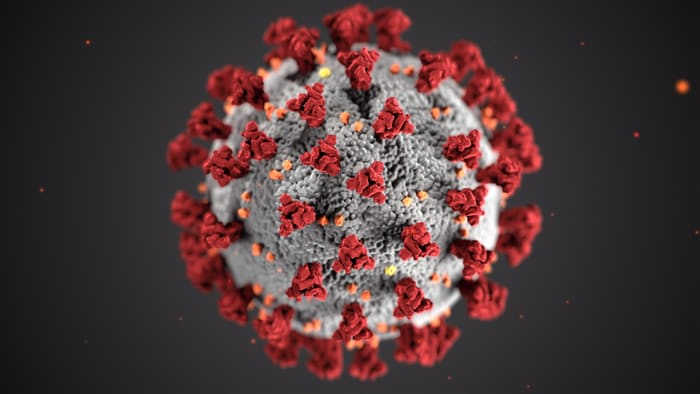
Best R resources about Coronavirus (COVID-19). These resources are Shiny app, R packages or code that you can use freely to analyze the Coronavirus outbreak| Stats and R

Learn how to perform clustering analysis, namely k-means and hierarchical clustering, by hand and in R. See also how the different clustering algorithms work| Stats and R

Learn how to perform a descriptive analysis of your data in R, from simple descriptive statistics to more advanced graphics used to describe your data at hand| Stats and R

Learn the differences between a quantitative continuous, quantitative discrete, qualitative ordinal and qualitative nominal variable via concrete examples| Stats and R
