
What statistical test should I do? - Stats and R
Select the most appropriate statistical (hypothesis) test based on the number of variables and their types with the help of a flowchart| Stats and R
Select the most appropriate statistical (hypothesis) test based on the number of variables and their types with the help of a flowchart| Stats and R

Learn how to perform an Analysis Of VAriance (ANOVA) in R to compare 3 groups or more. See also how to interpret the results and perform post-hoc tests| Stats and R

Learn how to create professional graphics and plots in R (histogram, barplot, boxplot, scatter plot, line plot, density plot, etc.) with the ggplot2 package| Stats and R

Learn how to detect outliers in R thanks to descriptive statistics and via the Hampel filter, the Grubbs, the Dixon and the Rosner tests for outliers| Stats and R

Learn how to compute a correlation coefficient (Pearson and Spearman) and perform a correlation test in R| Stats and R

Learn how to apply the Student's t-test by hand and in R in order to compare two independent or paired samples with known or unknown variances| Stats and R

This article explains in details what is the normal or Gaussian distribution, its importance in statistics and how to test if your data is normally distributed| Stats and R

Learn how to perform a descriptive analysis of your data in R, from simple descriptive statistics to more advanced graphics used to describe your data at hand| Stats and R
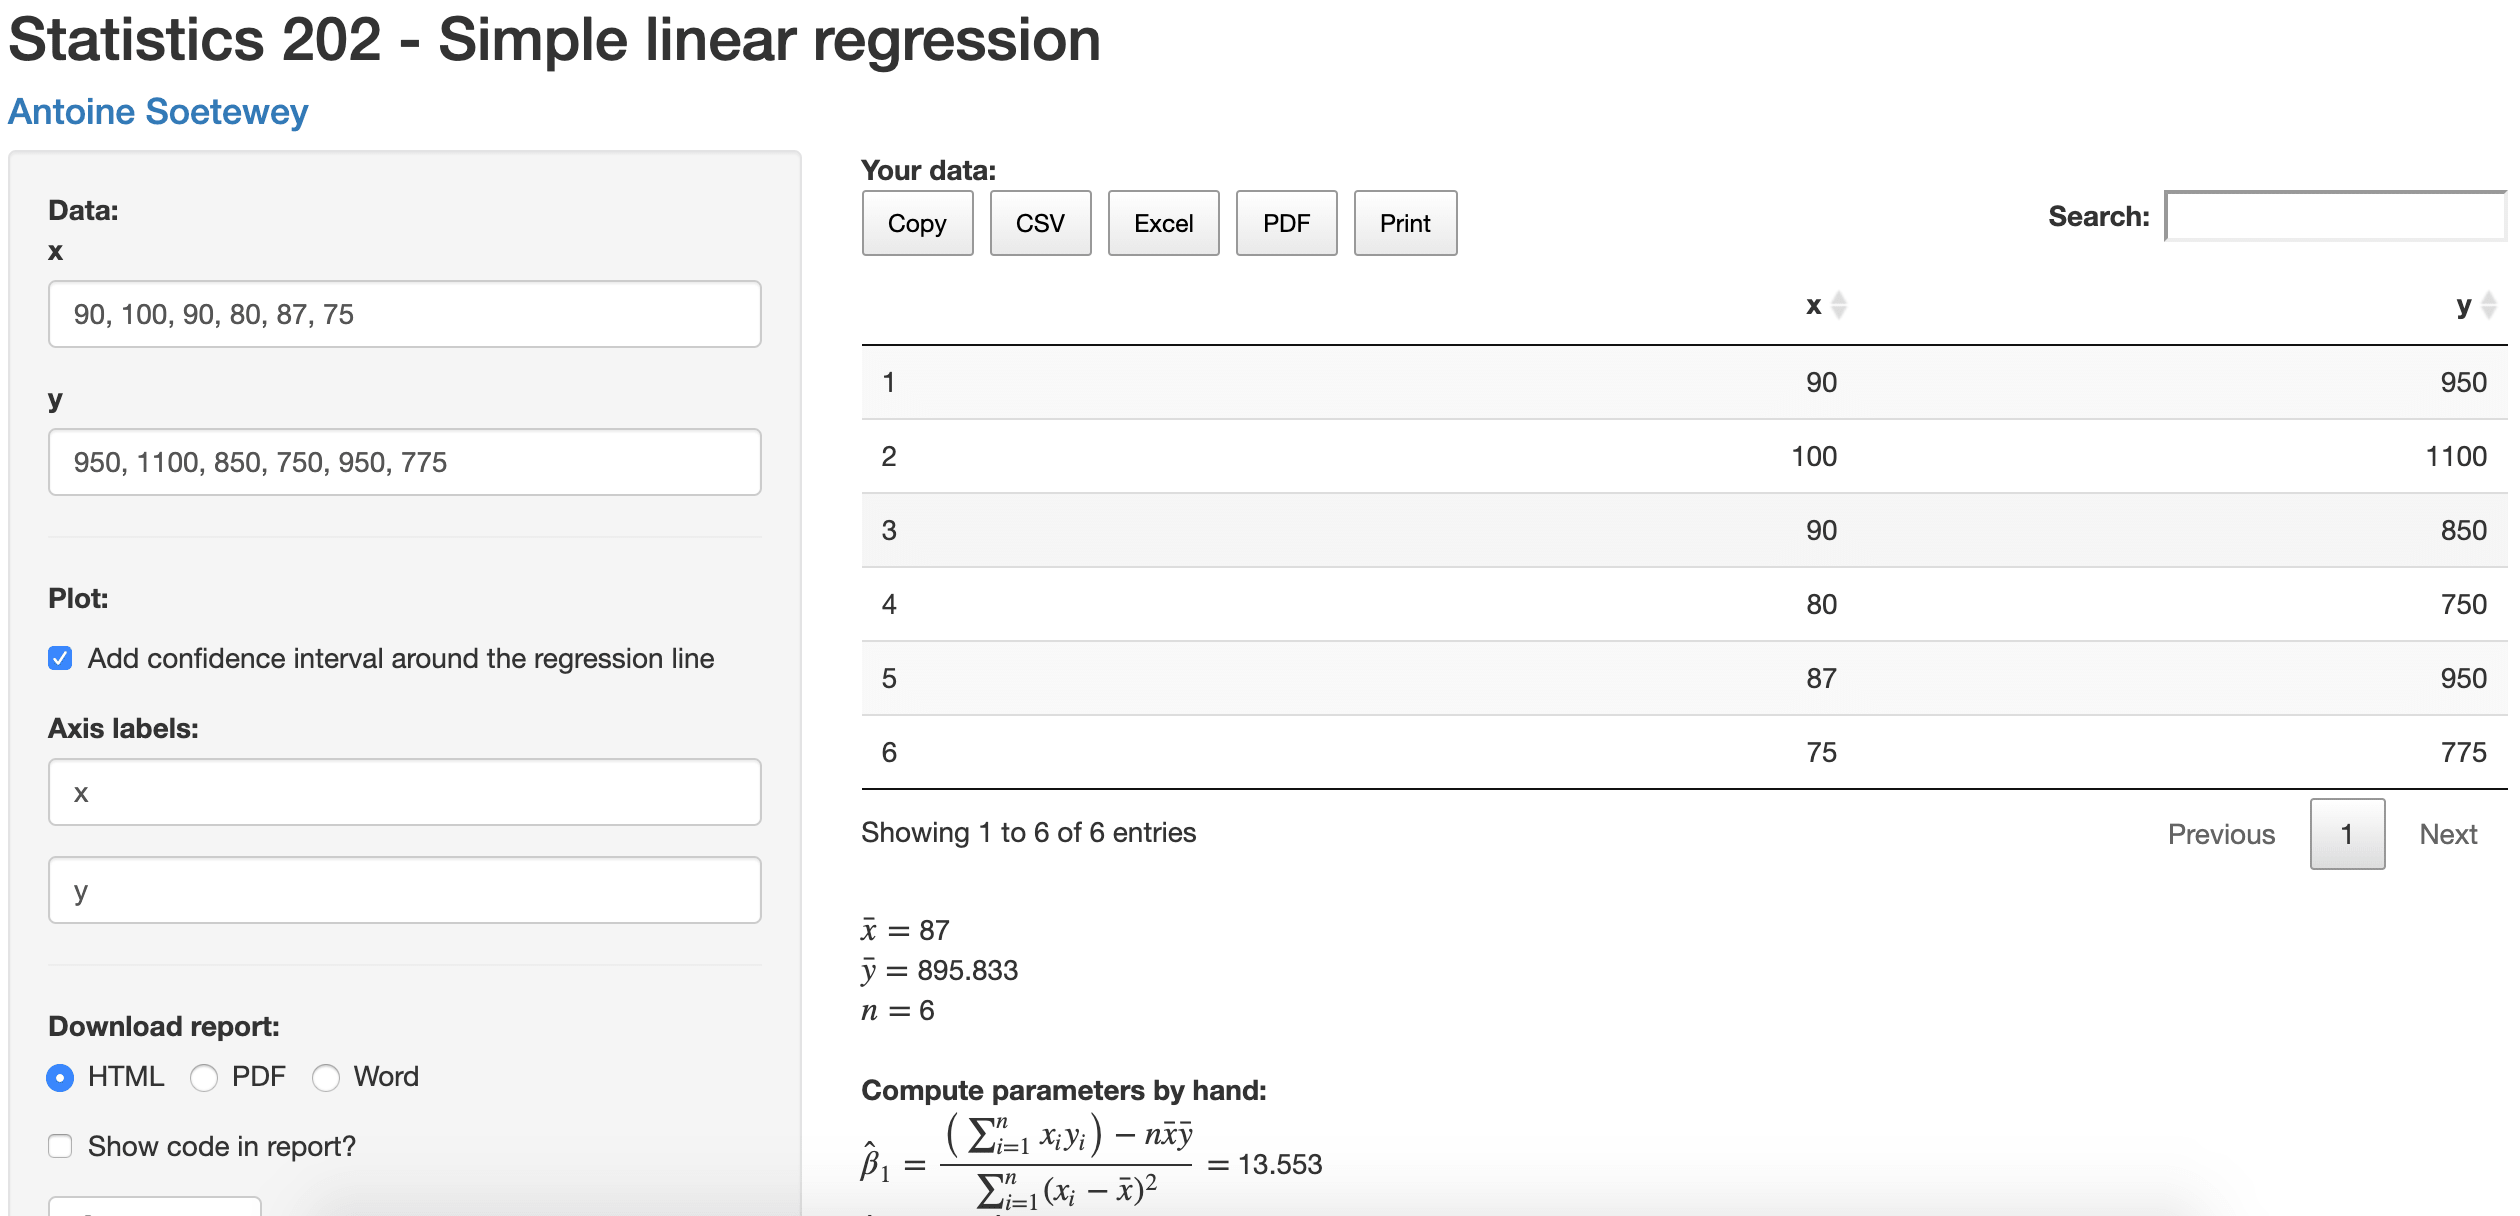
This article presents a Shiny app for computing simple linear regression by hand and in R. Add your own data, see the results and download them as a report| Stats and R
