
What statistical test should I do? - Stats and R
Select the most appropriate statistical (hypothesis) test based on the number of variables and their types with the help of a flowchart| Stats and R
See Antoine Soetewey's teaching tasks and positions| antoinesoetewey.com
Select the most appropriate statistical (hypothesis) test based on the number of variables and their types with the help of a flowchart| Stats and R

Learn how to create professional graphics and plots in R (histogram, barplot, boxplot, scatter plot, line plot, density plot, etc.) with the ggplot2 package| Stats and R
What are R packages and how to use them? Discover also a more efficient way to install and load R packages in R thanks to the pacman and librarian packages| Stats and R

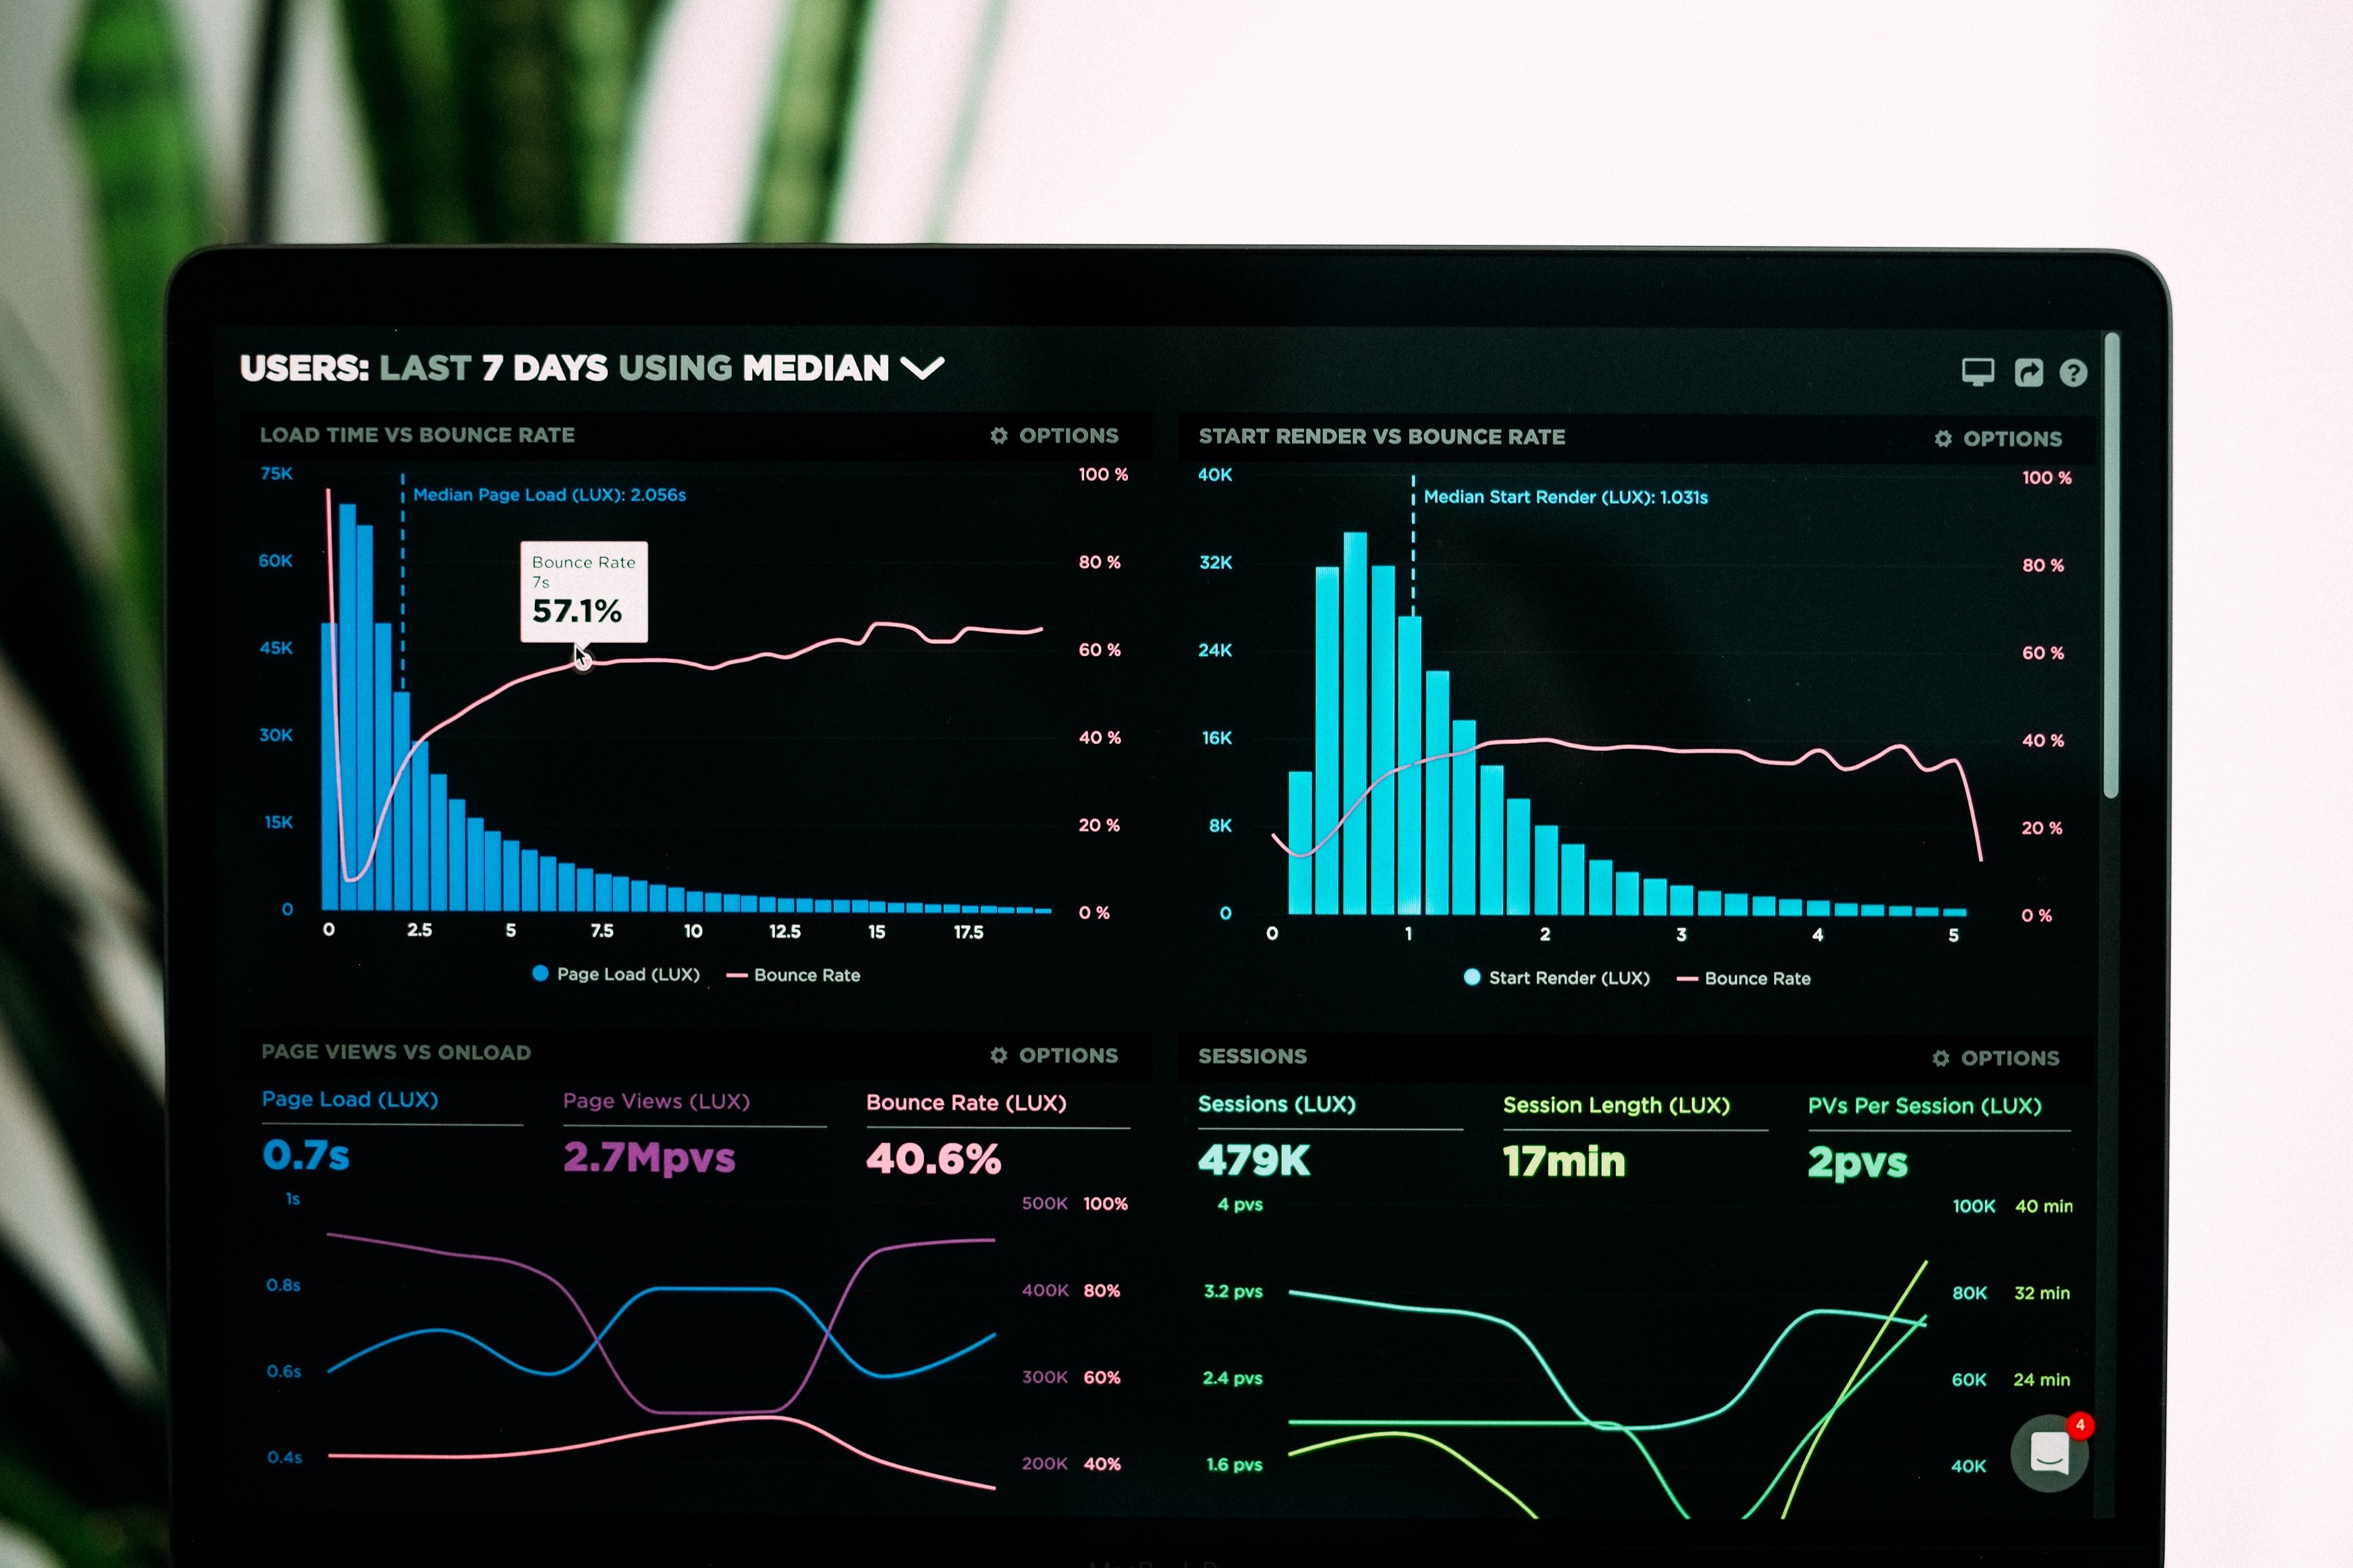
Learn how to perform a descriptive analysis of your data in R, from simple descriptive statistics to more advanced graphics used to describe your data at hand| Stats and R

This article explains how to distinguish a population from a sample, an important difference in statistics, namely for descriptive and inferential statistics| Stats and R
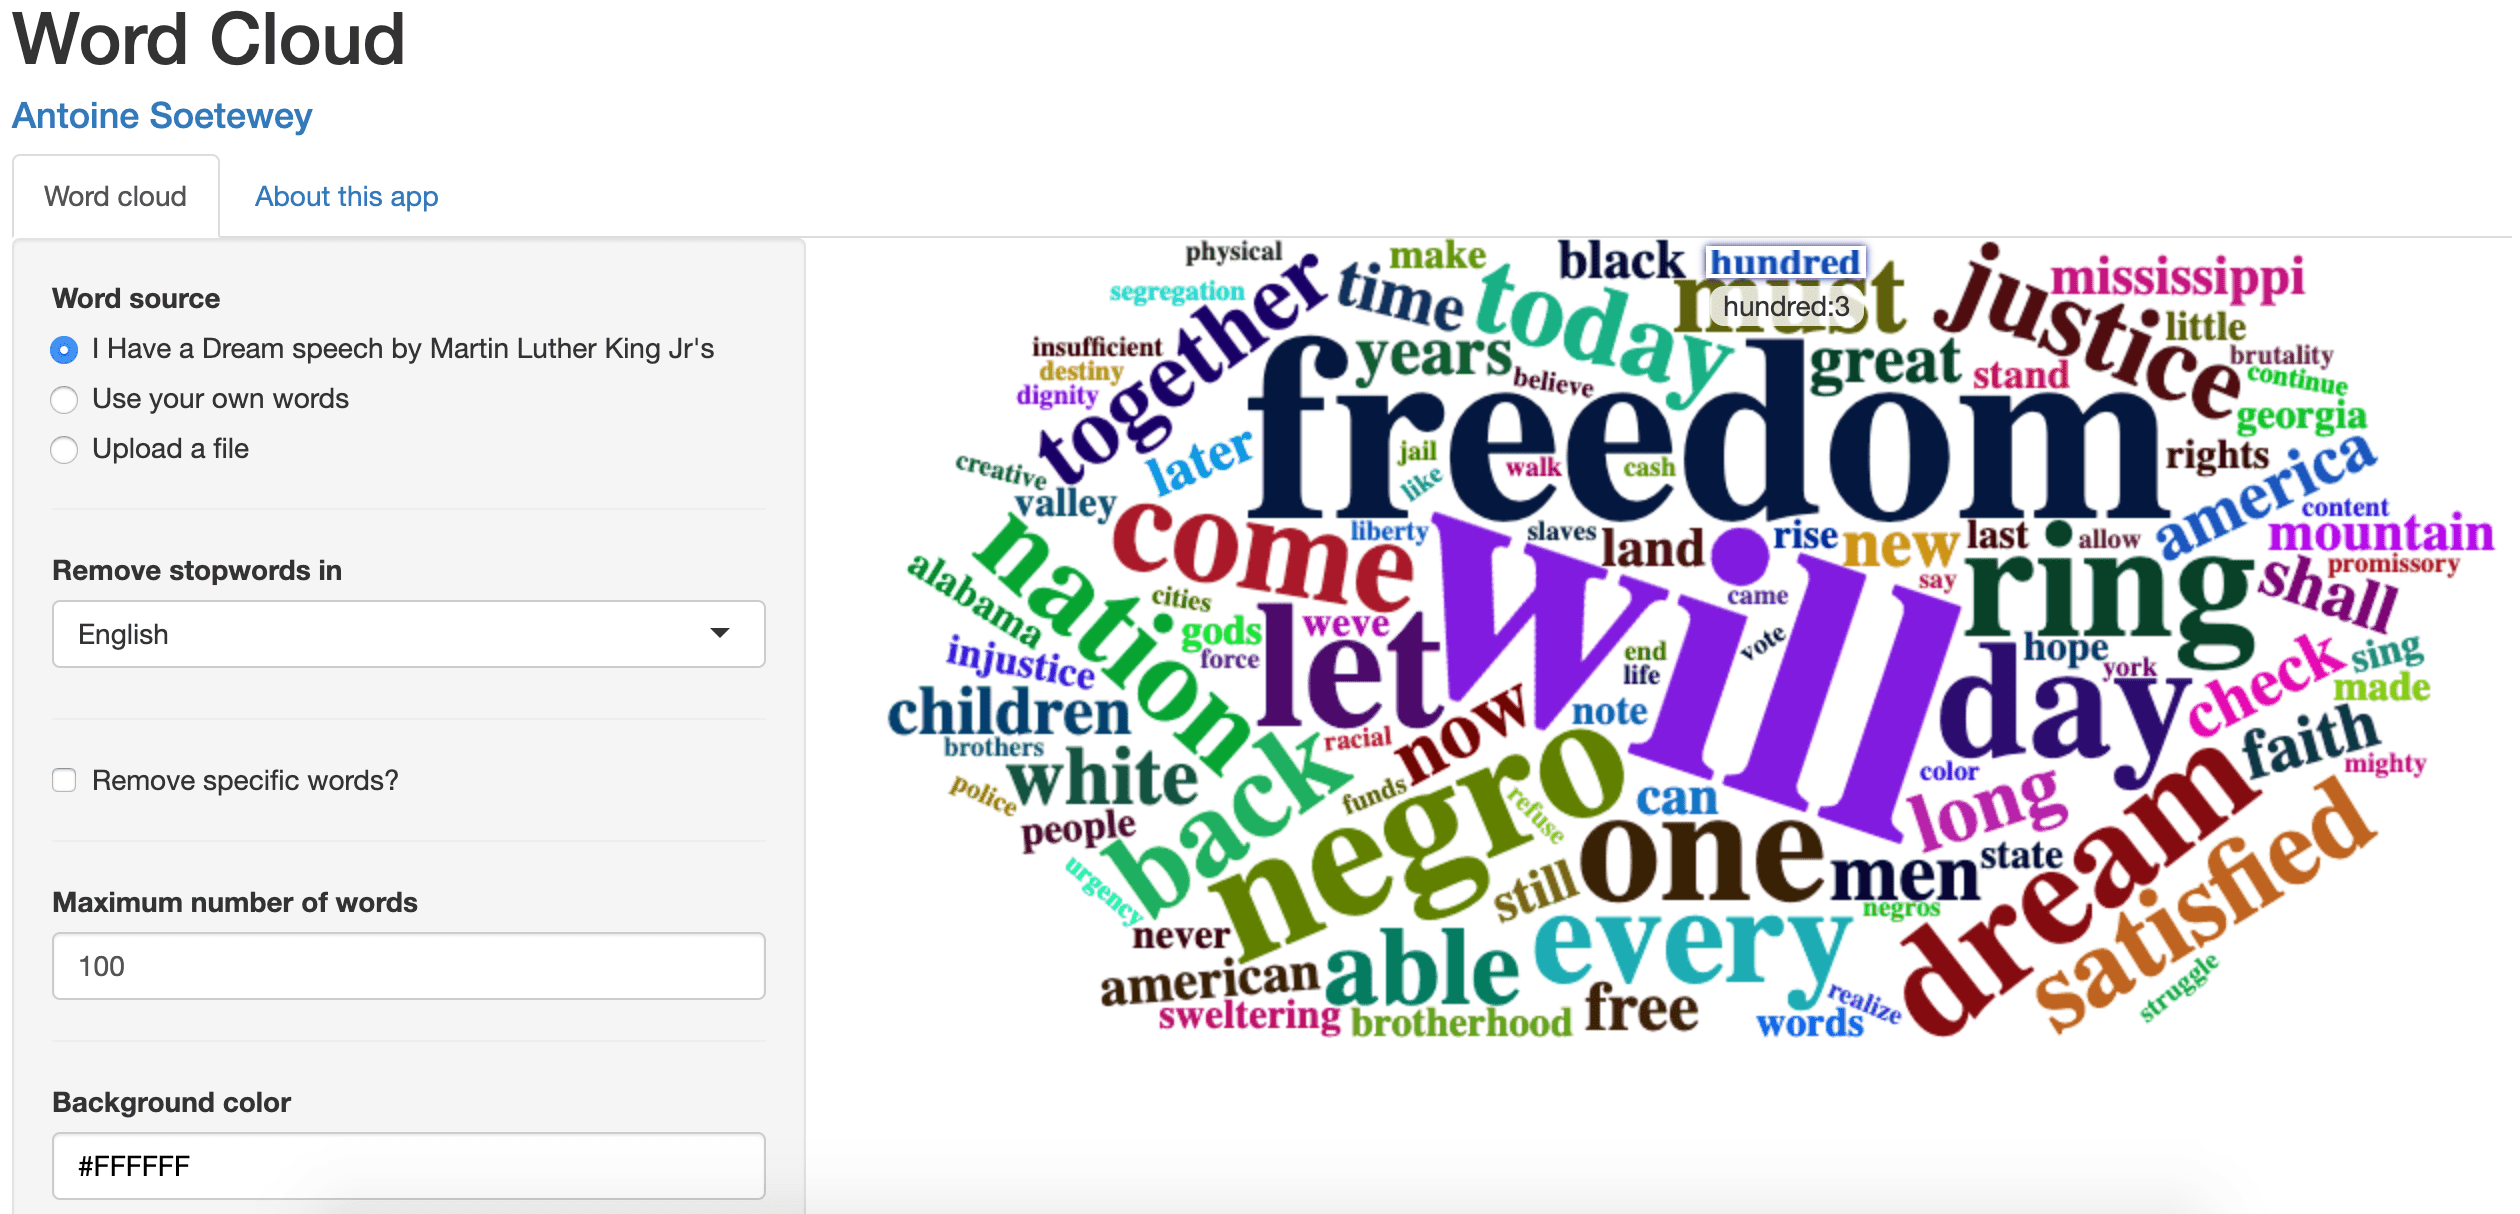
Word clouds are often used in a text mining analysis. See how to draw a word cloud in R thanks to a Shiny app. See also some examples or use your own dataset| Stats and R
Learn about the five most common data types in R, numeric, integer, character, factor and logical. See also how to recognize the different data types in R| Stats and R

Learn the differences between a quantitative continuous, quantitative discrete, qualitative ordinal and qualitative nominal variable via concrete examples| Stats and R

See the main functions to manipulate data in R such as how to subset a data frame, create a new variable, recode categorical variables and rename a variable| Stats and R

After having installed R and RStudio, learn several ways to import an Excel, CSV or SPSS (.sav) file into RStudio via the code or in a more user-friendly way| Stats and R

This article explains what is R and RStudio (an open source statistical software program), and how to install it. Some examples of basic code are also presented| Stats and R
