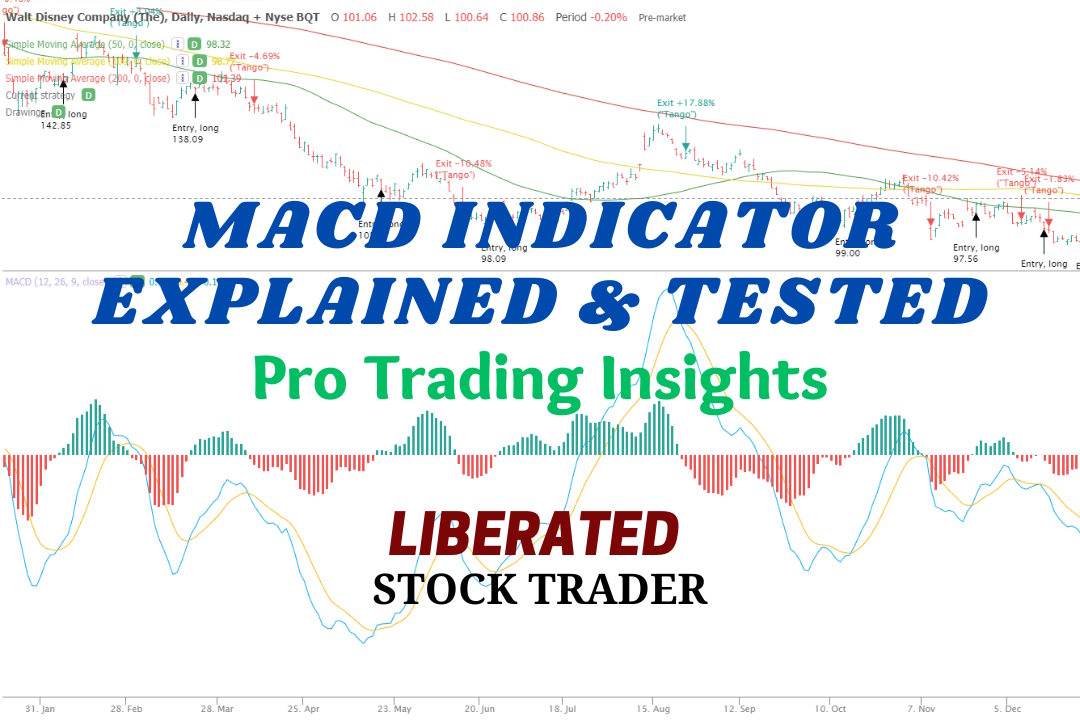
The MACD Myth: My 606,422 Tested Trades Reveal the Truth
MACD is a trend-following momentum indicator used to identify price trends. We conducted 606,422 test trades to find the best settings and trading strategies.| Liberated Stock Trader
MACD is a trend-following momentum indicator used to identify price trends. We conducted 606,422 test trades to find the best settings and trading strategies.| Liberated Stock Trader
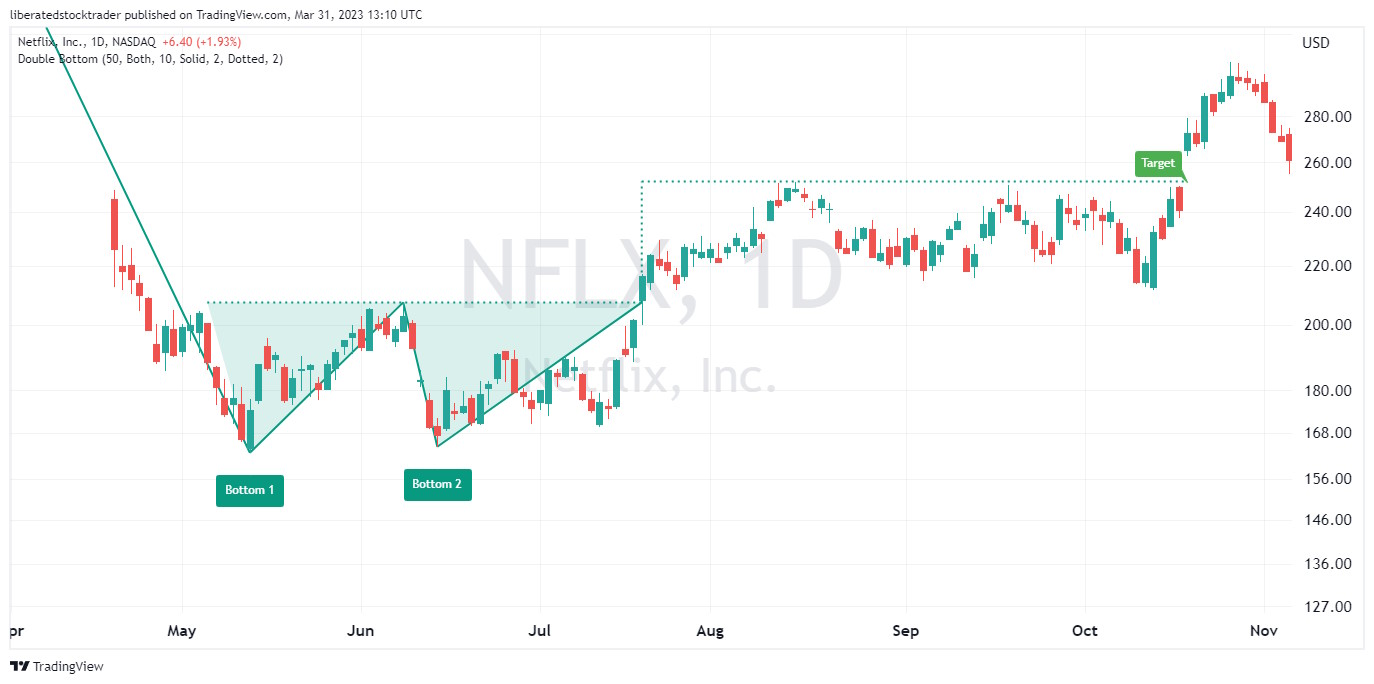
Decades of research reveal the double bottom pattern has an 88% success rate in bull markets and an average profit potential of +50%. The double-bottom chart pattern is one of the most reliable and accurate chart indicators in technical analysis.| Liberated Stock Trader

Macroeconomic or systemic changes within the broader economy influence a cyclical stock's price. These stocks are renowned for mirroring the economic cycles through the growth, boom, bust, and recovery phases.| Liberated Stock Trader
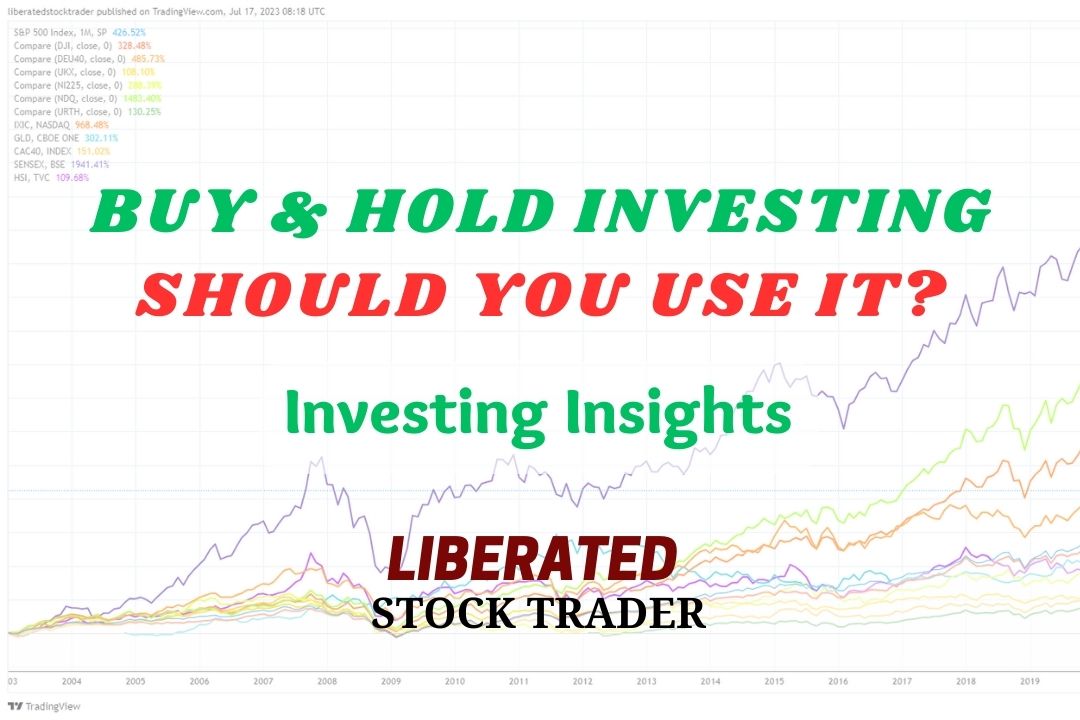
Based on our 30-year research, adopting a buy-and-hold stocks strategy is annually 4% more profitable than actively trading stocks or investing in alternative assets such as corporate bonds, real estate, gold, or treasuries.| Liberated Stock Trader

My research shows the most reliable and accurate bullish patterns are the cup-and-handle, with a 95% bullish success rate, head-and-shoulders (89%), double-bottom (88%), and triple-bottom (87%).| Liberated Stock Trader
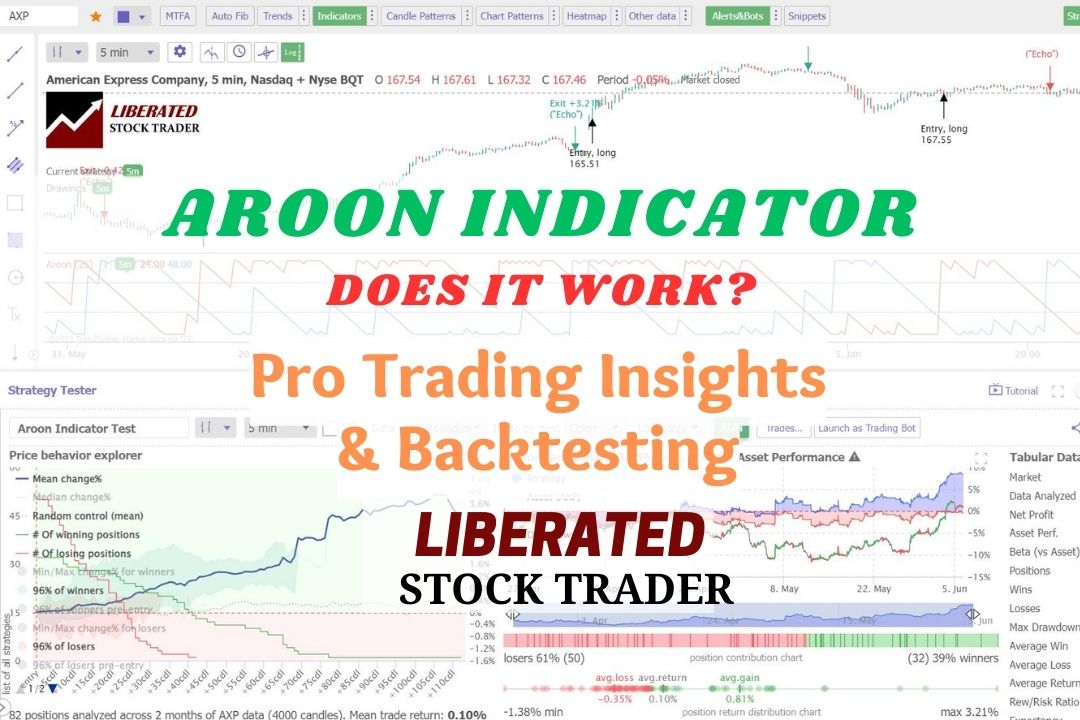
In technical analysis, the Aroon indicator identifies trend reversals and trend strength. This oscillating indicator has two parts: the "Aroon Up" line measures uptrend strength, and the "Aroon Down" line for downtrend strength.| Liberated Stock Trader
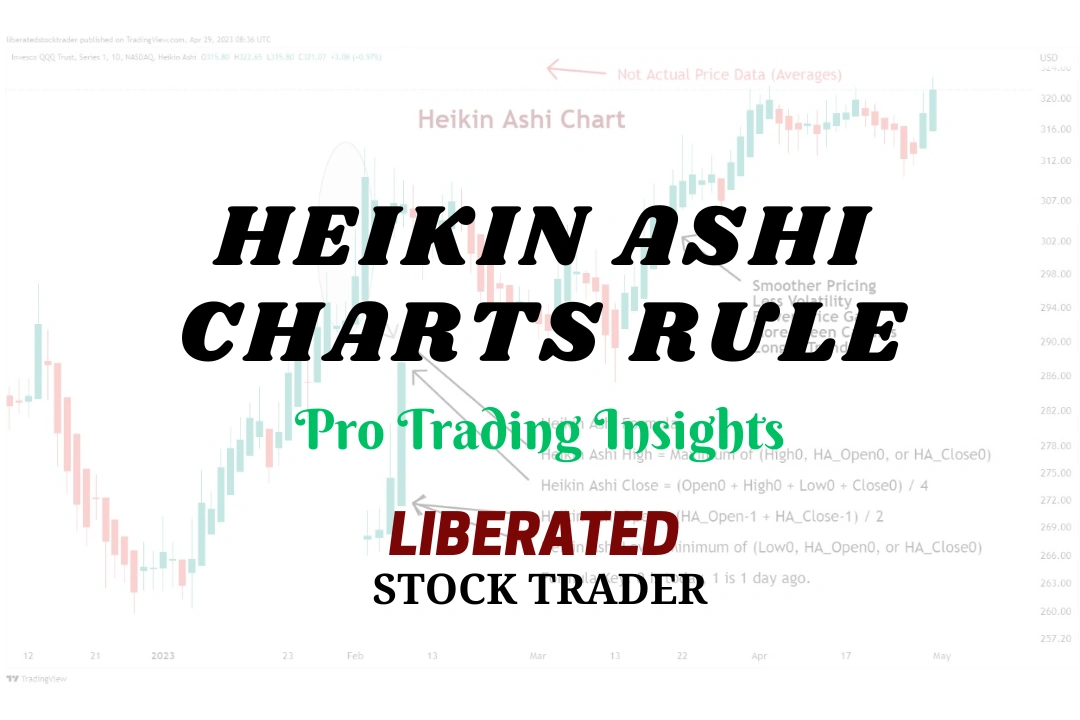
I backtested 360 years of data on the 30 most important US stocks, and our findings prove that Heikin-Ashi chart strategies outperform 66% of equities vs. a buy-and-hold strategy.| Liberated Stock Trader

The Rate of Change (ROC) is a momentum indicator that measures the speed and direction of asset price movements. It helps traders determine whether a security is trending and how quickly its price changes.| Liberated Stock Trader
We are proud to partner with only the best companies in the industry, those that offer first-class products that benefit independent investors. We partner| Liberated Stock Trader

The best moving average settings are SMA or EMA 20 on a daily chart, which achieves a 23% win rate. At settings 50, 100, and 200, it is better to use the Hull moving average, which has win rates of 27%, 10%, and 17%, respectively.| Liberated Stock Trader
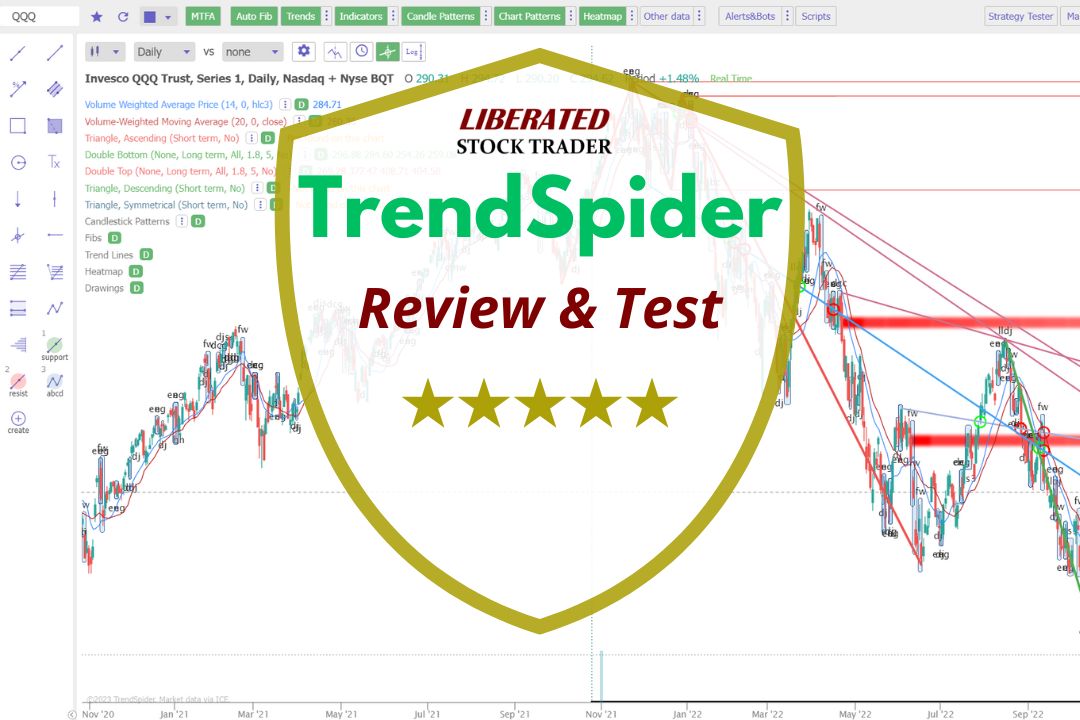
My testing awards Trendspider 4.8/5 stars due to its innovation. Its powerful algorithms recognize trendlines, chart patterns, and candlesticks automatically. It also has automated trading bots, real AI LLMs, and powerful point-and-click back- testing.| Liberated Stock Trader

Our research on 10,400 years of exchange data shows the best day trading indicators are the Price Rate of Change, VWAP, Weighted Moving Average, Hull Moving Average, Simple Moving Average, and RSI.| Liberated Stock Trader
