
What Are Complete Streets and How Can We Build Them?
Complete Streets policies promote safe and equitable outcomes for all road users. Here’s how they do it, and how digital traffic data helps.| StreetLight
Complete Streets policies promote safe and equitable outcomes for all road users. Here’s how they do it, and how digital traffic data helps.| StreetLight
As traffic patterns shift, traditional road traffic counter methods increasingly fall short — but transportation analytics can fill in the gaps.| StreetLight

How a protected bike lane in North Kansas City impacted ridership, speeding, and congestion.| StreetLight
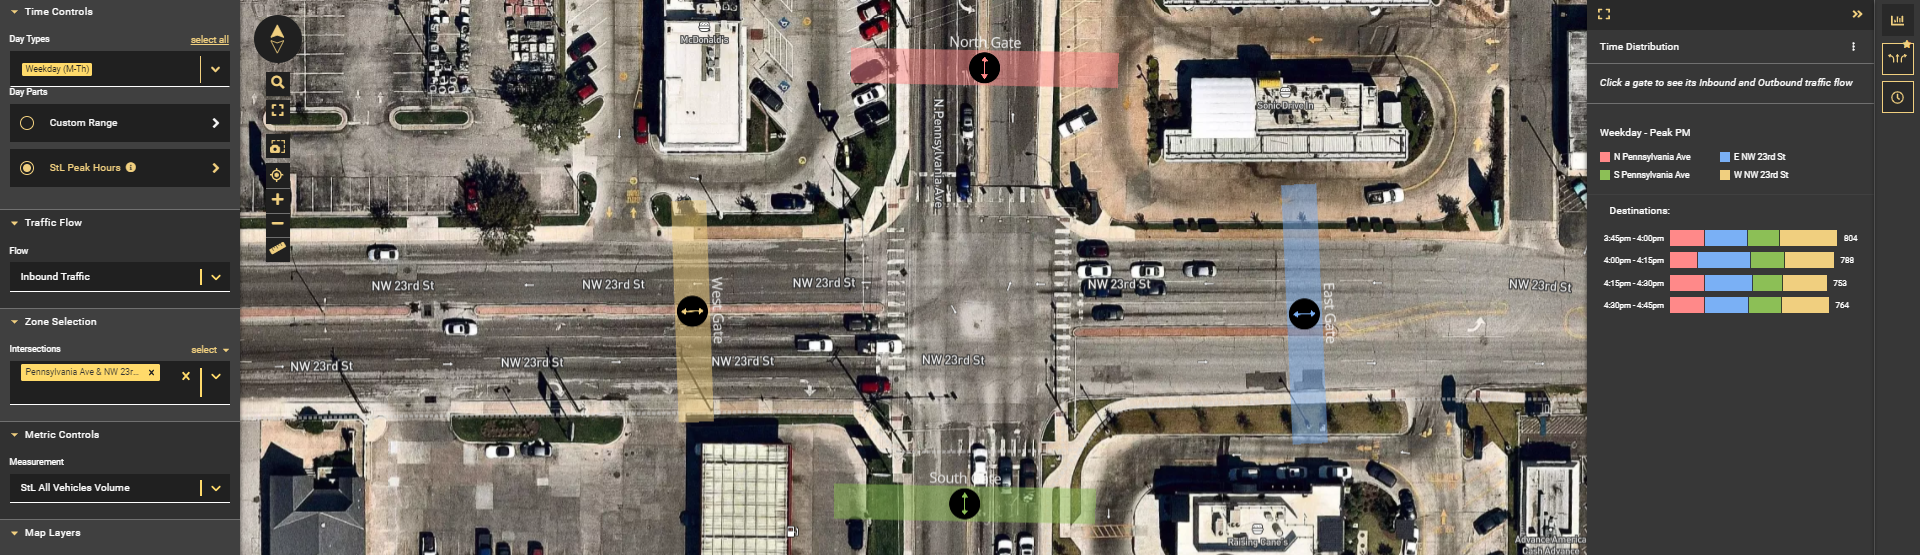
Learn how you can use turning movement counts to facilitate safety planning, signal retiming, commuter and tourism planning, and retail site selection.| StreetLight
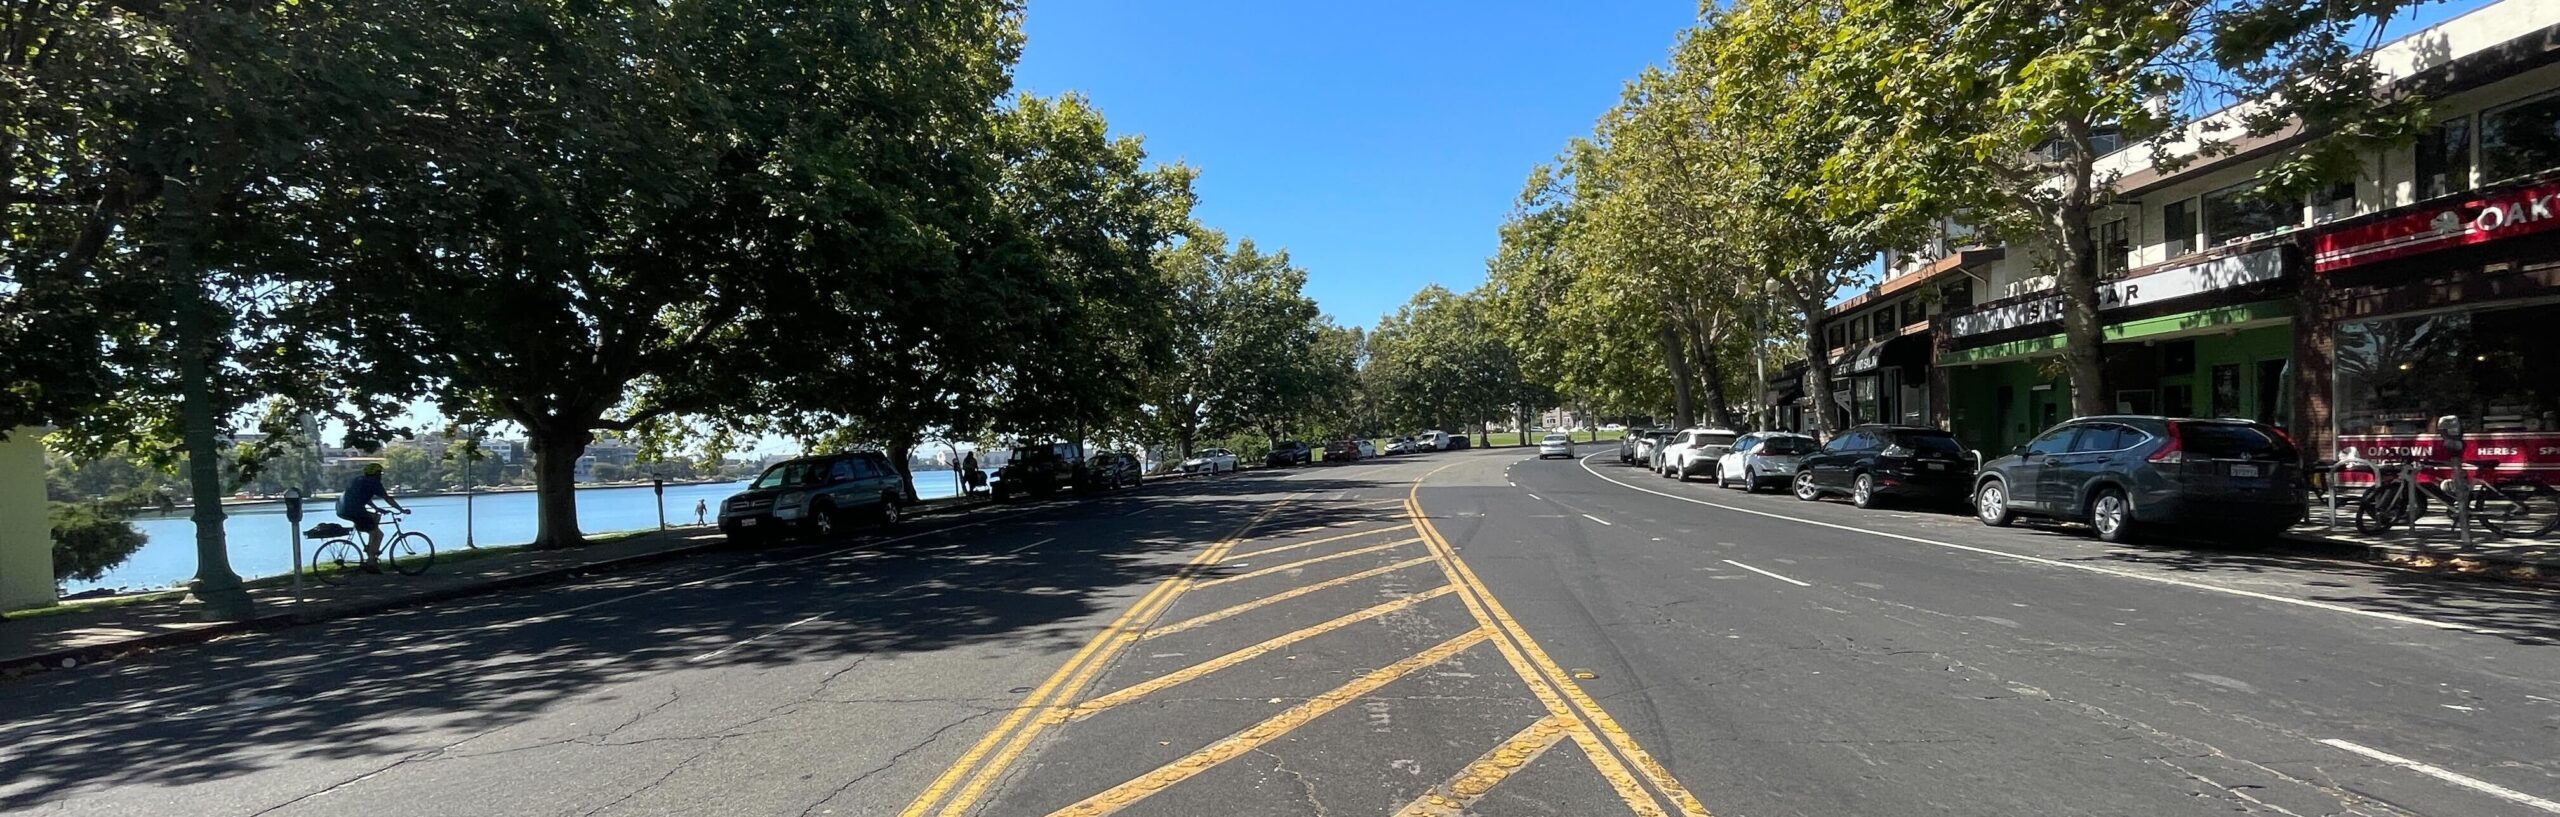
In Oakland, CA, 2023 plans for Grand Ave. prioritize traffic flow over road safety, but big data analysis could support a traffic calming strategy that balances both.| StreetLight
What is AADT? Annual Average Daily Traffic data is key to successful transportation planning, and analytics are making it more powerful.| StreetLight

Road diets remove lanes to improve safety, cut emissions, and calm traffic. See real road diet examples and the data behind their success.| StreetLight
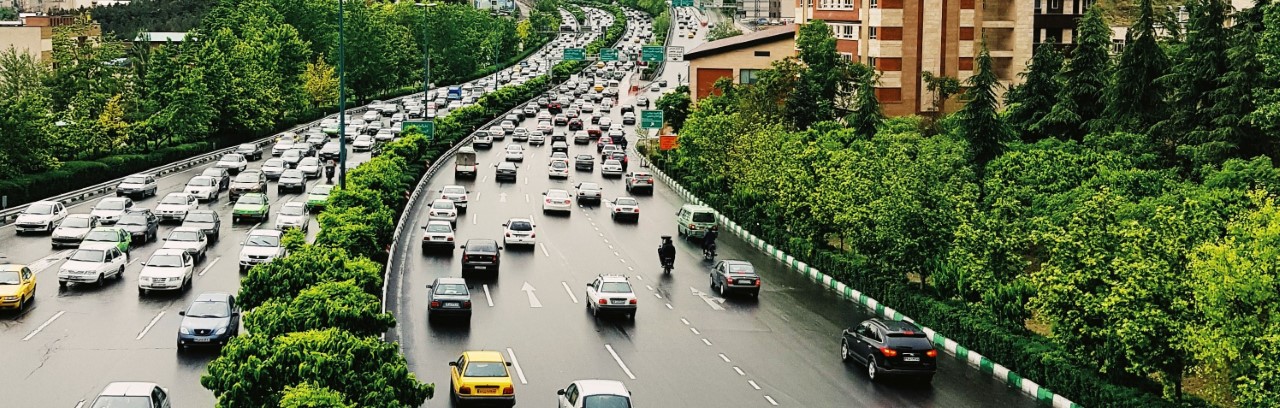
Solve traffic congestion in your region without costly highway expansion using these strategies.| learn.streetlightdata.com
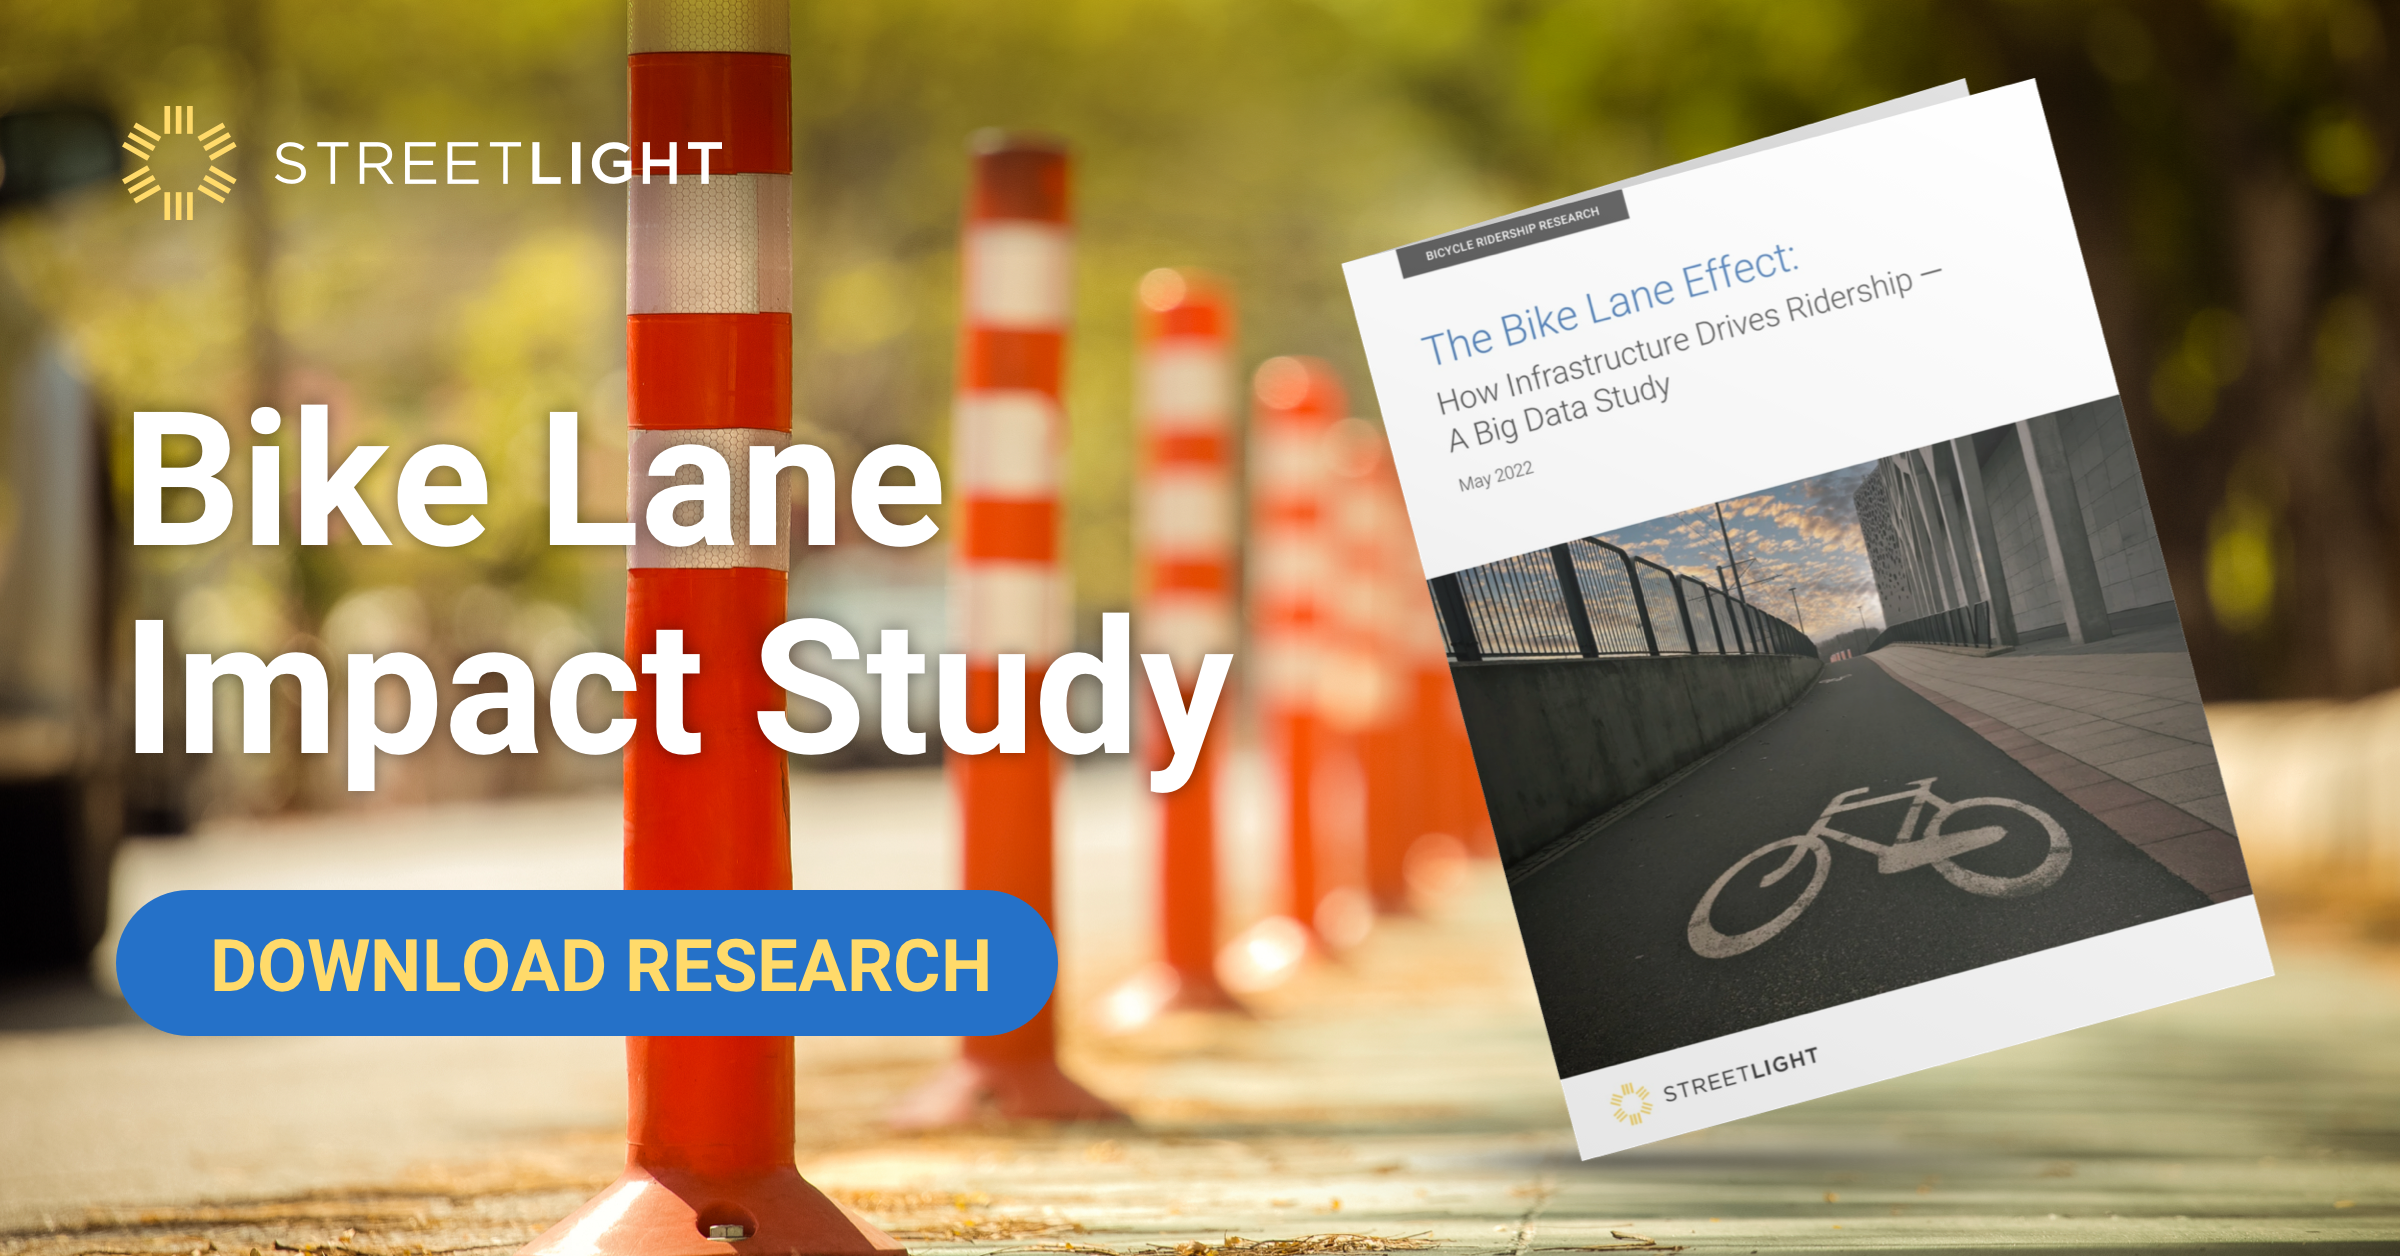
How a bike lane changed ridership in Waterloo, Ontario| learn.streetlightdata.com
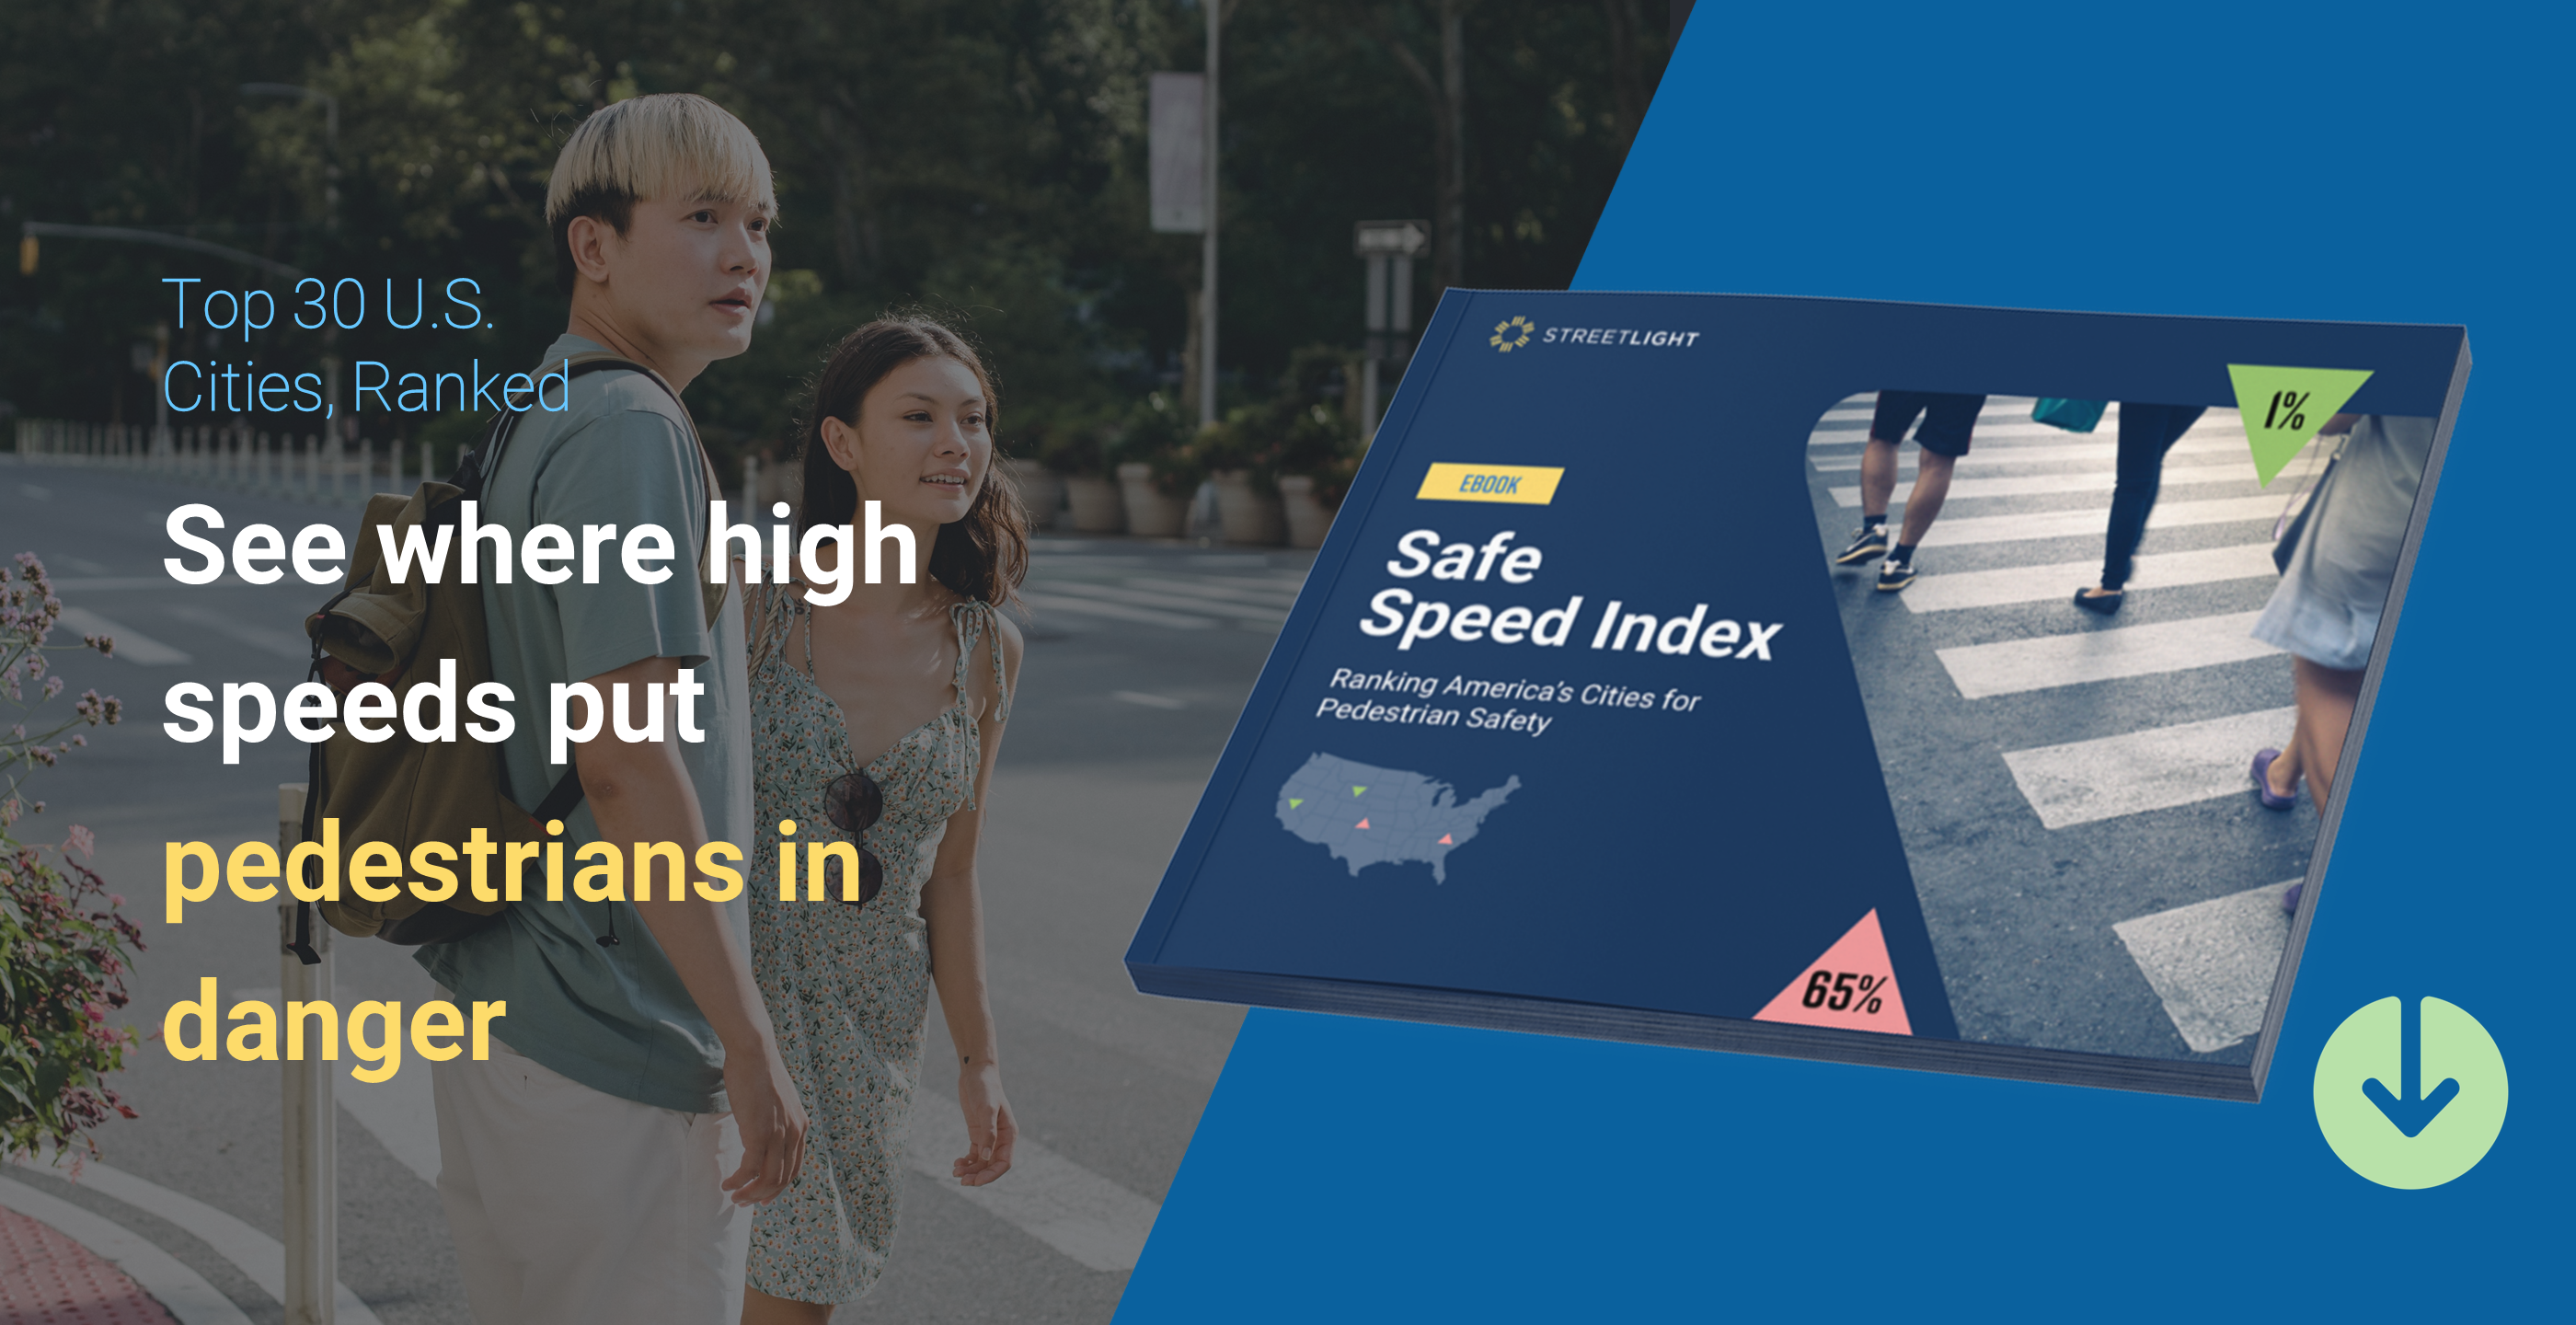
See where the top 30 American cities rank on unsafe traffic speeds and learn how you can use speed data to advance pedestrian safety.| learn.streetlightdata.com
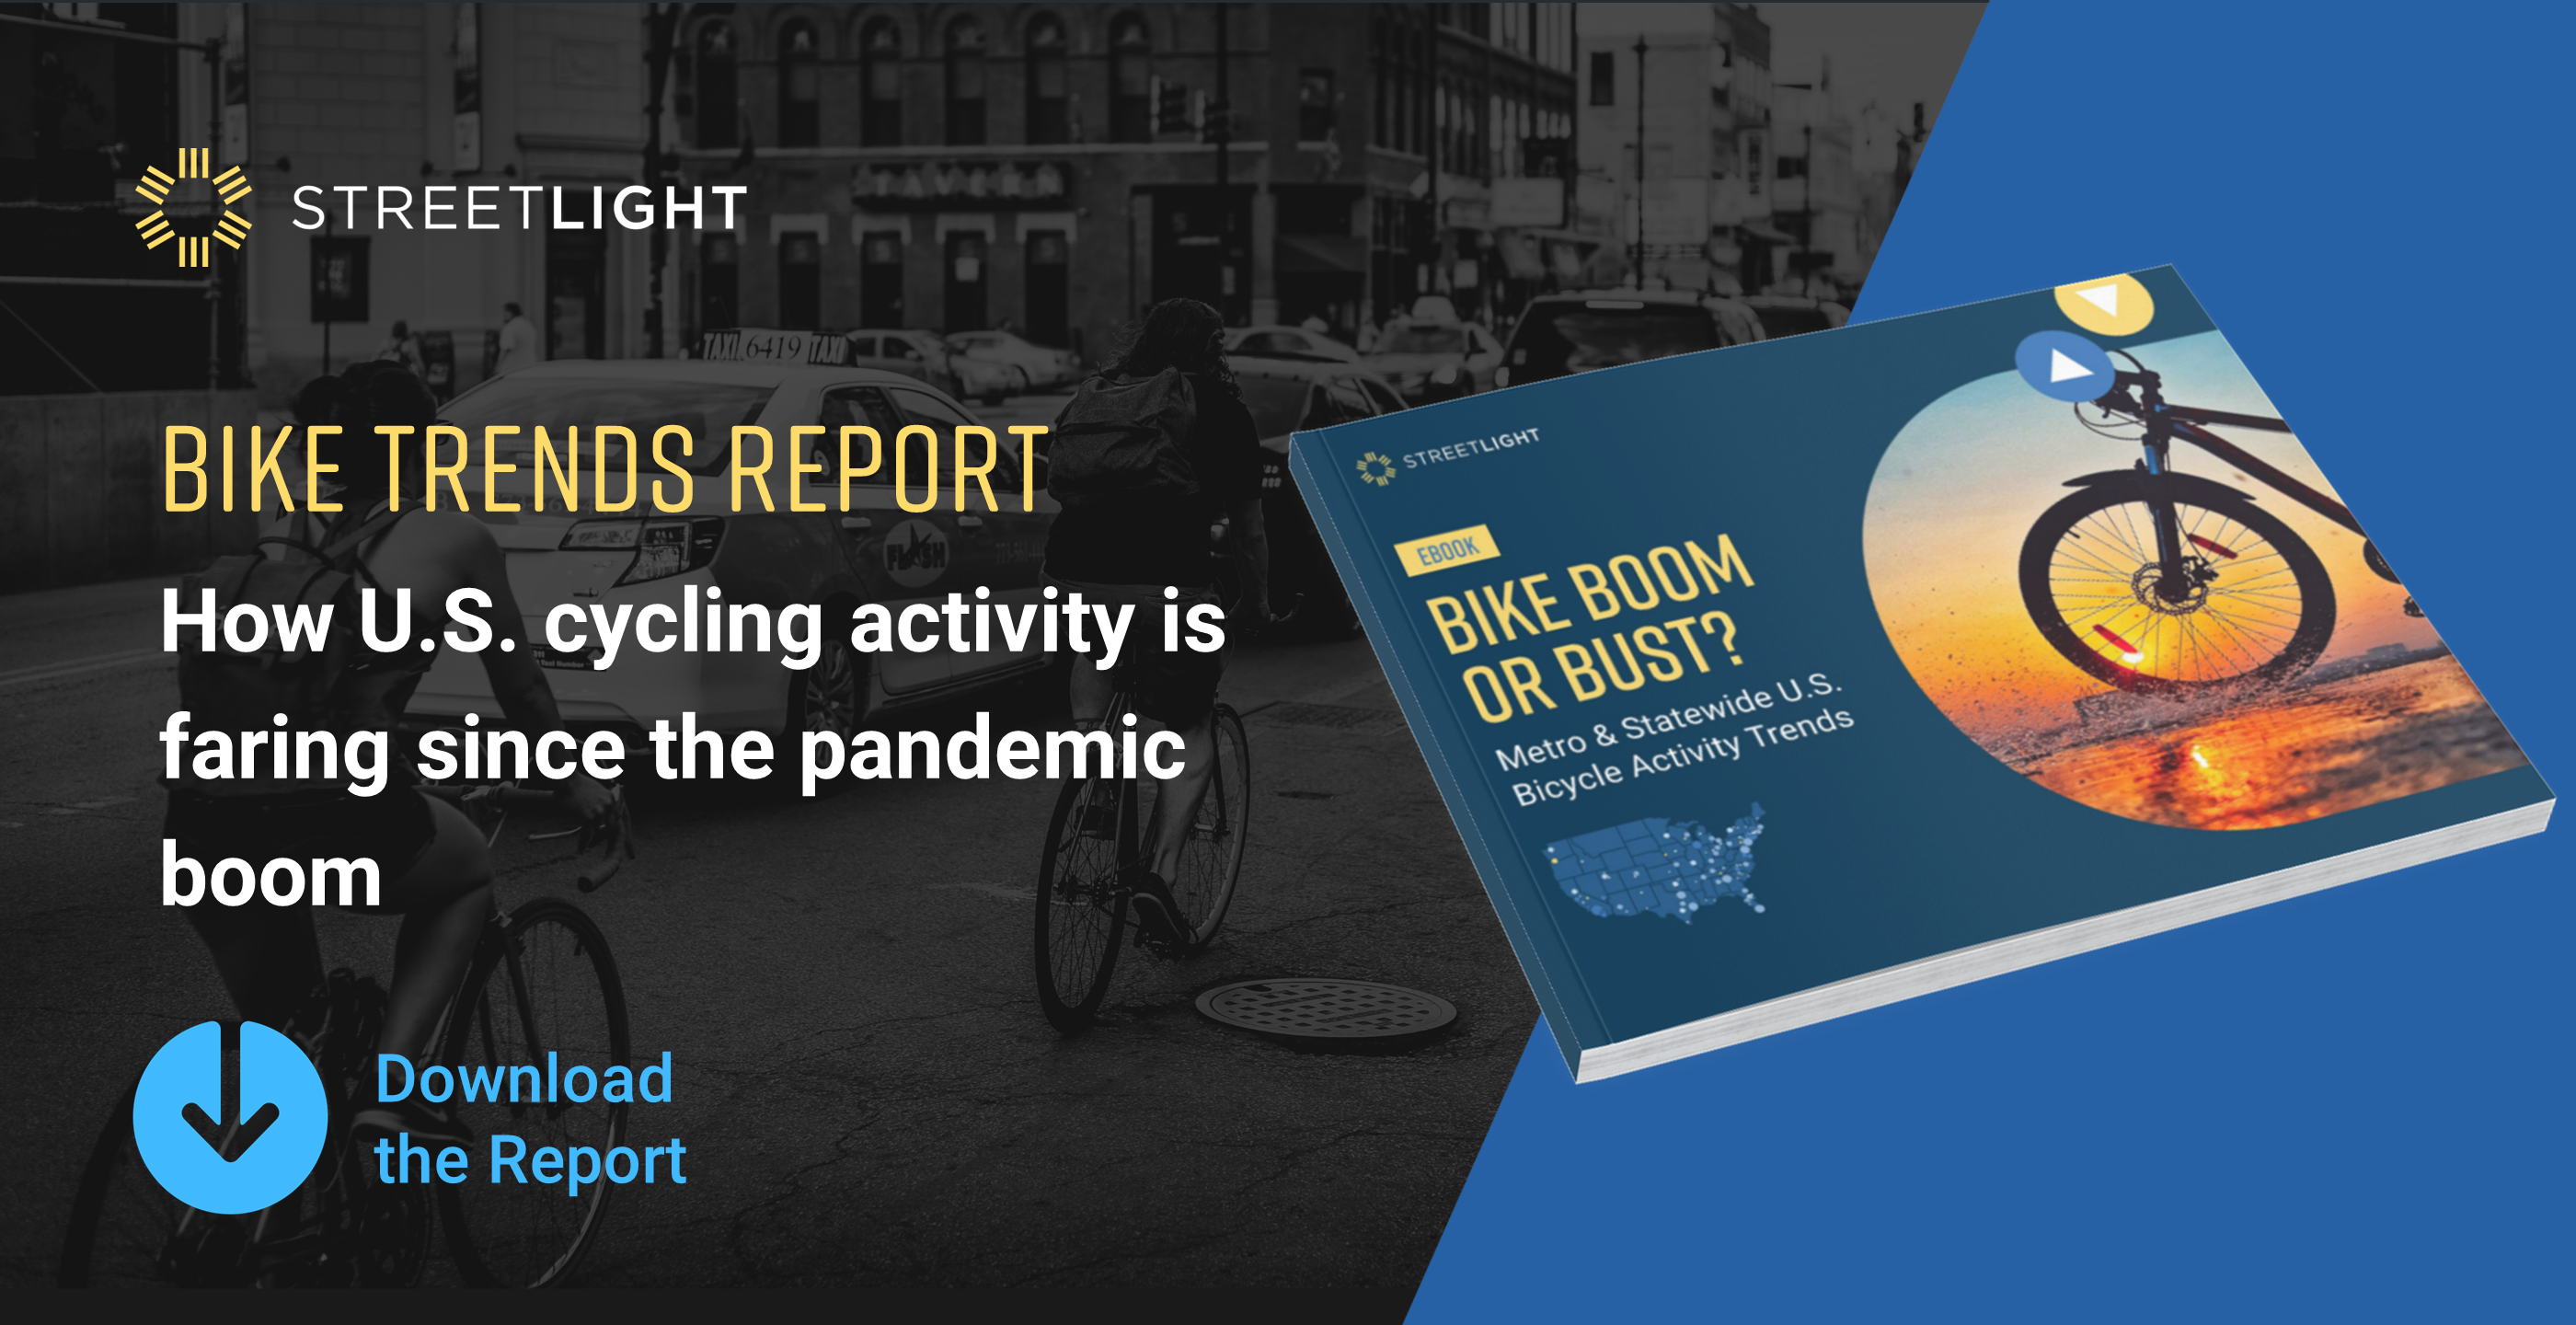
In 2020, headlines touted a boost in biking activity. Our new report explores the latest bike analytics to determine whether that lasted, and where daily bicycle volumes have grown the most.| learn.streetlightdata.com

This handbook shows how vehicle, bicycle, and pedestrian analytics can power transportation safety initiatives like Vision Zero, Complete Streets, MIRE, and work zone safety.| learn.streetlightdata.com
With pedestrian activity declining, our new analysis of walking and mode share data shows where U.S. cities and states rank and what this means for safety.| learn.streetlightdata.com
