Data Visualization and Dashboards — For Everyone | GoodData
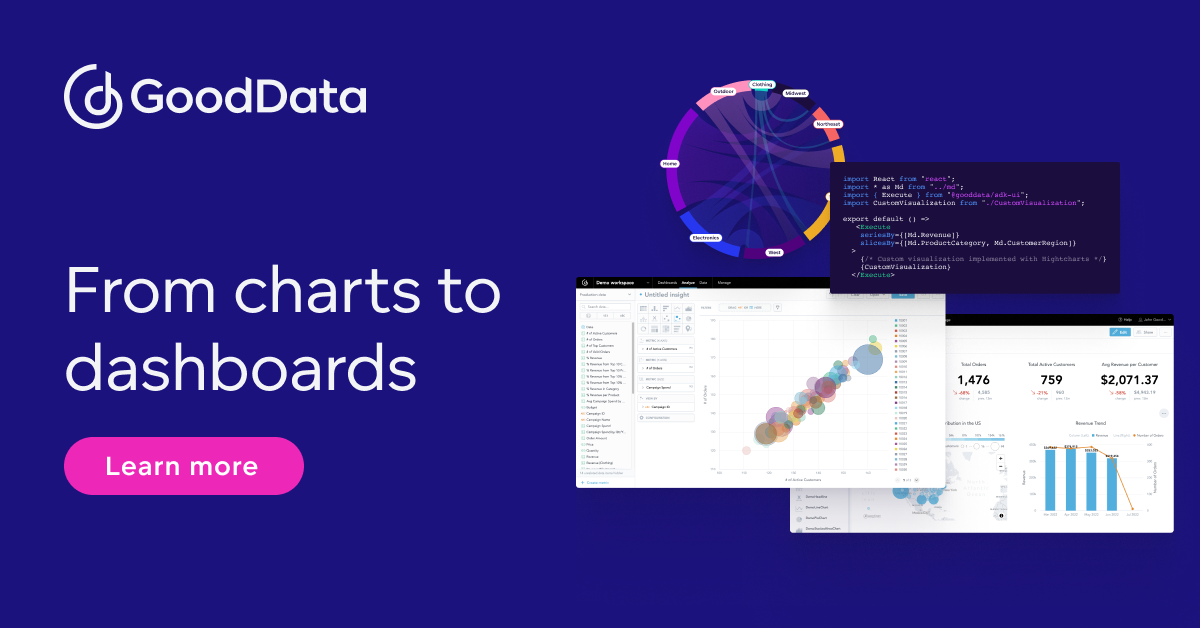
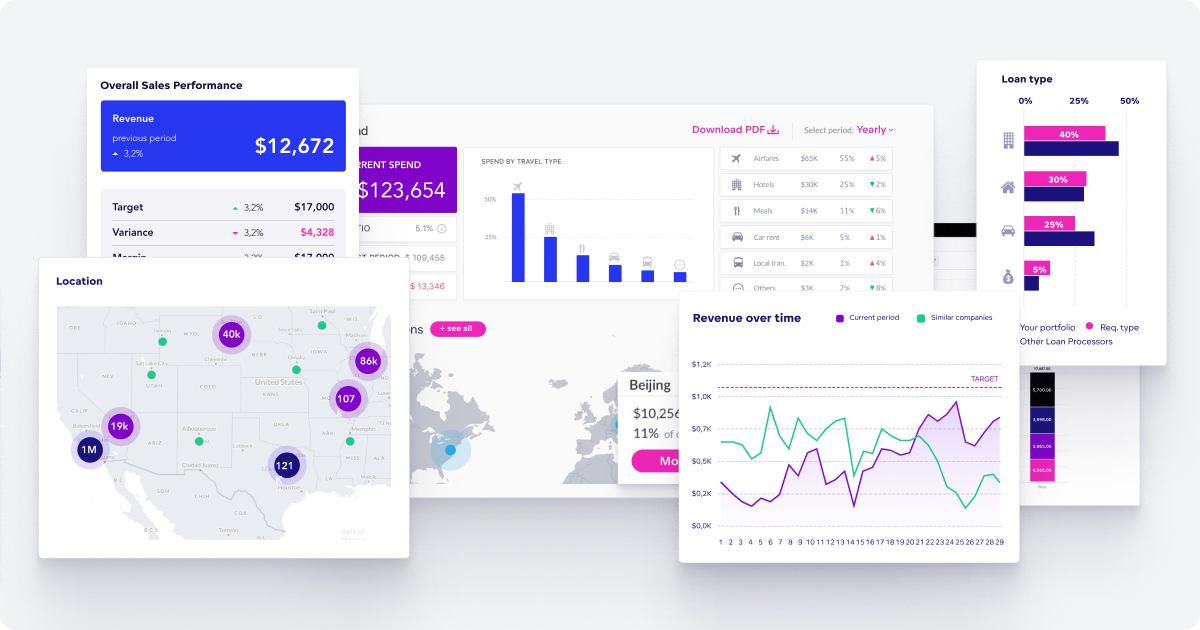
Deliver out-of-the-box or customized data visualizations to your end users. Use drag-and-drop UI to change metrics, add filters, and drill deeper into visualizations.| GoodData
Deliver out-of-the-box or customized data visualizations to your end users. Use drag-and-drop UI to change metrics, add filters, and drill deeper into visualizations.| GoodData

Learn how advanced analytics were built into Zendesk's UI in 90 days to provide 40,000+ companies around the world with beautifully simple customer service.| GoodData
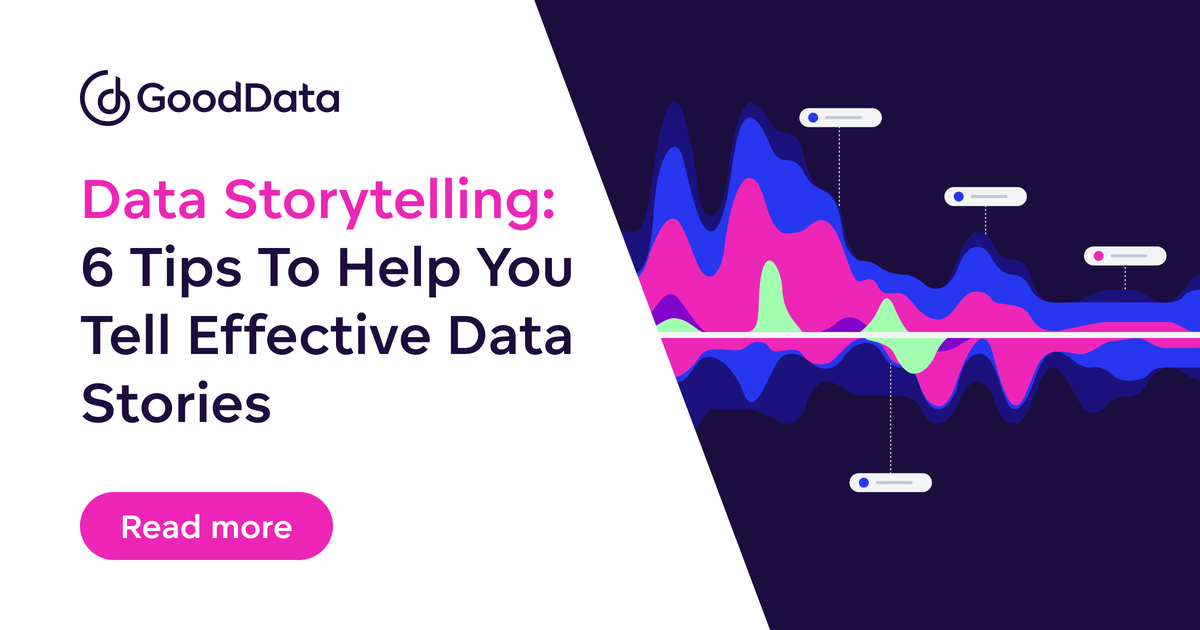
Learn how to transform data into meaningful narratives that encourage data-driven action.| GoodData
Everything you need to know to create interactive and customizable dashboards that empower the end user.| GoodData

These data visualization best practices will help you to turn your data into insights that everyone can understand.| GoodData
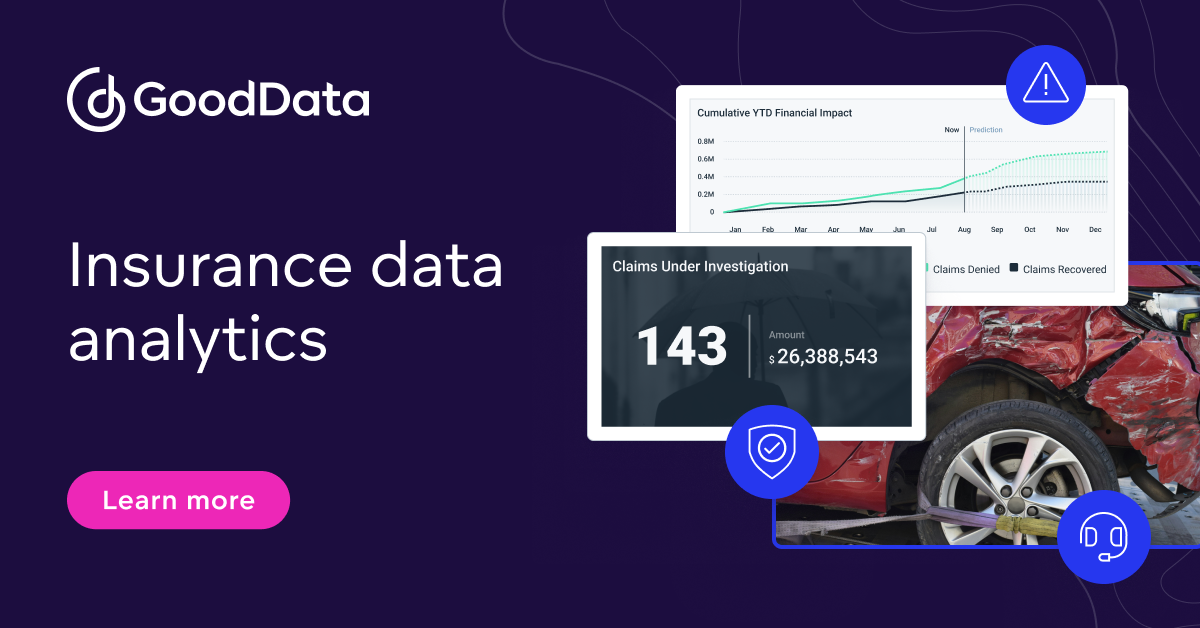
GoodData’s insurance analytics helps organizations improve processes and quickly deliver rich insights to adjusters, underwriters, sales teams, and more.| GoodData
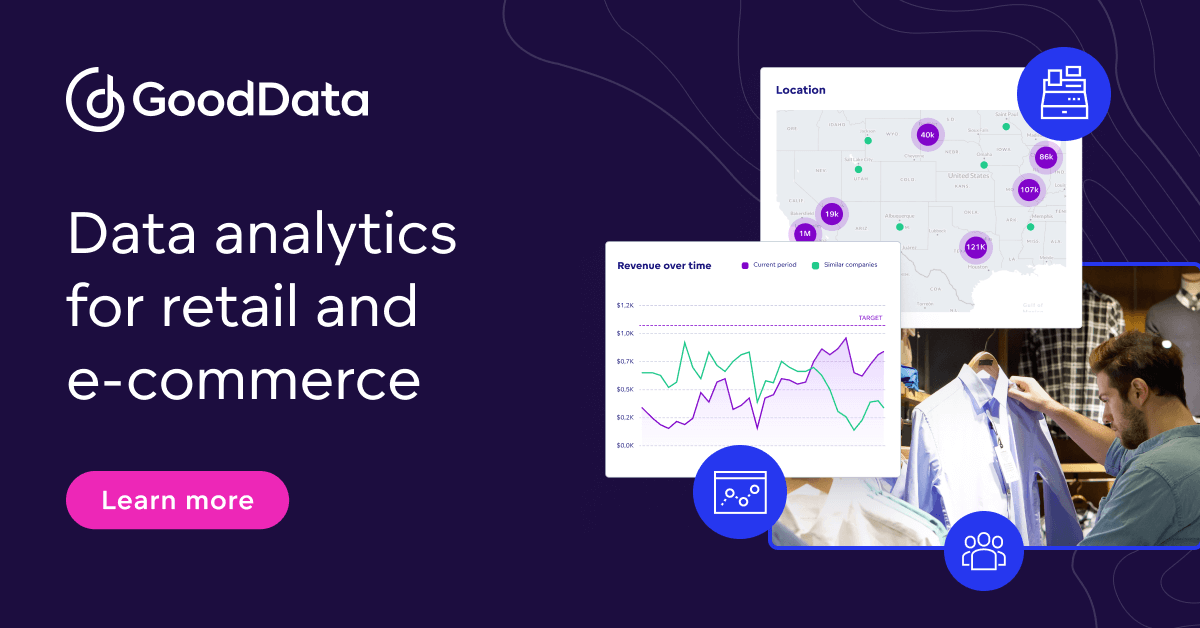
GoodData’s e-commerce and retail analytics helps retailers and brands streamline planning and inventory, drive marketing, and understand customer behavior.| GoodData
Learn the definition of real-time data analytics, as well as your data stack needs and who benefits from data in real time.| GoodData

Interactive data visualizations enable users to engage with data. Learn how they offer flexibility in how to display your data.| GoodData
