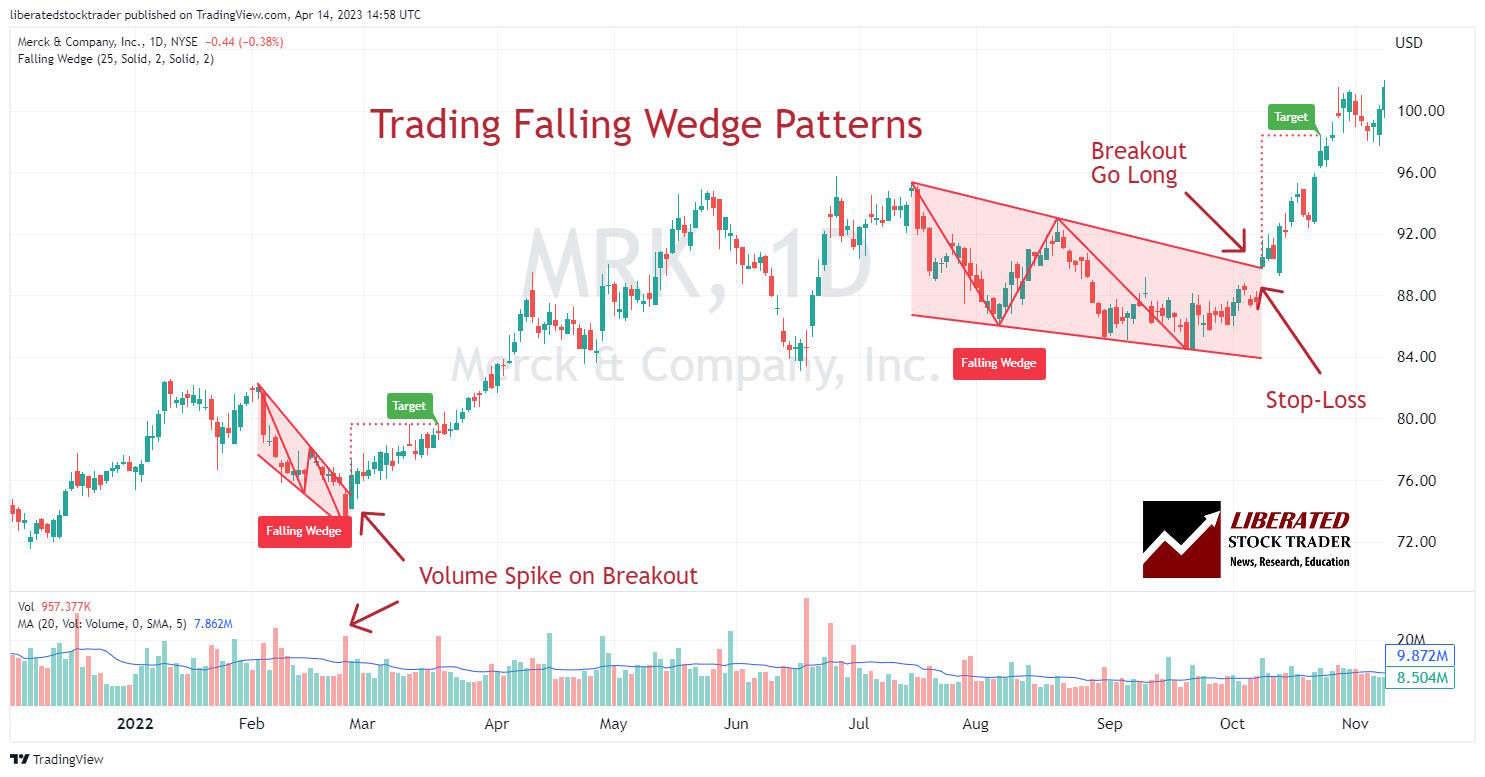
Trading a Falling Wedge for a 74% Success Rate and 38% Profit!
According to published research, the falling wedge pattern has a 74% success rate in bull markets with an average potential profit of +38%.| Liberated Stock Trader
According to published research, the falling wedge pattern has a 74% success rate in bull markets with an average potential profit of +38%.| Liberated Stock Trader
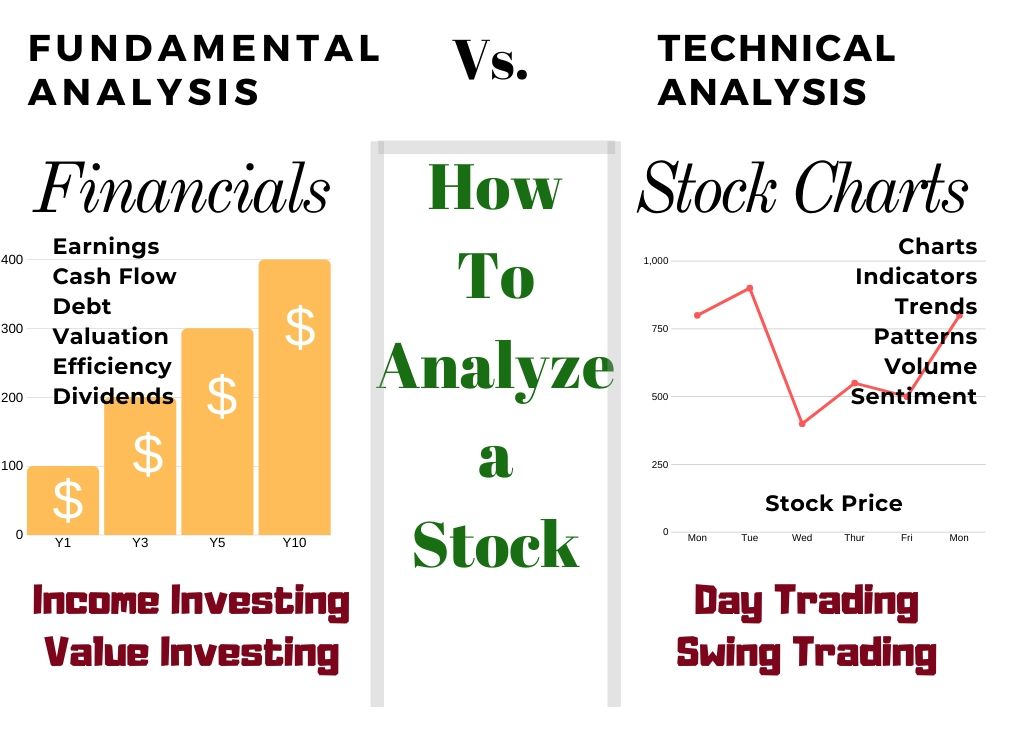
There are two ways to analyze stocks. Fundamental analysis, which evaluates criteria such as PE ratio, earnings, and cash flow. Technical analysis, which involves studying charts, stock prices, volume, and indicators.| Liberated Stock Trader

Be careful when trading bearish flags. According to published research, the bear flag pattern has a low success rate of 45%. This means you are flipping a coin when trading this pattern, as the odds are not in your favor. The high-tight bear flag is the only flag pattern you should trade.| Liberated Stock Trader
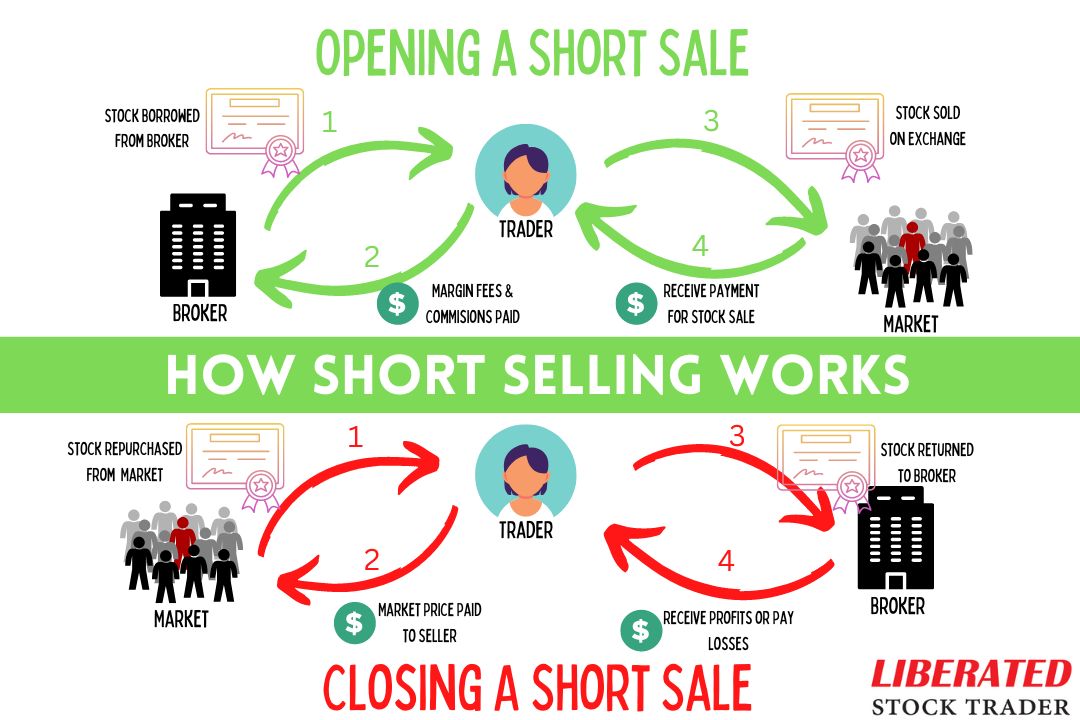
Short-selling is the most difficult trading skill to master. The stock market's default direction is up, so betting against a company in a bull market is extremely risky and likely to result in losses.| Liberated Stock Trader
Decades of research have proven the most predictable bearish chart patterns are the inverted cup-and-handle, with an average price decrease of 17%, the rectangle top (-16%), head-and-shoulders (-16%), and the descending triangle (-15%).| Liberated Stock Trader
My research shows the most reliable and accurate bullish patterns are the cup-and-handle, with a 95% bullish success rate, head-and-shoulders (89%), double-bottom (88%), and triple-bottom (87%).| Liberated Stock Trader

There are two types of continuation patterns: bullish and bearish. Bullish continuation patterns occur when the market is trending upwards, while bearish continuation patterns happen when the market is trending downwards.| Liberated Stock Trader

Professional analysts define all stock market trends using timeframe and direction: Timeframes are short-term, medium-term, and long-term. Direction is described using uptrend, downtrend, or consolidation.| Liberated Stock Trader

From my experience in trading real-time news events, you should seek to gather and interpret the financial newsfeed as quickly as possible to initiate short-term trades to take advantage of profitable situations.| Liberated Stock Trader
Research shows that the most reliable chart patterns are the Head and Shoulders, with an 89% success rate, the Double Bottom (88%), and the Triple Bottom and Descending Triangle (87%). The Rectangle Top is the most profitable, with an average win of 51%, followed by the Rectangle Bottom with 48%.| Liberated Stock Trader
