Chart indicators are tools traders use to attempt to predict the future direction of a stock's price. They are used to analyze historical data and trends, such as price, volume, and momentum, so traders can decide which stocks to buy or sell. Our research provides a unique analysis of the reliability, success rates, and how to trade the most important stock chart indicators.| Liberated Stock Trader
Learn stock market investing with the complete online stock trading course by Barry D. Moore, a certified financial analyst from the International Federation of Technical Analysts (IFTA).| Liberated Stock Trader
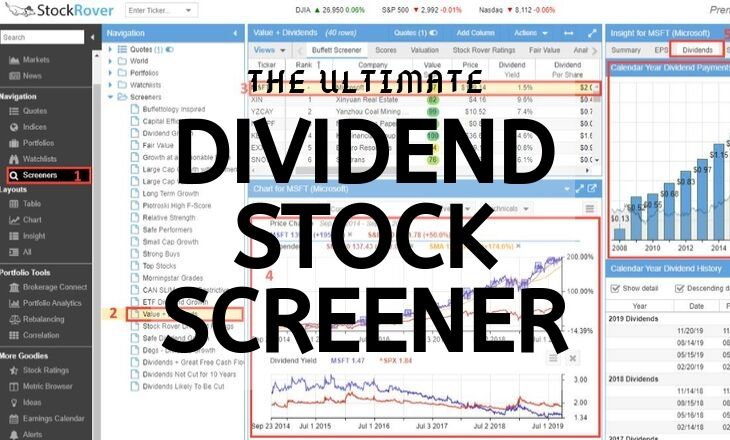
Our research shows you how to create the best dividend stock screener; you must decide on a high-yield, safe, or dividend growth strategy. Next, choose our tested criteria for your screener, like payout ratio, yield, and coverage.| Liberated Stock Trader
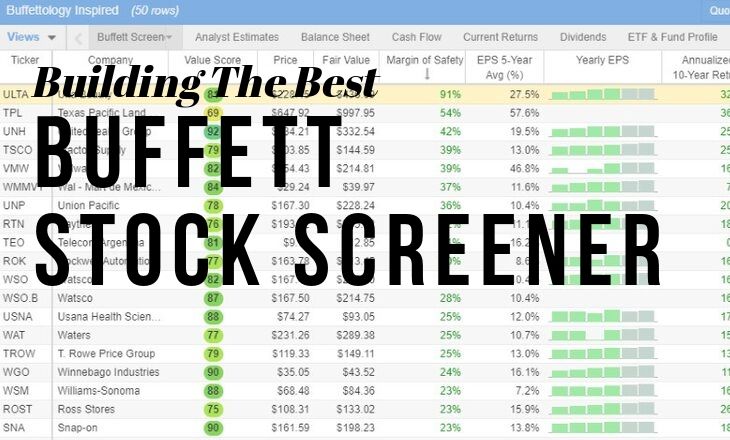
The best Buffett and Graham stock screener is Stock Rover, which provides eight fair value, intrinsic value, and forward cash flow calculations to help you build a great portfolio.| Liberated Stock Trader
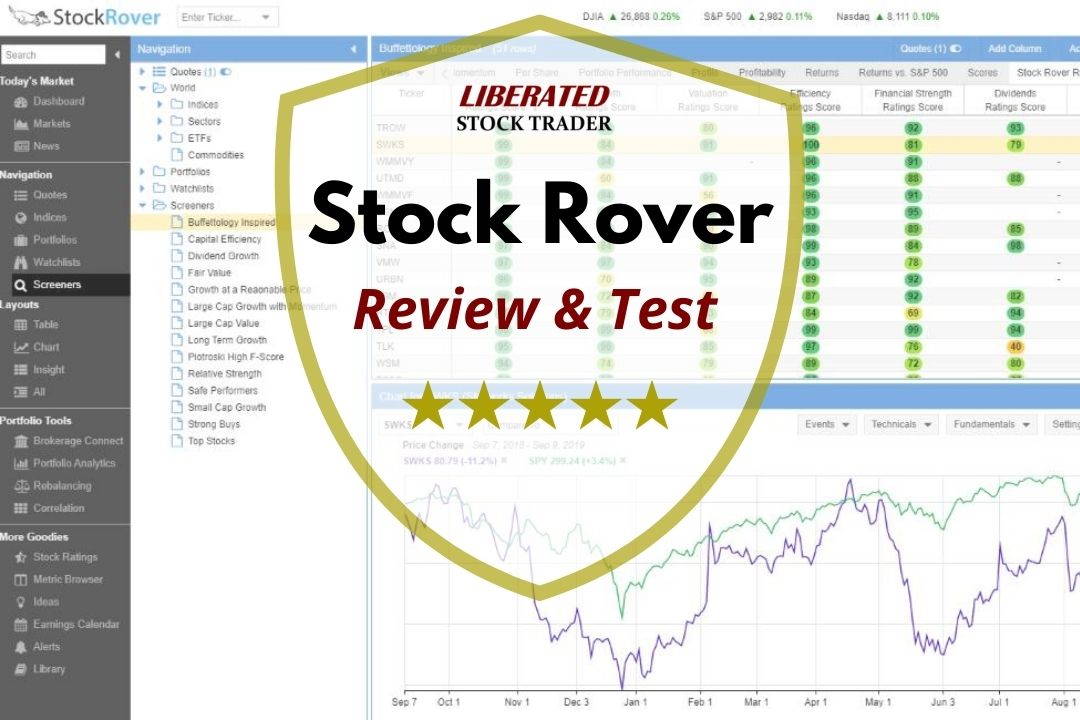
LiberatedStockTrader's review testing awards Stock Rover 4.7 stars. Its advanced screening, research, and portfolio tools are ideal for US value, income, and growth investors. With 650 financial metrics on 10,000 stocks and 44,000 ETFs, we rate Stock Rover the number one stock screener.| Liberated Stock Trader
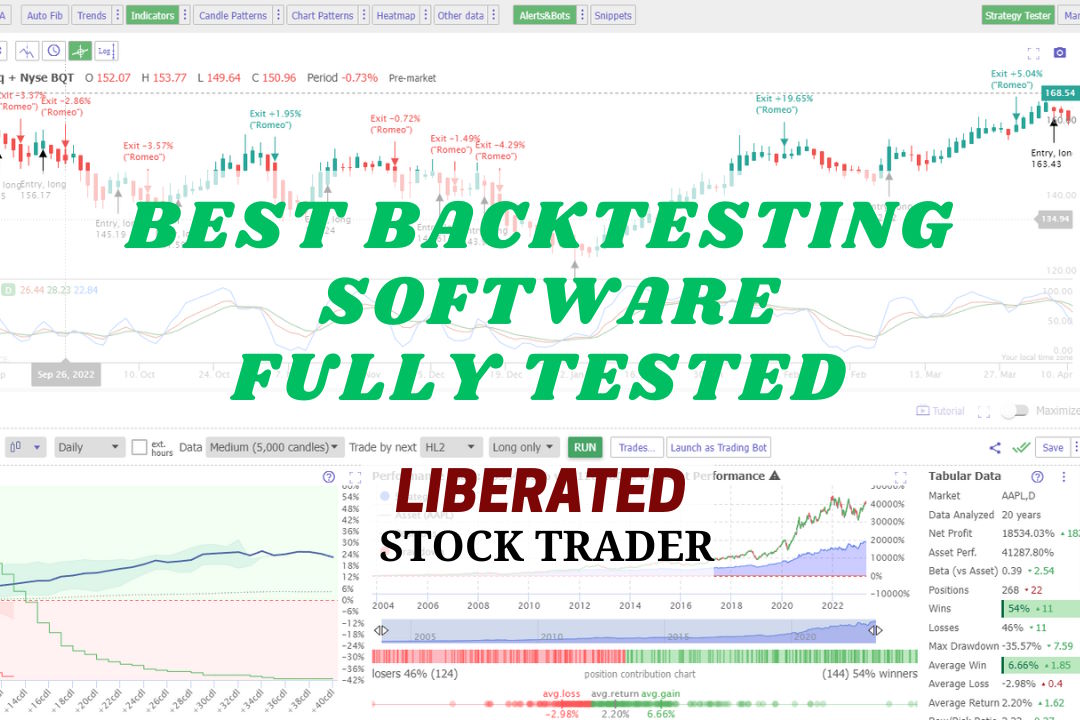
My research shows the best stock backtesting and auto-trade software are TrendSpider, Trade Ideas, and Tradingview. My testing process selected TrendSpider as the overall winner because it offers the most flexible, code-free, multilayer backtesting.| Liberated Stock Trader