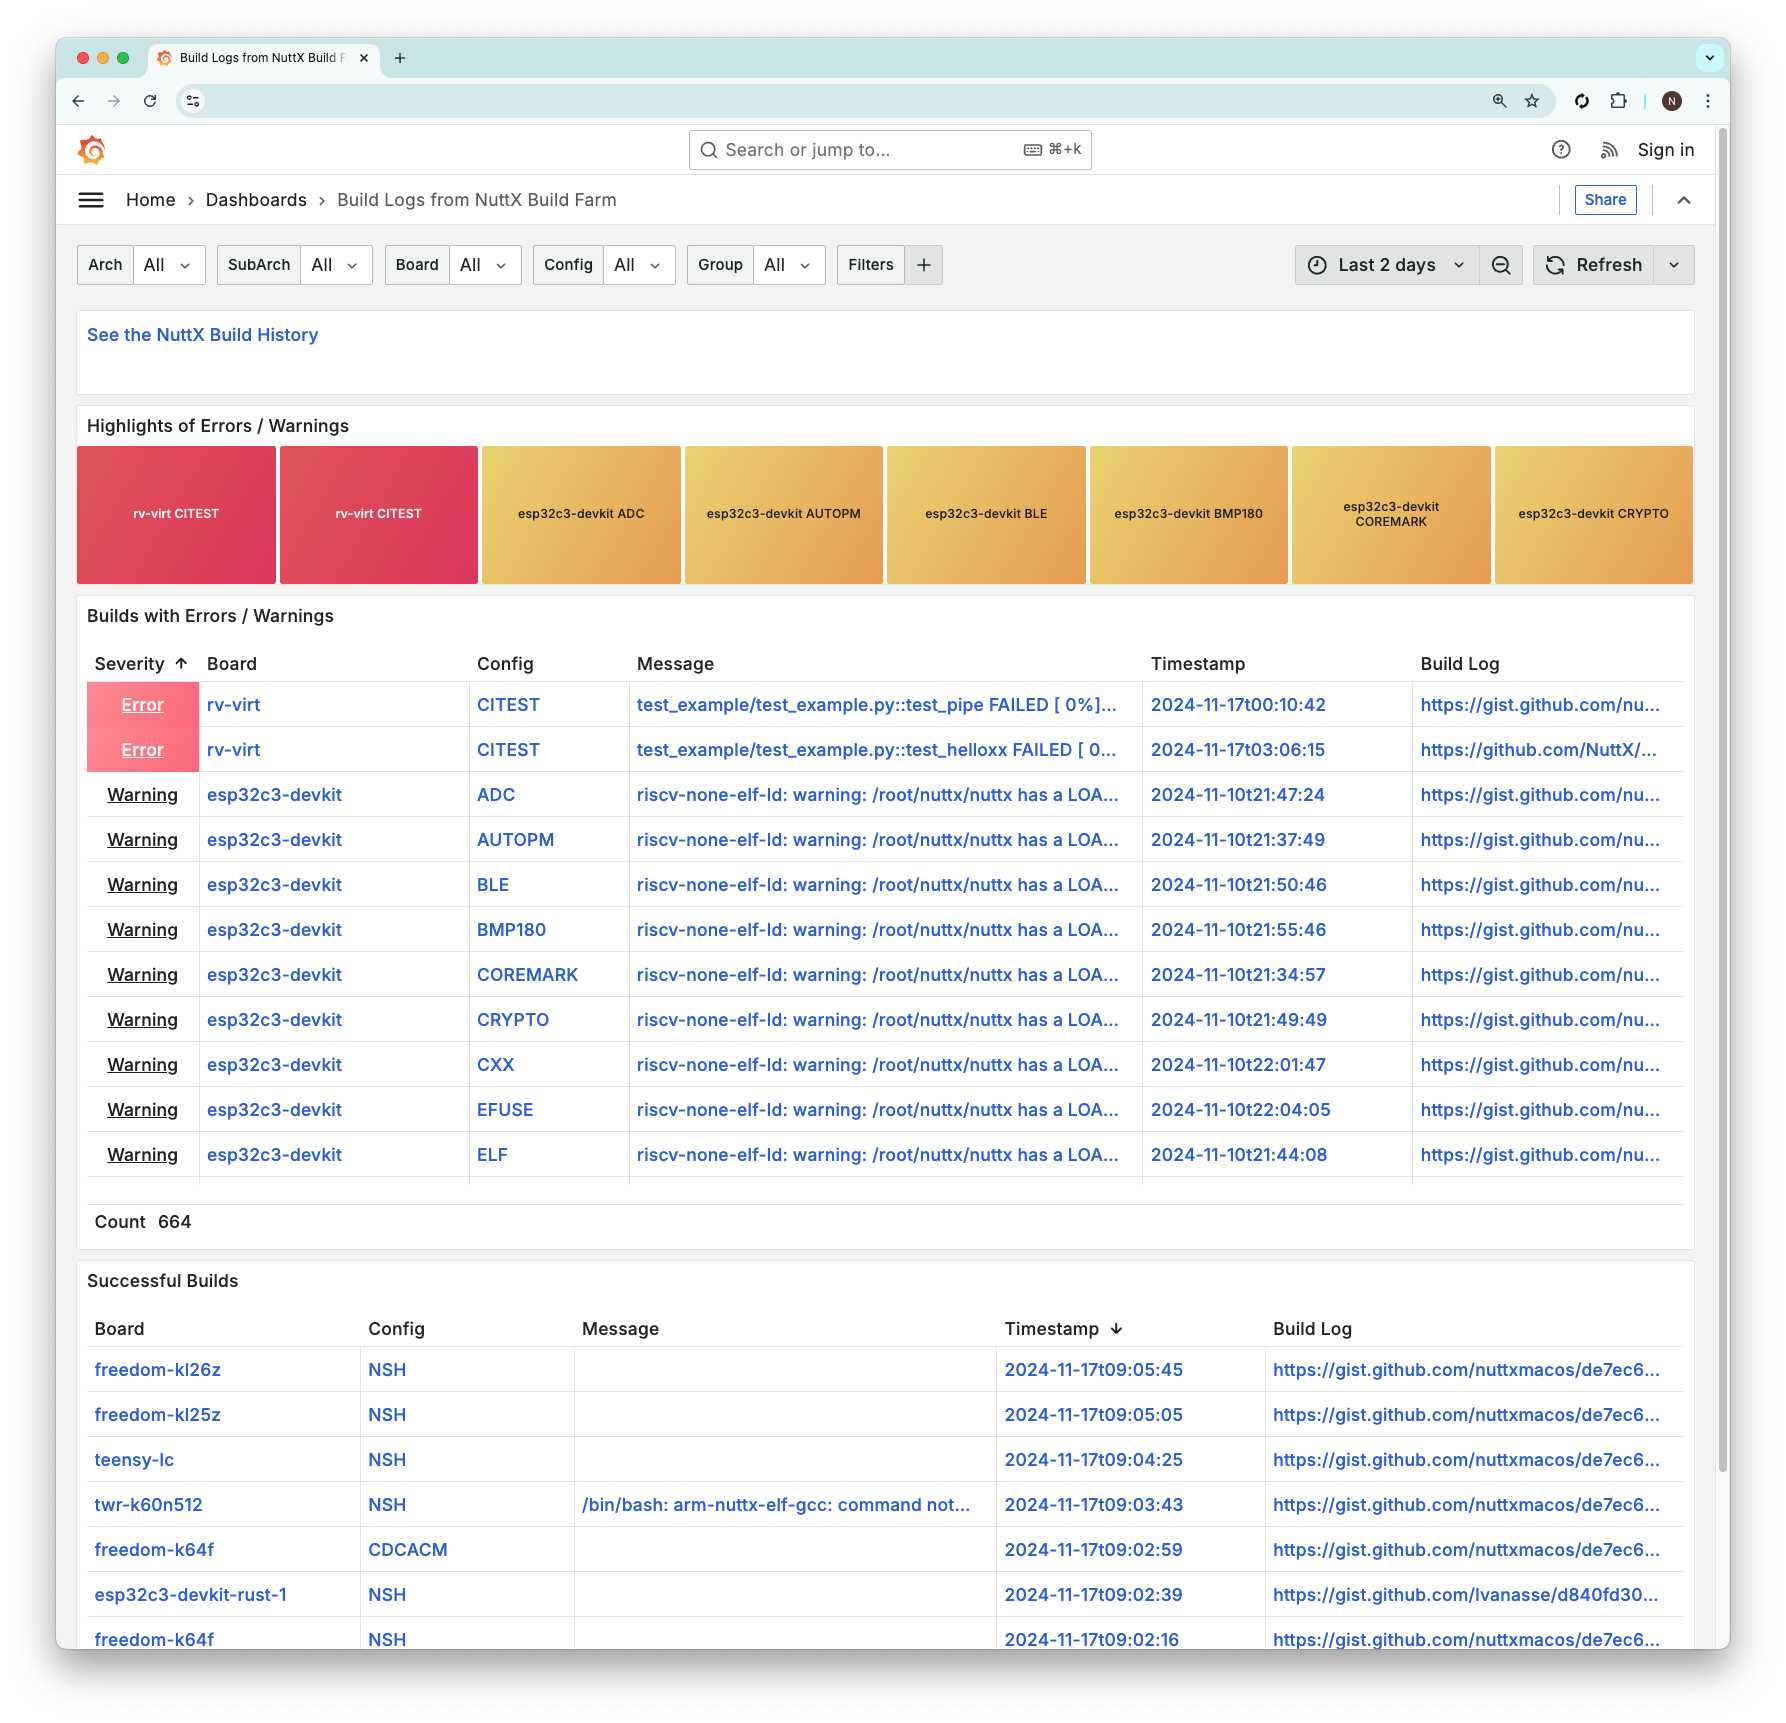
Last article we spoke about the (Twice) Daily Builds for Apache NuttX RTOS. Today we talk about Monitoring the Daily Builds (also the NuttX Build Farm) with our new NuttX Dashboard.| lupyuen.github.io
An open-source monitoring system with a dimensional data model, flexible query language, efficient time series database and modern alerting approach.| prometheus.io
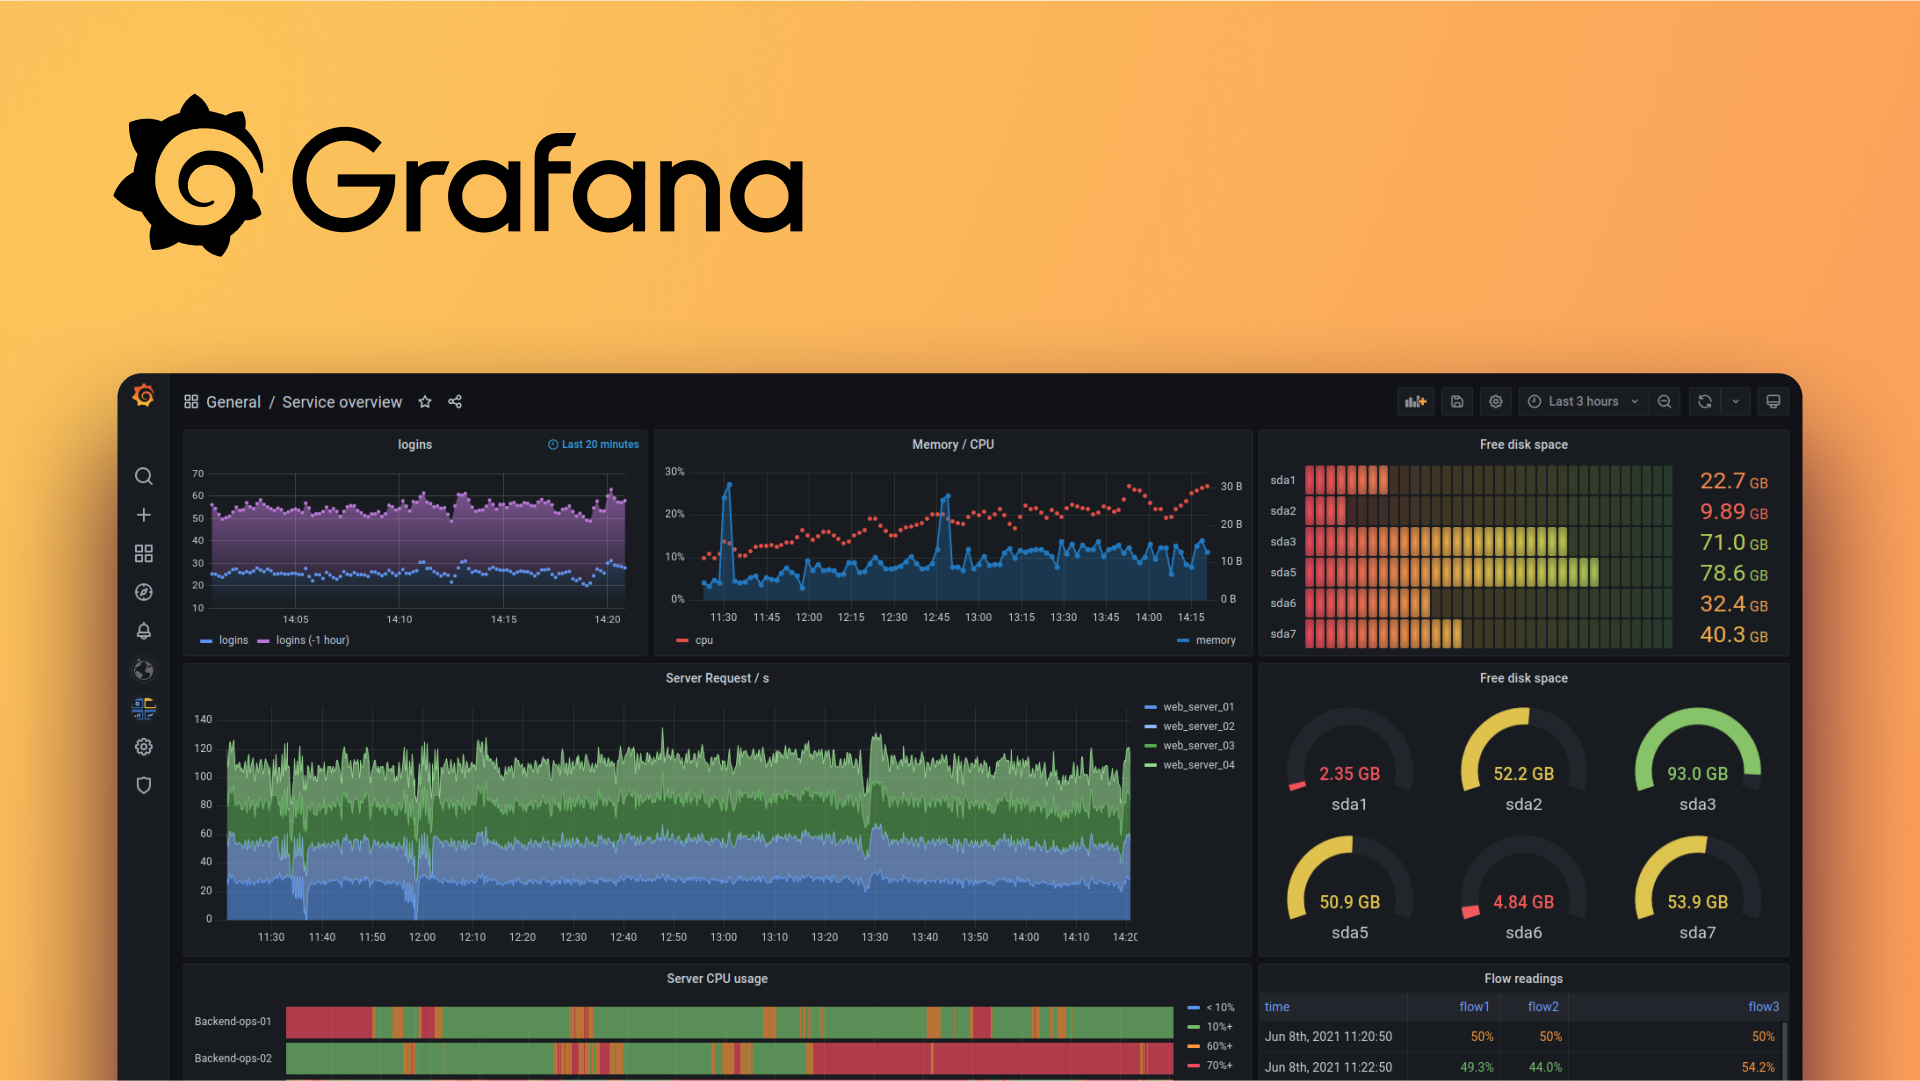
Improve operational efficiency, monitor your infrastructure, and analyze metrics, logs, and traces with Grafana, the leading open source tool for dashboards and visualizations.| Grafana Labs
An open-source monitoring system with a dimensional data model, flexible query language, efficient time series database and modern alerting approach.| prometheus.io
An open-source monitoring system with a dimensional data model, flexible query language, efficient time series database and modern alerting approach.| prometheus.io