Modern Charts in Looker Studio: A New Era of Data Visualization - Data Bloo
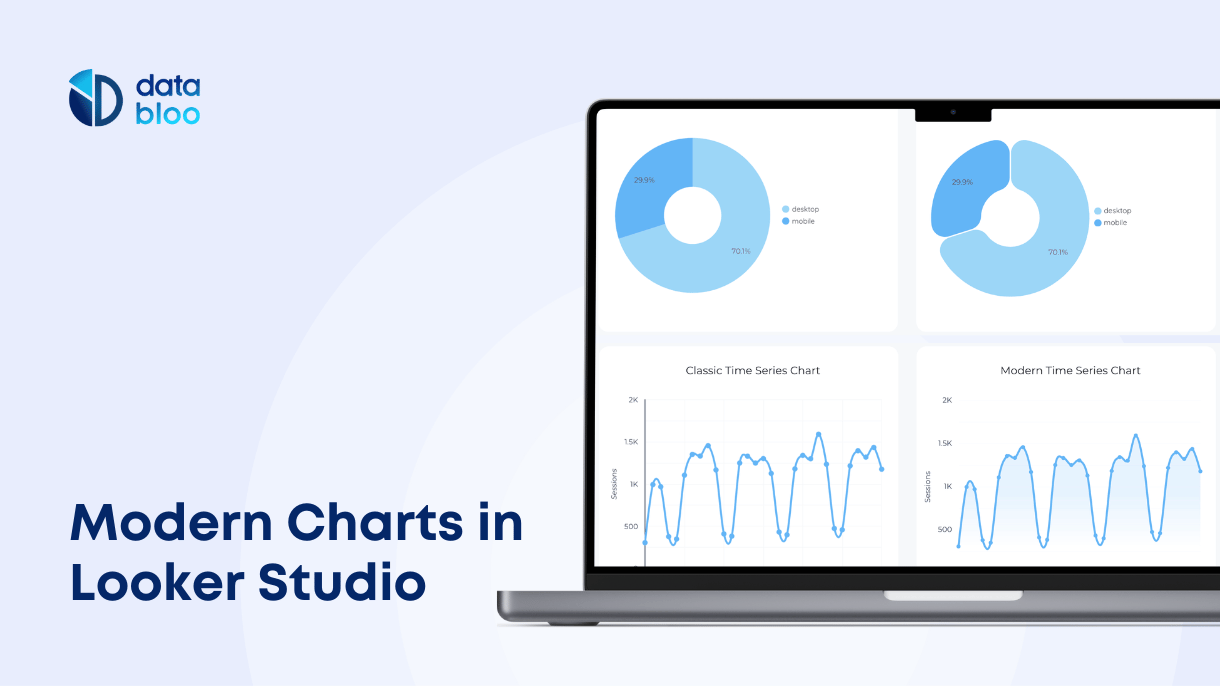
Discover Looker Studio's new Modern Charts with enhanced styling, rounded edges, gradients, and better customization for clearer data visualization.| Data Bloo
Discover Looker Studio's new Modern Charts with enhanced styling, rounded edges, gradients, and better customization for clearer data visualization.| Data Bloo
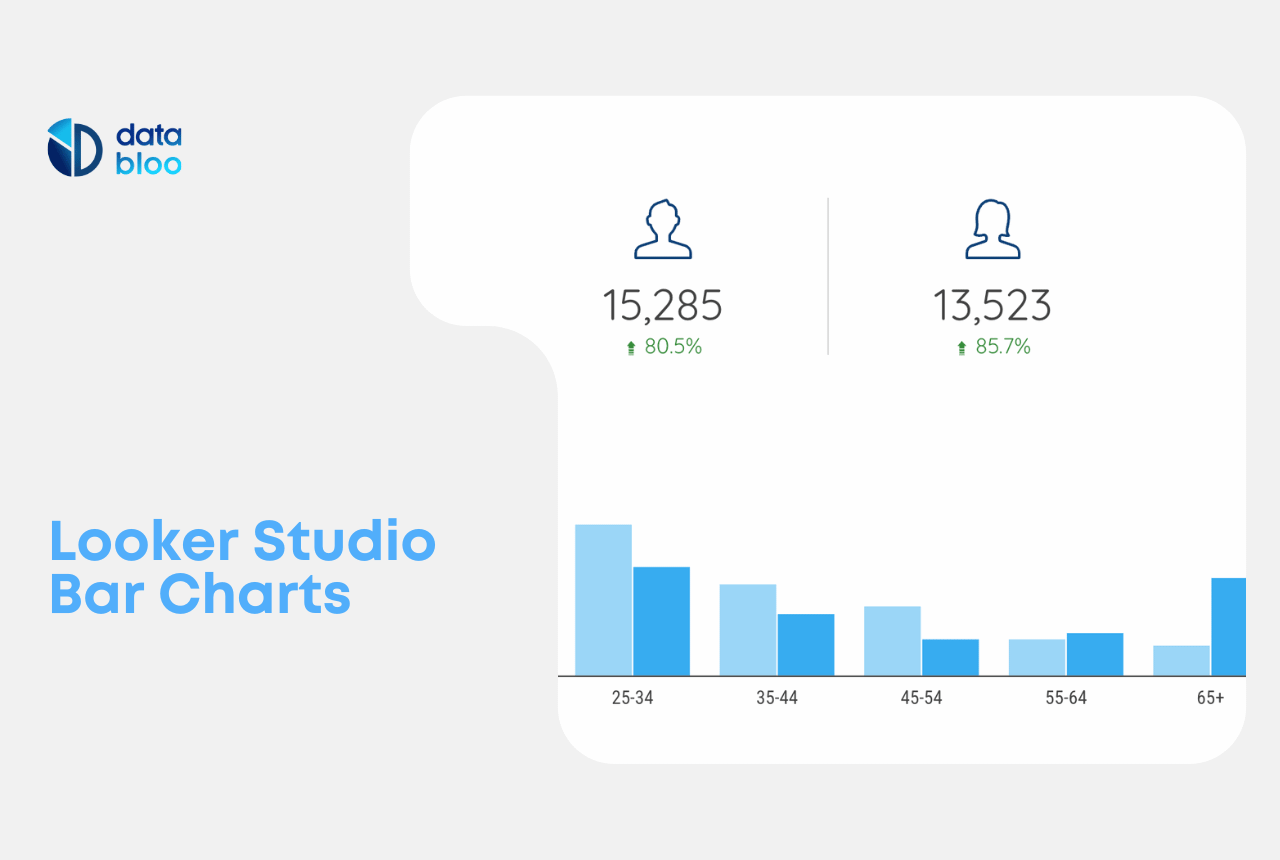
Learn how to create Google Looker Studio bar charts and stacked bar charts. Enhance your reports with our templates for better data visualization and insights.| Data Bloo
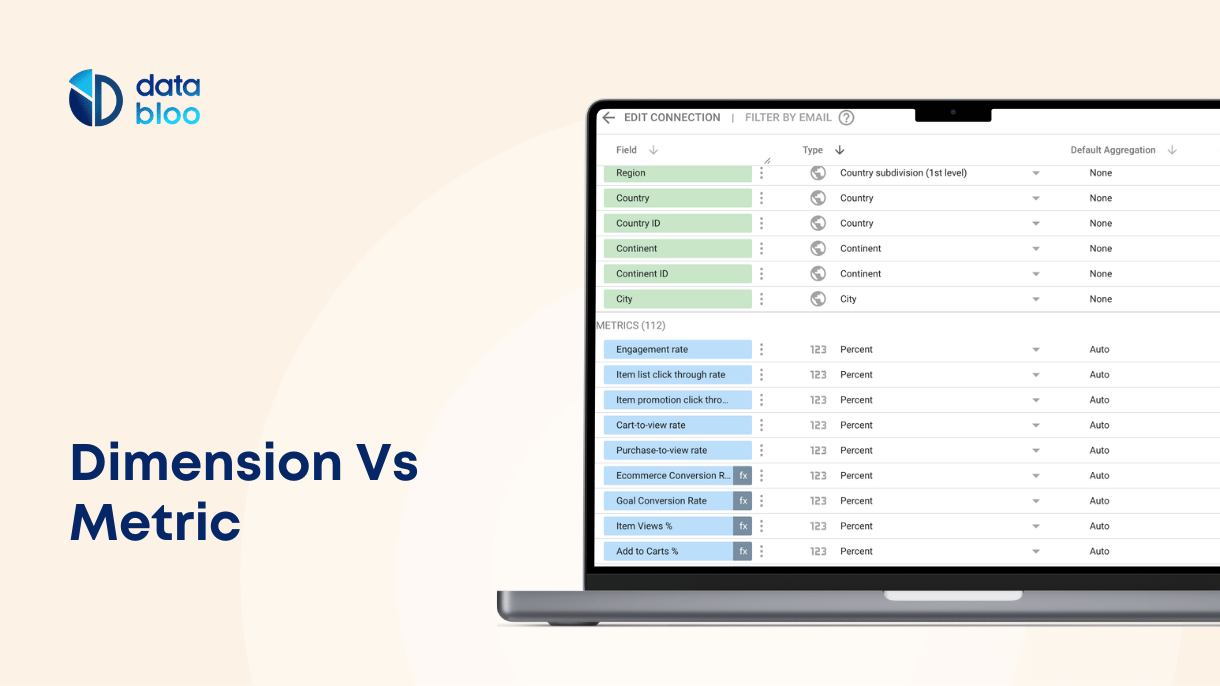
Understand the differences between Google Looker Studio dimension vs metric, and learn how to use them effectively for data analysis and visualization.| Data Bloo
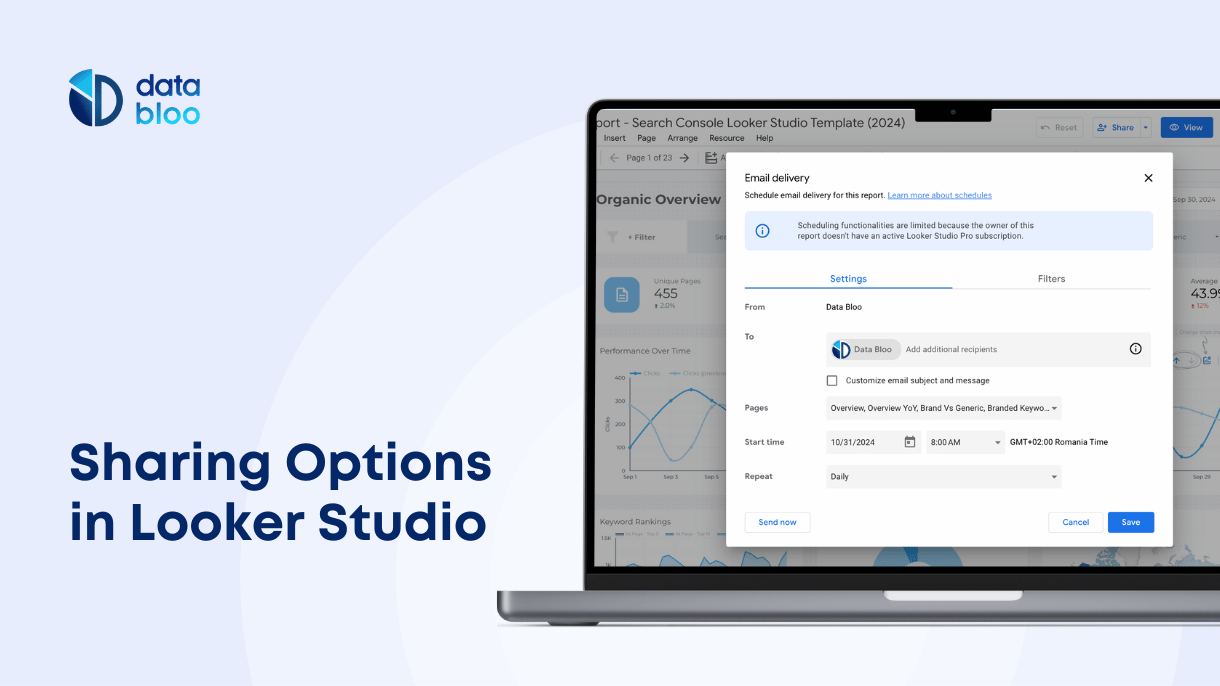
There are 3 different ways to share Google Looker Studio reports: download a report as PDF file, export the data from a chart and schedule email delivery.| Data Bloo
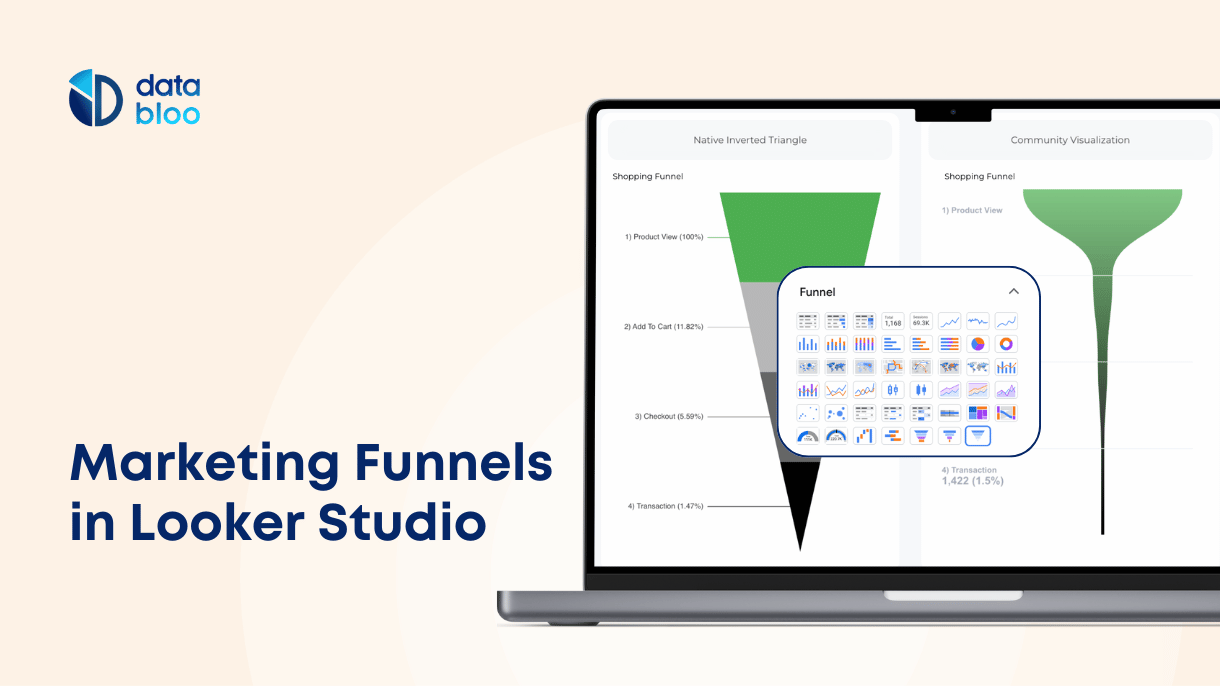
Learn how to create marketing funnels in Looker Studio using native charts and community visualizations. Discover types of funnels, metrics, data sources, and tips.| Data Bloo
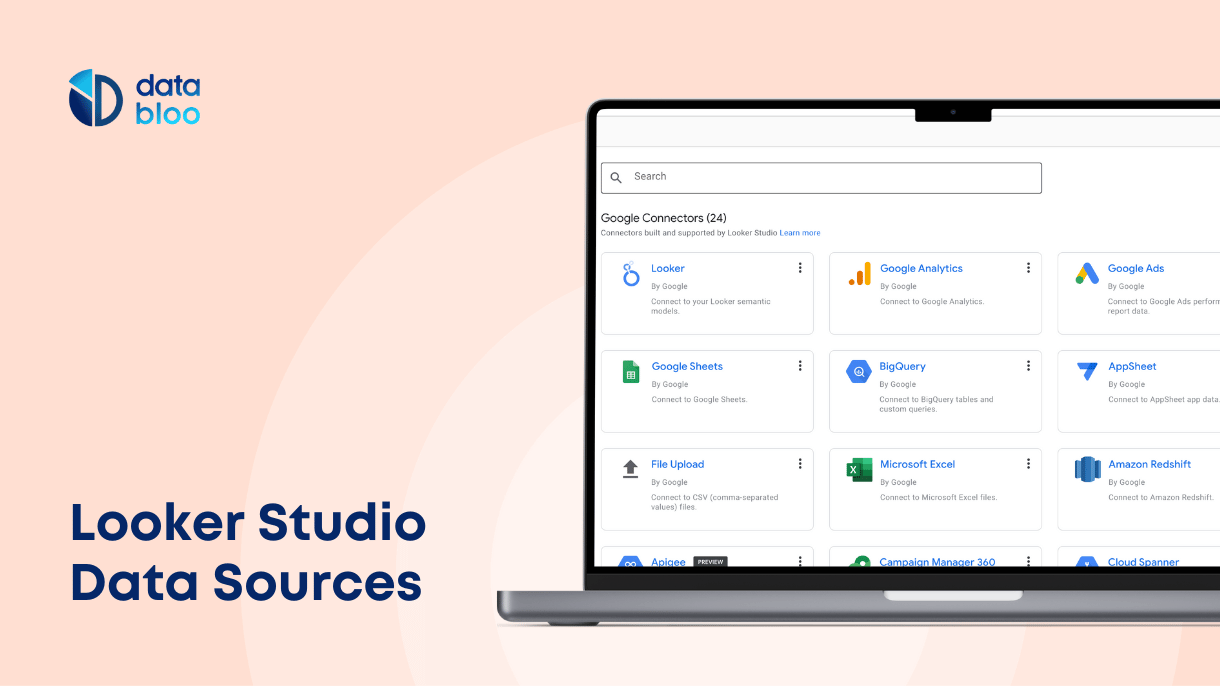
What are the available Looker Studio data sources? You can connect multiple data sources in Google Looker Studio from social media platforms to software tools.| Data Bloo
