Today’s blog is about the min(1) paradigm for KPI charting in Tableau desktop and how to make advanced KPI charts without needing slow table calculations to do the computations for you. Instead, we will show you how to utilize Tableau features to generate a better KPI solution. Welcome to learning how to create a min(1) […]| Dev3lop
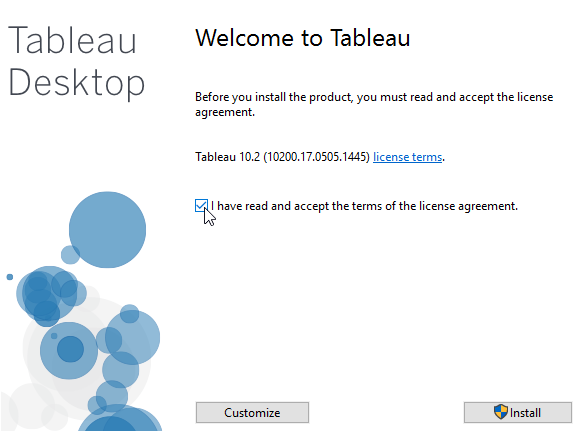
Let’s learn how to Install Tableau Desktop and kick-start your data analyst career. If you’re breaking into the data industry, learning that data visualization is important in data science, or unlocking the power of data for the first time… Welcome, or maybe you’re deep into the realm of understanding the nuanced differences between Tableau VS […]| Dev3lop
Advanced analytics consulting services in Austin, Texas. Whether you’re a small business, government agency, enterprise, e-commerce platform or senior engineer looking for an analytics consultant. Dev3lop offers tailored advanced analytics consulting services to support any analytics environment.| Dev3lop
The ability to network with data science professionals is a valuable skill that can open doors to exciting opportunities and foster your personal and professional growth. It would be best if you created long-lasting connections while networking. Long-lasting relationships that will get you ahead in life, and similar to attending school, these are people who […]| Dev3lop
Organizations are inundated with vast amounts of information that serve as the lifeblood of their operations. Whether it’s customer data, financial records, or market insights, harnessing and trusting your data is paramount. Data governance can be used to ensure that data remains accurate, reliable, and secure. In this comprehensive data governance guide, we’ll delve into […]| DEV3LOPCOM, LLC
We believe the best reporting environment makes room for everyone’s combined experiences, whether it’s Tableau VS Power BI or another data visualization product. That’s why you see many organizations with a sprawl of products, and that’s a good thing because the more people accessing the data with these products, the better your data will become! […]| Dev3lop