As a Professional market analyst, I build effective trading strategies using techniques such as indicator divergences, multi-time frame analysis, indicator combinations, and rigorous backtesting.| Liberated Stock Trader
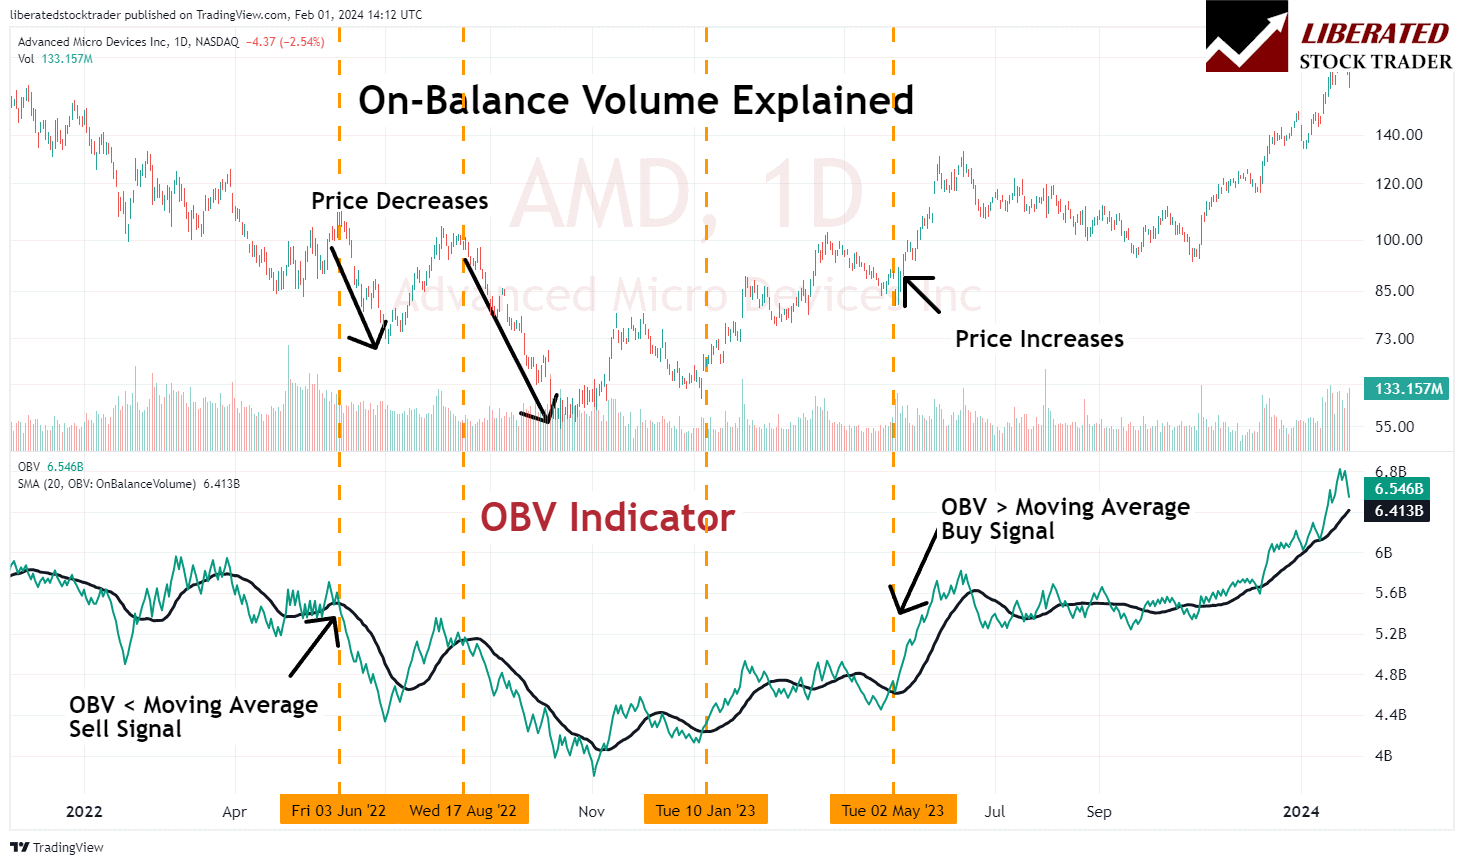
On-balance volume (OBV) is a cumulative indicator in technical analysis designed to show the volume flow relative to a security's price movements. The OBV reflects the collective buying and selling pressure crystallized through the volume trend.| Liberated Stock Trader
The mean reversion trading strategy suggests prices and returns eventually move back toward the mean or average. Reliable indicators like Stochastics, RSI, and Bollinger bands are based on mean reversion to identify overbought and oversold conditions.| Liberated Stock Trader
Traders utilize pivot point indicators to predict when stock prices will reverse direction. But does it work? I tested 66,480 trades on 210 years of data, and the results are surprising.| Liberated Stock Trader
I tested 23,487 RSI trades on 820 years of exchange data. When configured correctly, RSI can be highly profitable, with a 53% success rate and an average of 65% winning trades. The RSI setting of 14 on a 1-hour chart is the most reliable configuration for identifying profitable buy and sell signals.| Liberated Stock Trader
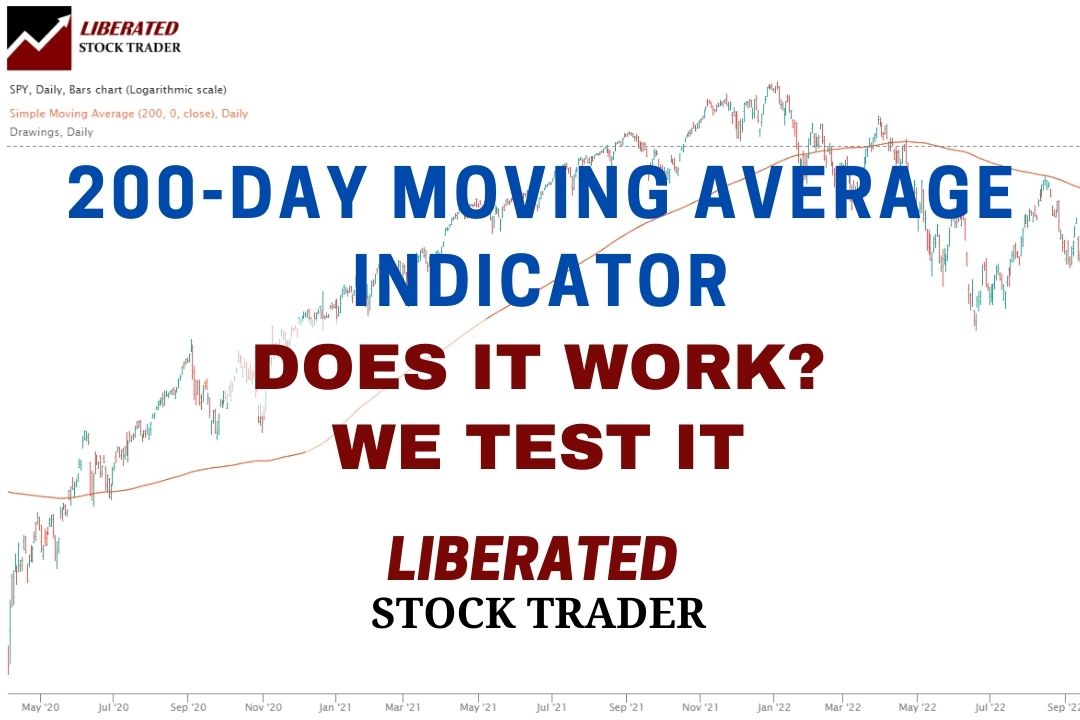
Our testing of the 200-day MA on the S&P500 over 16 years revealed that using this indicator is a losing proposition. A buy-and-hold strategy made a profit of 192% vs. the 200-day MA, which made only 152%.| Liberated Stock Trader