A one-point move in a stock price equals a one-dollar change. When someone says a stock is down two points, its price has declined by two dollars. Points in a stock index are similar to points in a stock, but instead of referring to the actual stock price, they refer to an index's performance.| Liberated Stock Trader
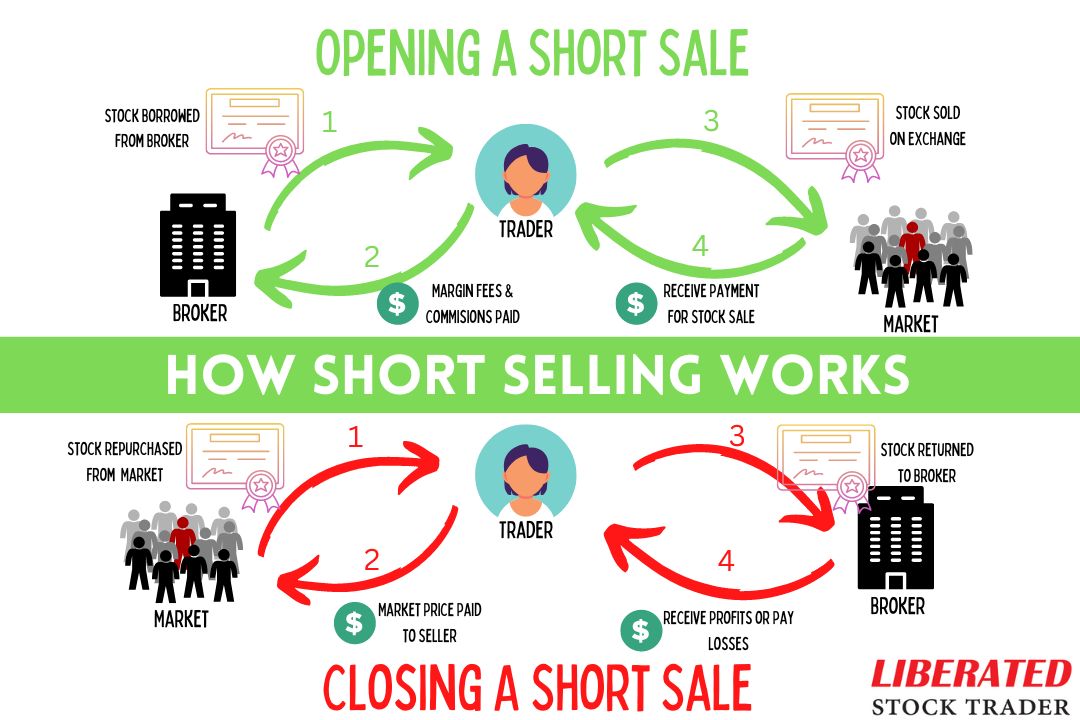
Short-selling is the most difficult trading skill to master. The stock market's default direction is up, so betting against a company in a bull market is extremely risky and likely to result in losses.| Liberated Stock Trader
Professional analysts define all stock market trends using timeframe and direction: Timeframes are short-term, medium-term, and long-term. Direction is described using uptrend, downtrend, or consolidation.| Liberated Stock Trader
Research shows that the most reliable chart patterns are the Head and Shoulders, with an 89% success rate, the Double Bottom (88%), and the Triple Bottom and Descending Triangle (87%). The Rectangle Top is the most profitable, with an average win of 51%, followed by the Rectangle Bottom with 48%.| Liberated Stock Trader
The best technical analysis books leading industry bodies recommend are Technical Analysis of the Financial Markets, Technical Analysis Explained, Cloud Charts, and Forecasting Financial Markets.| Liberated Stock Trader
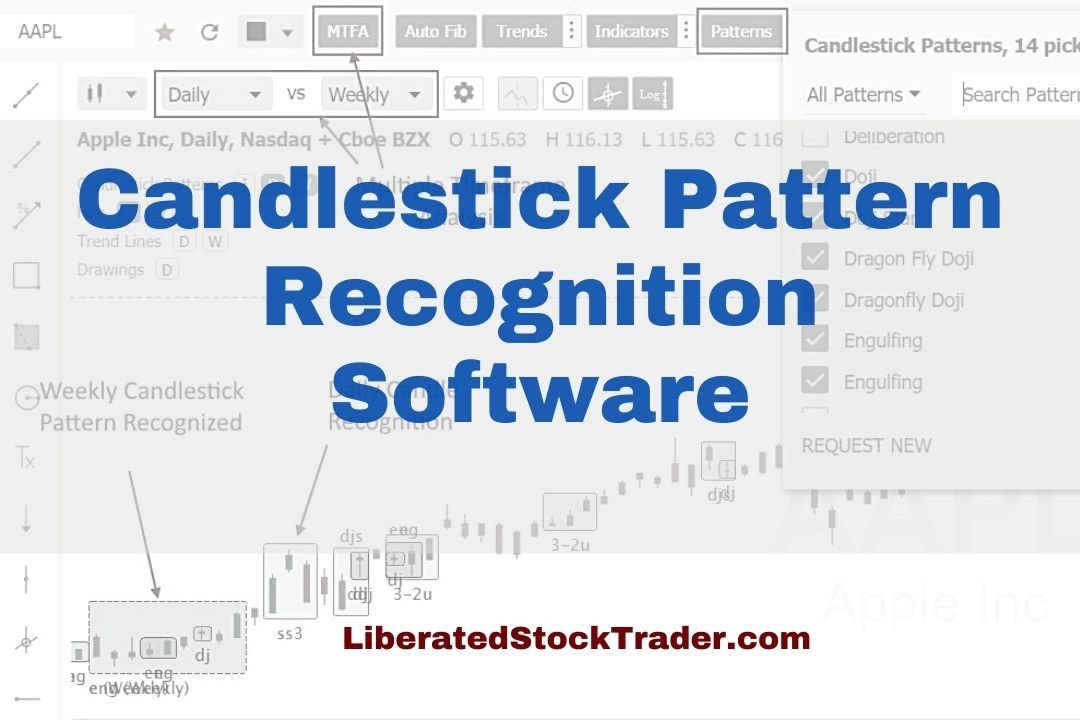
Testing reveals the best stock chart candlestick pattern recognition software is TrendSpider, TradingView, MetaStock, and Finviz.| Liberated Stock Trader
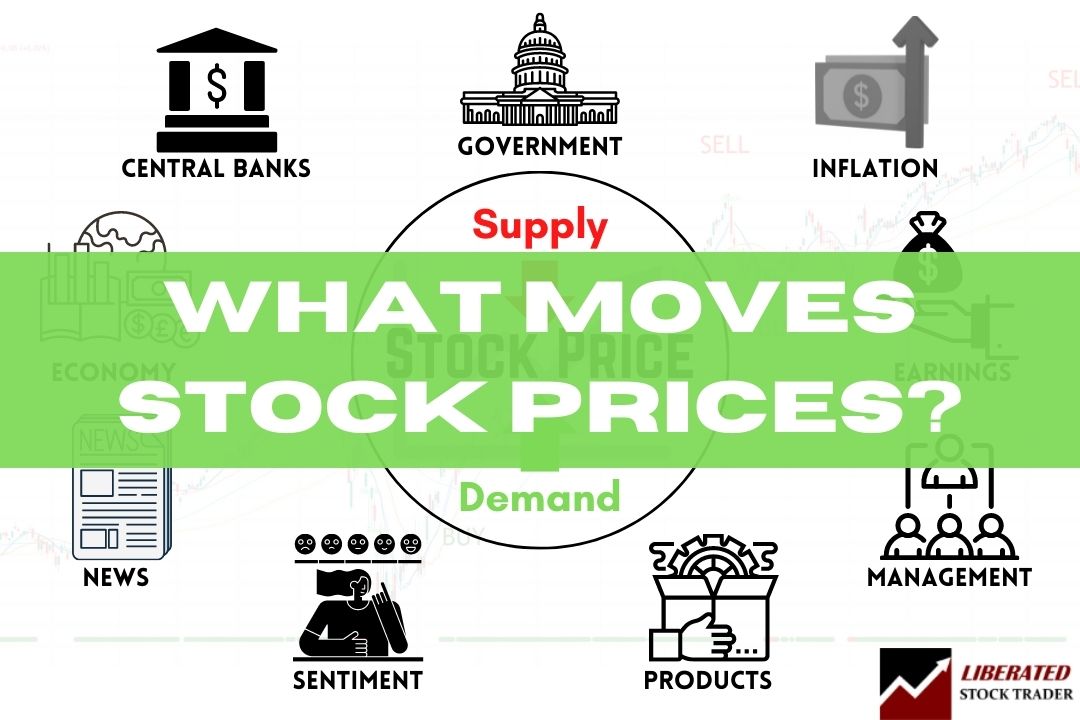
The prices of stocks are determined by the interactions of buyers and sellers in a free market. Stock prices constantly change as new information becomes available and investor expectations about the future change. Factors affecting stock prices are earnings reports, economic news, and government and central bank policy.| Liberated Stock Trader