Stock volume measures the number of shares traded and indicates market strength. Rising markets with increasing volume are viewed as bullish, and falling prices on higher volume are bearish.| Liberated Stock Trader
Learn stock market investing with the complete online stock trading course by Barry D. Moore, a certified financial analyst from the International Federation of Technical Analysts (IFTA).| Liberated Stock Trader
My research shows the most reliable and accurate bullish patterns are the cup-and-handle, with a 95% bullish success rate, head-and-shoulders (89%), double-bottom (88%), and triple-bottom (87%).| Liberated Stock Trader
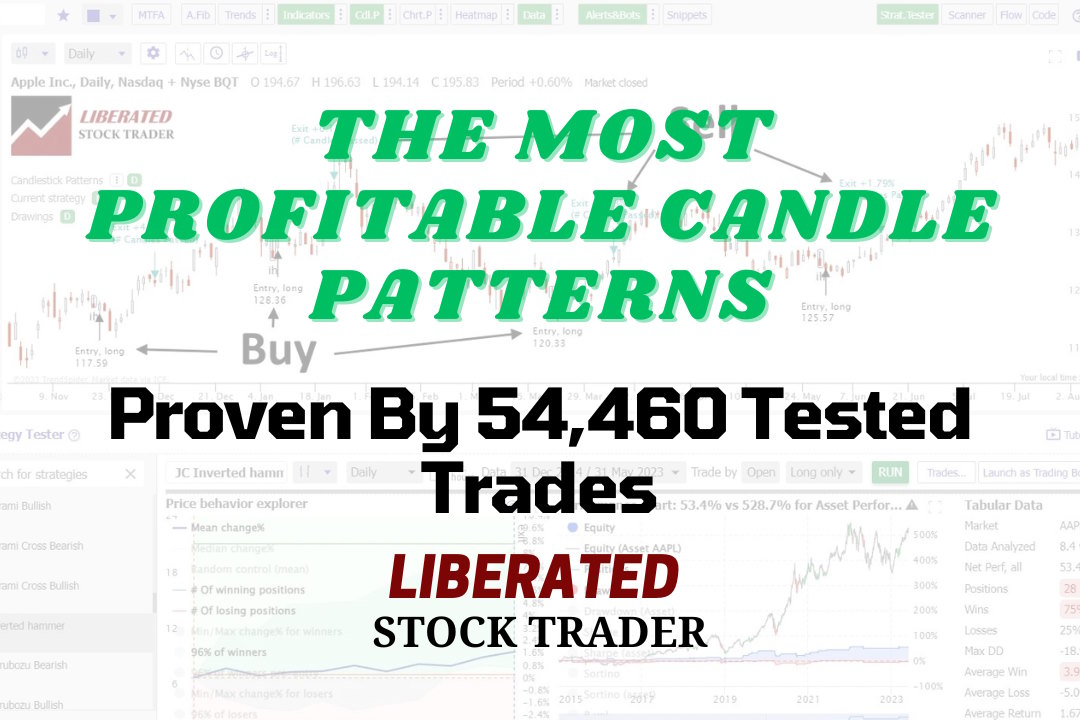
My rigorous testing shows the most reliable candle patterns are the Inverted Hammer (60% success rate), Bearish Marubozu (56.1%), Gravestone Doji (57%), and Bearish Engulfing (57%). The inverted hammer is the most profitable candle pattern, with a 1.12% profit per trade.| Liberated Stock Trader
I tested 23,487 RSI trades on 820 years of exchange data. When configured correctly, RSI can be highly profitable, with a 53% success rate and an average of 65% winning trades. The RSI setting of 14 on a 1-hour chart is the most reliable configuration for identifying profitable buy and sell signals.| Liberated Stock Trader
In my 40-day, 5-minute day trading test, pairing ROC with a Heikin Ashi chart outperformed the market 93% of the time, compared to 43% with classic candles, while increasing the win rate (55% vs. 45%) and reward-to-risk ratio (2.7 vs. 1.84).| Liberated Stock Trader
Research shows that the most reliable chart patterns are the Head and Shoulders, with an 89% success rate, the Double Bottom (88%), and the Triple Bottom and Descending Triangle (87%). The Rectangle Top is the most profitable, with an average win of 51%, followed by the Rectangle Bottom with 48%.| Liberated Stock Trader
The best moving average settings are SMA or EMA 20 on a daily chart, which achieves a 23% win rate. At settings 50, 100, and 200, it is better to use the Hull moving average, which has win rates of 27%, 10%, and 17%, respectively.| Liberated Stock Trader
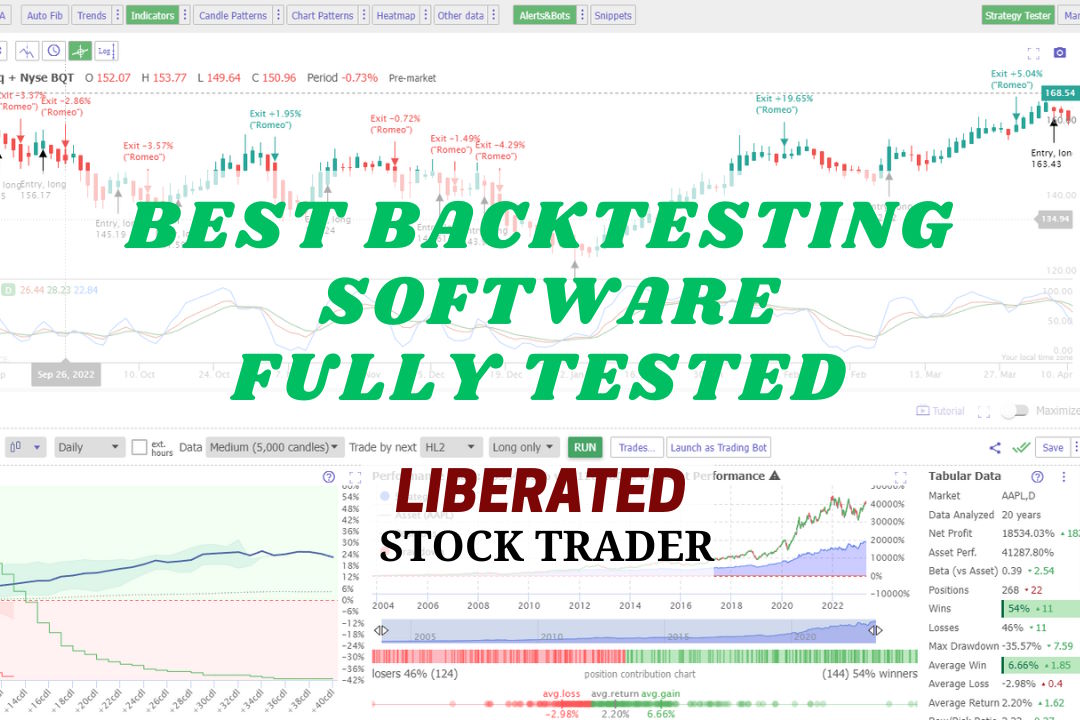
My research shows the best stock backtesting and auto-trade software are TrendSpider, Trade Ideas, and Tradingview. My testing process selected TrendSpider as the overall winner because it offers the most flexible, code-free, multilayer backtesting.| Liberated Stock Trader
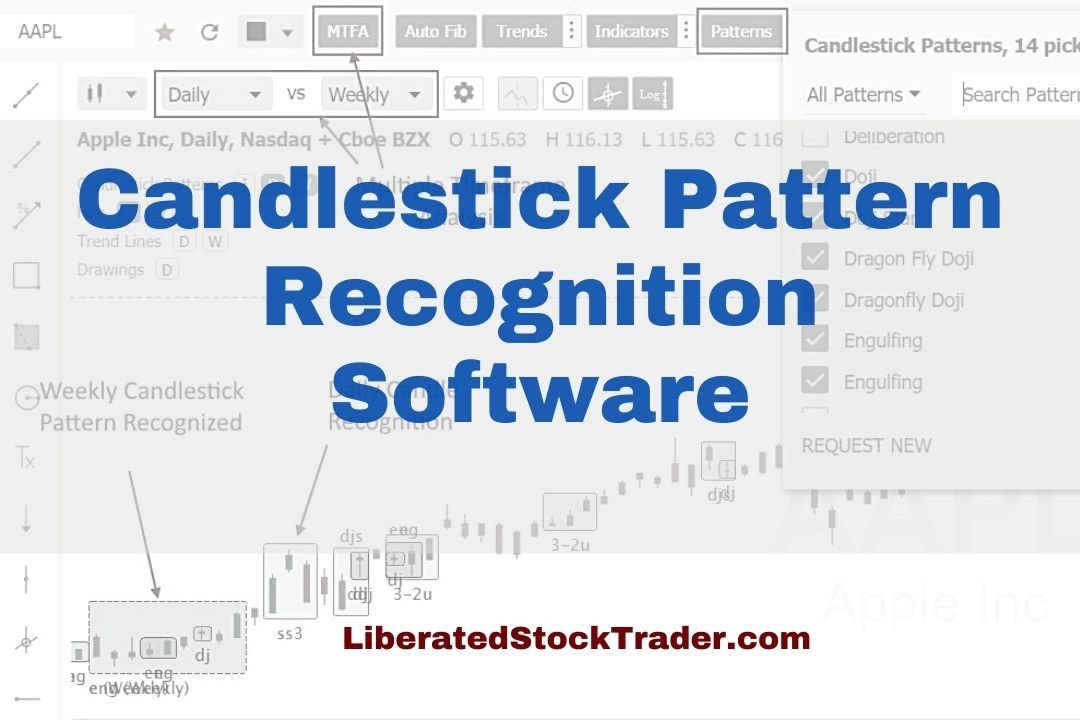
Testing reveals the best stock chart candlestick pattern recognition software is TrendSpider, TradingView, MetaStock, and Finviz.| Liberated Stock Trader