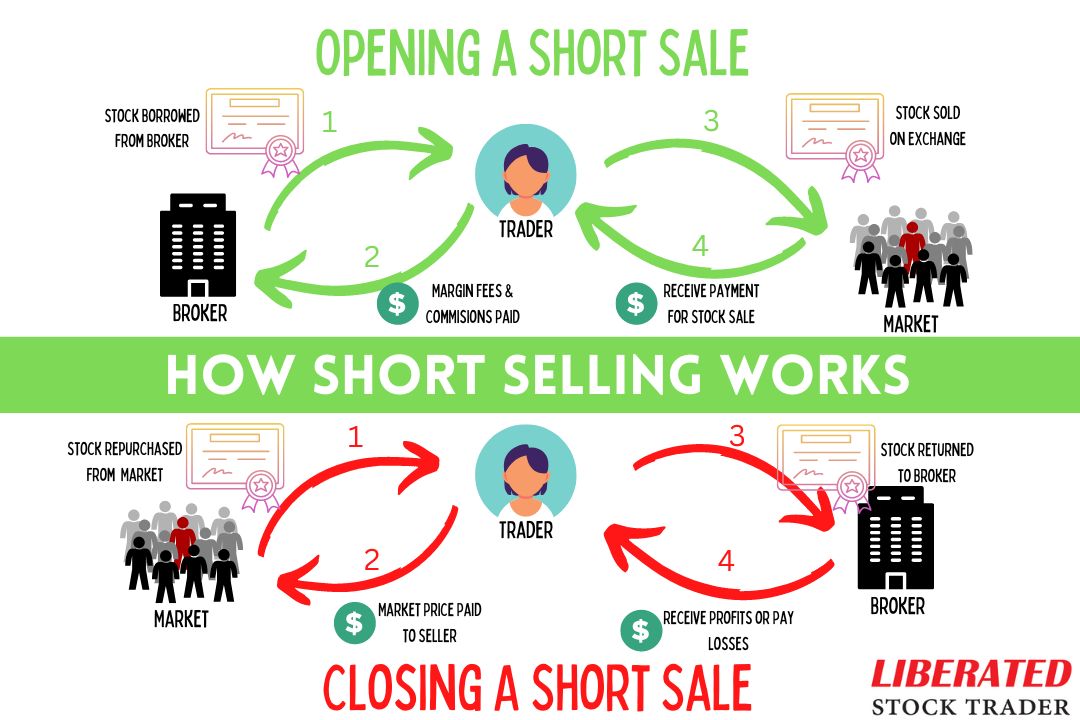
Short-selling is the most difficult trading skill to master. The stock market's default direction is up, so betting against a company in a bull market is extremely risky and likely to result in losses.| Liberated Stock Trader
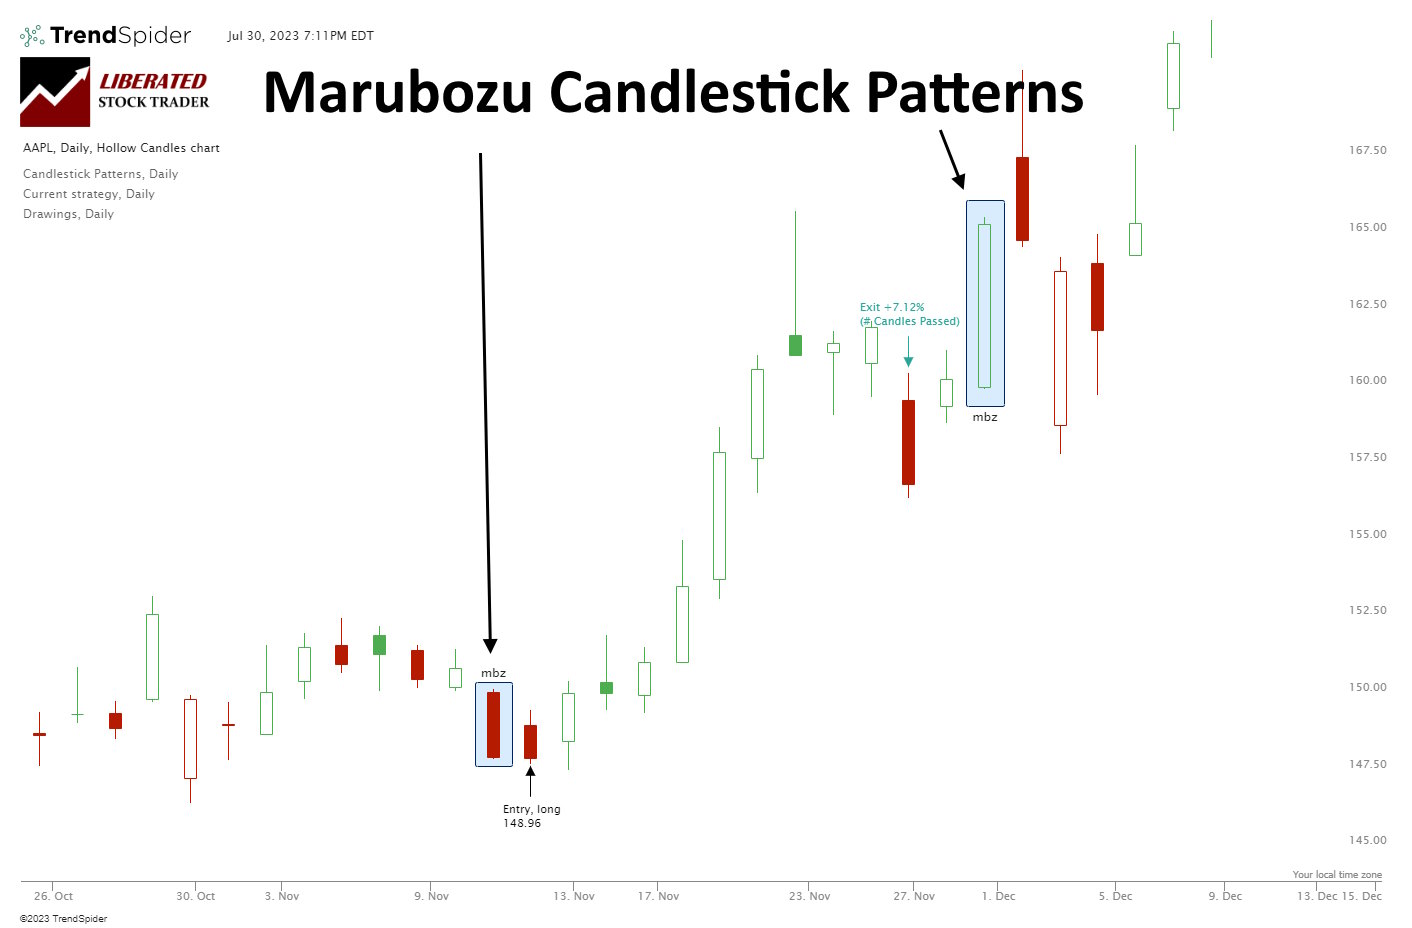
Our research shows Bearish Marubozu candles are among the most profitable patterns. Based on 568 years of data, it has a 56.1% success rate and an average win of 4.1%. Conversely, the Bullish Marubozu is one of the worst.| Liberated Stock Trader
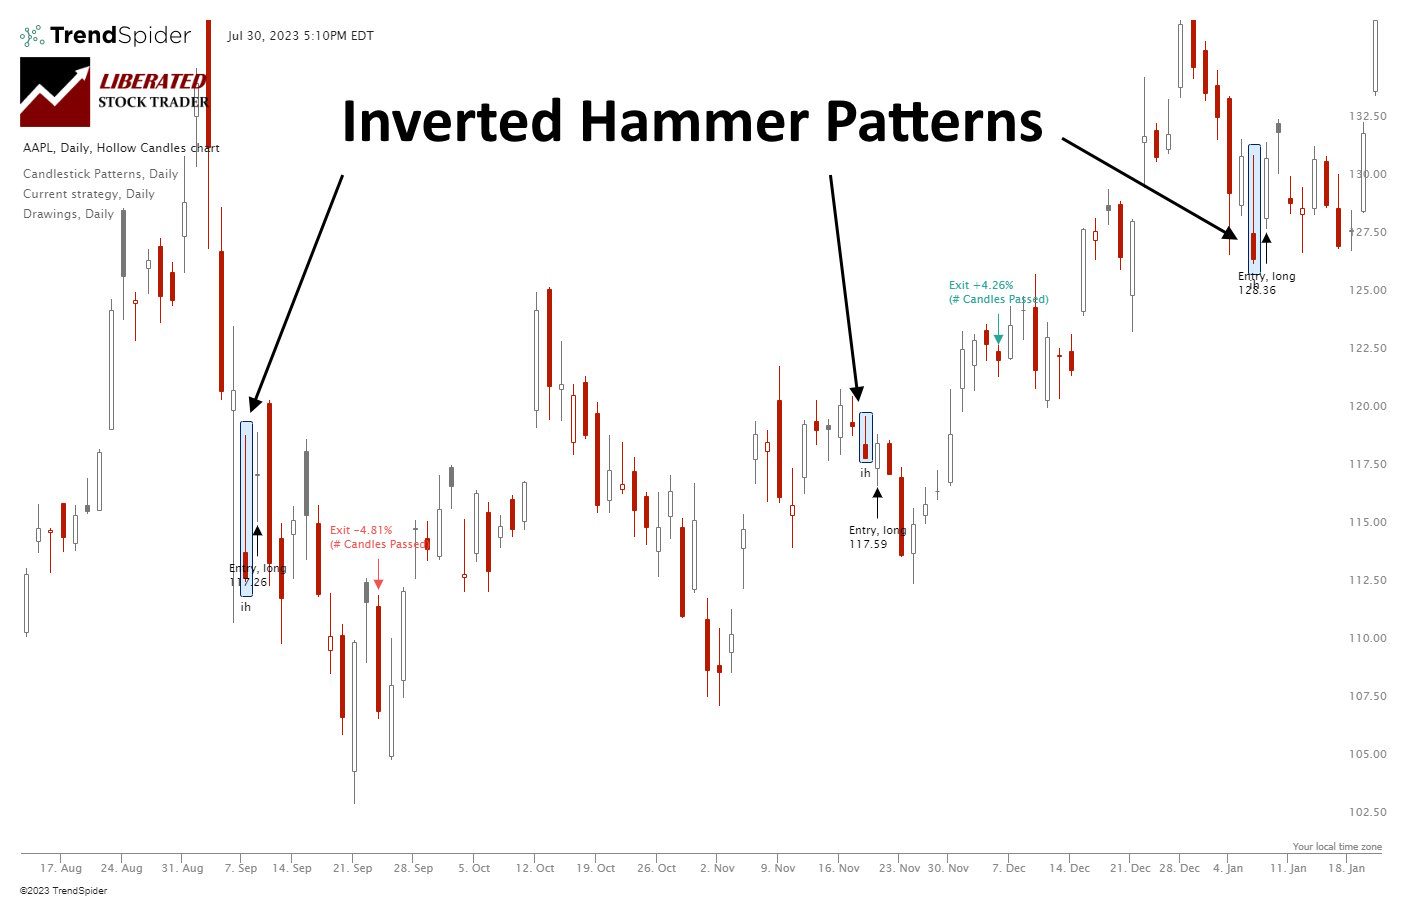
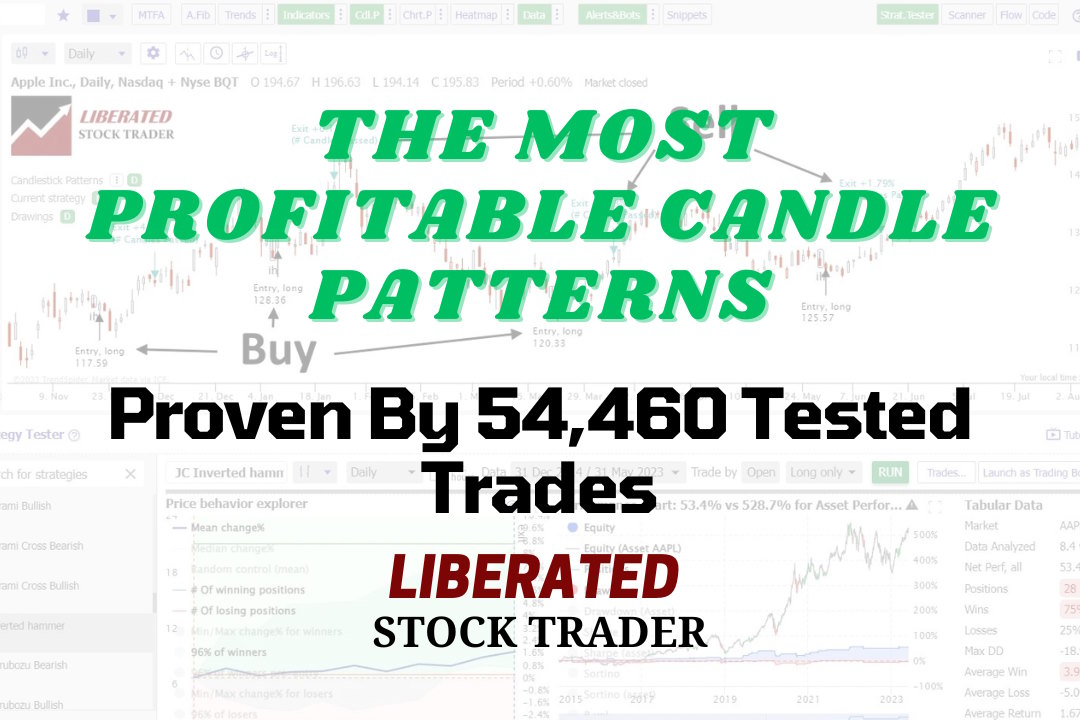
Our research shows the Inverted Hammer is the most accurate and profitable candlestick pattern. Used as a bullish signal, it has a 60% success rate and an average win of 4.2%, based on 588 years of data.| Liberated Stock Trader
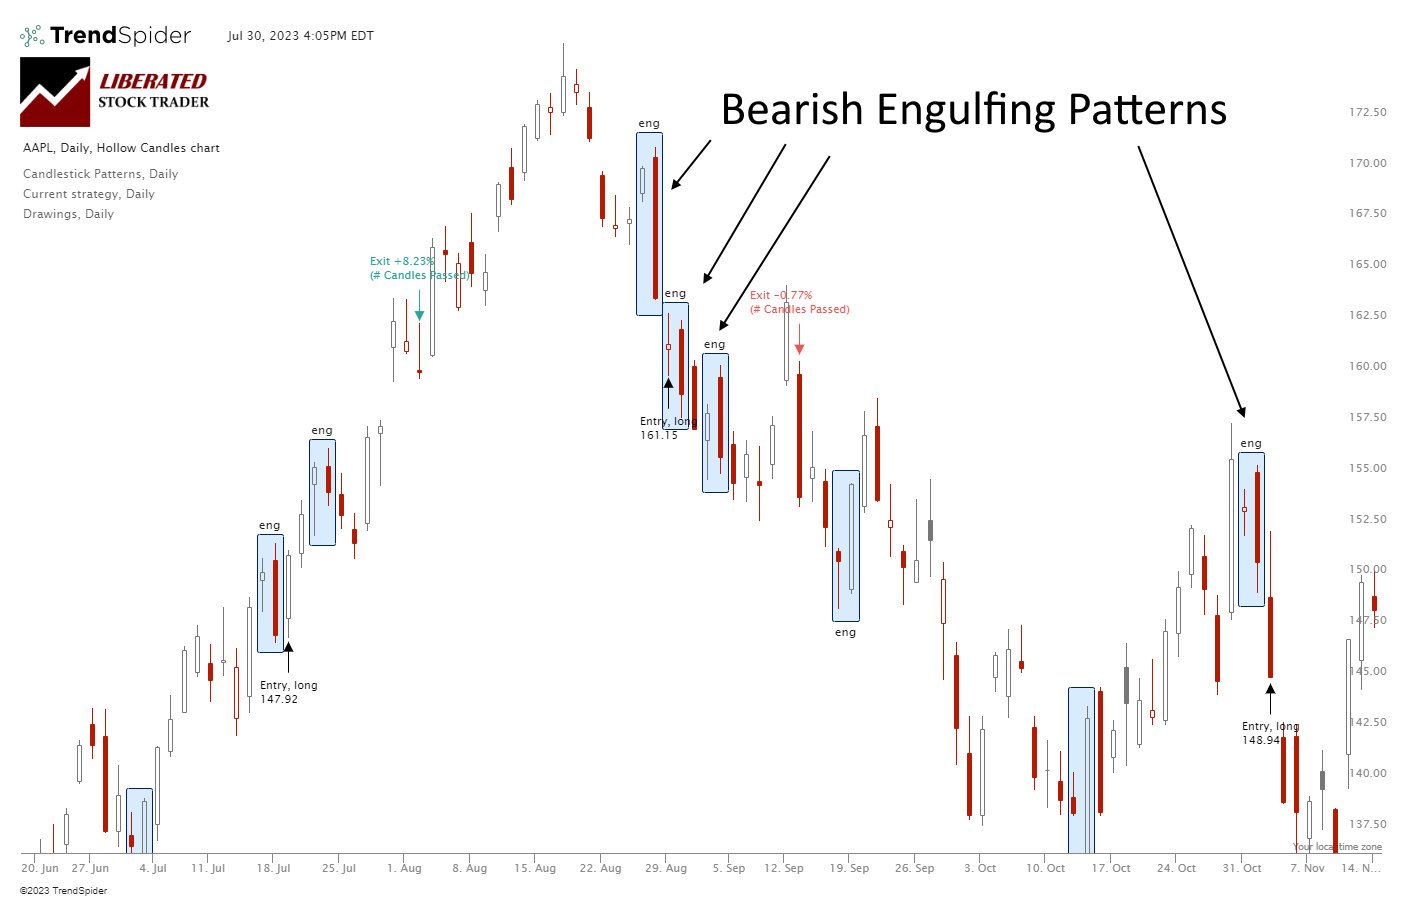
My research shows the Bearish Engulfing candle is an accurate and profitable pattern. Using 568 years of data, my testing revealed a 57% success rate and an average win of 3.7%.| Liberated Stock Trader
My research shows the most reliable and accurate bullish patterns are the cup-and-handle, with a 95% bullish success rate, head-and-shoulders (89%), double-bottom (88%), and triple-bottom (87%).| Liberated Stock Trader
My rigorous testing shows the most reliable candle patterns are the Inverted Hammer (60% success rate), Bearish Marubozu (56.1%), Gravestone Doji (57%), and Bearish Engulfing (57%). The inverted hammer is the most profitable candle pattern, with a 1.12% profit per trade.| Liberated Stock Trader
I tested 23,487 RSI trades on 820 years of exchange data. When configured correctly, RSI can be highly profitable, with a 53% success rate and an average of 65% winning trades. The RSI setting of 14 on a 1-hour chart is the most reliable configuration for identifying profitable buy and sell signals.| Liberated Stock Trader
In my 40-day, 5-minute day trading test, pairing ROC with a Heikin Ashi chart outperformed the market 93% of the time, compared to 43% with classic candles, while increasing the win rate (55% vs. 45%) and reward-to-risk ratio (2.7 vs. 1.84).| Liberated Stock Trader
Research shows that the most reliable chart patterns are the Head and Shoulders, with an 89% success rate, the Double Bottom (88%), and the Triple Bottom and Descending Triangle (87%). The Rectangle Top is the most profitable, with an average win of 51%, followed by the Rectangle Bottom with 48%.| Liberated Stock Trader
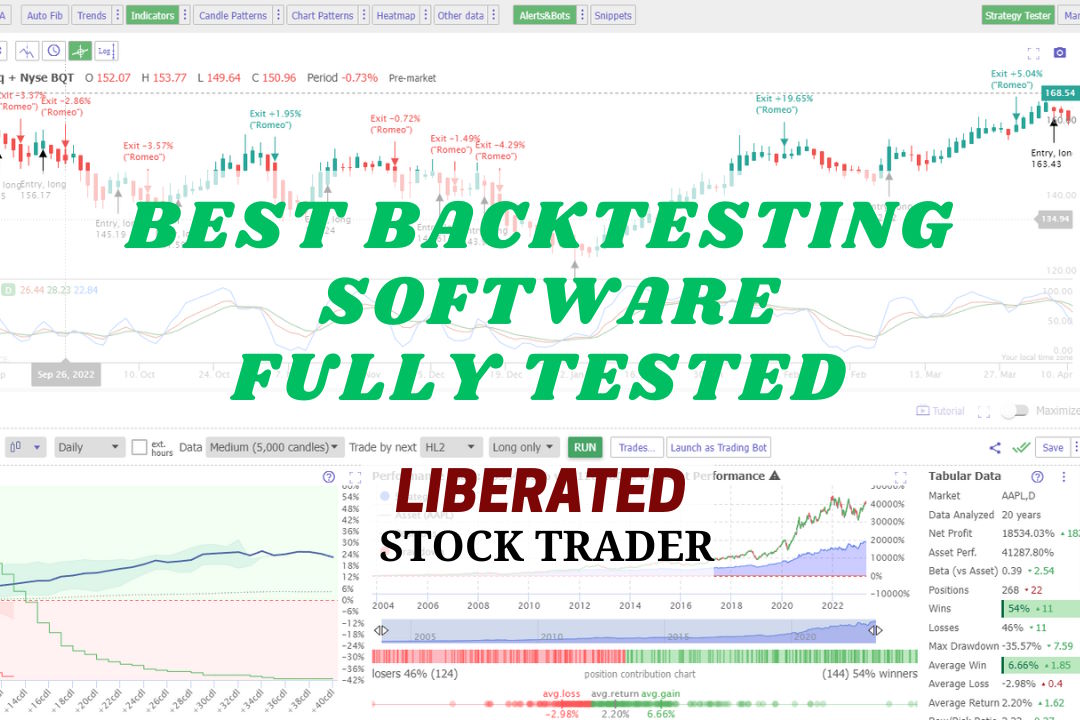
My research shows the best stock backtesting and auto-trade software are TrendSpider, Trade Ideas, and Tradingview. My testing process selected TrendSpider as the overall winner because it offers the most flexible, code-free, multilayer backtesting.| Liberated Stock Trader
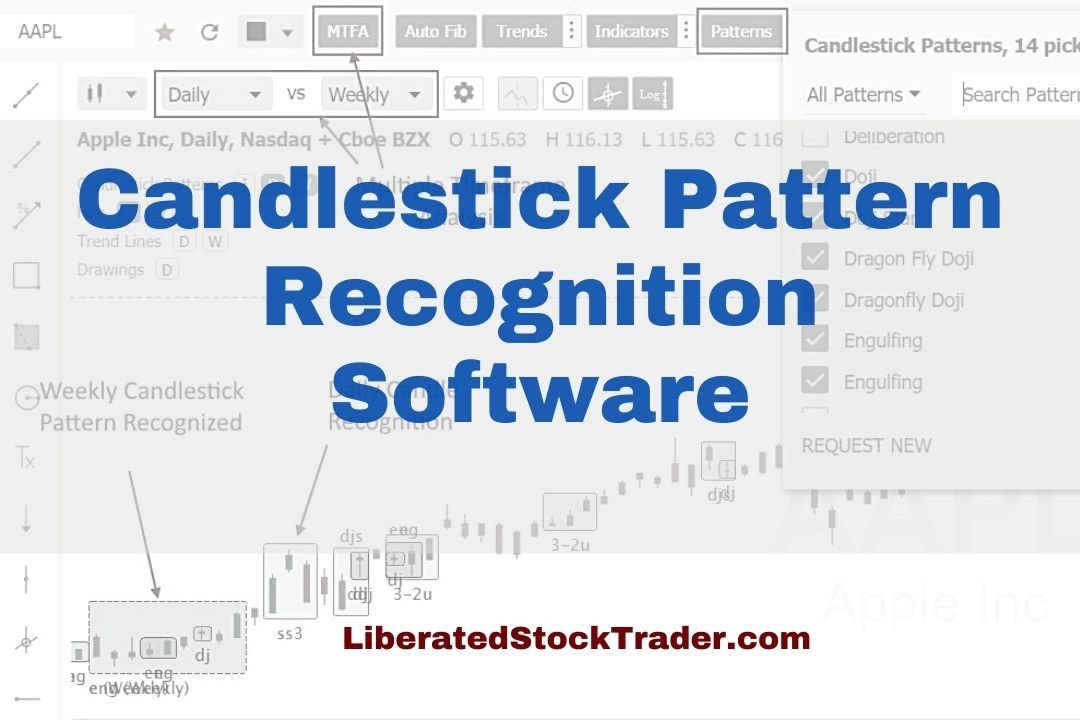
Testing reveals the best stock chart candlestick pattern recognition software is TrendSpider, TradingView, MetaStock, and Finviz.| Liberated Stock Trader
Our research on 10,400 years of exchange data shows the best day trading indicators are the Price Rate of Change, VWAP, Weighted Moving Average, Hull Moving Average, Simple Moving Average, and RSI.| Liberated Stock Trader