
Schools of Thought: The DVS Mentorship Program | Nightingale
Friendship can feel effortless as a child. Yet as we step into adulthood, human connection becomes more difficult| Nightingale
Friendship can feel effortless as a child. Yet as we step into adulthood, human connection becomes more difficult| Nightingale

Christopher Laubenthal focuses on better data use with visualizations in an organizational setting. He has experience in both for-profit and not-for-profit sectors where he increases literacy, grows culture, and builds data visualizations. Christopher is the Data Design Manager at The DeBruce Foundation, a national foundation whose mission is to expand pathways to economic growth and opportunity. Current projects include his public viz and The DeBruce Foundation’s Career Explorer Tools.| Nightingale

Feedback elevates work, but only when it is done right.| Nightingale

Nightingale content that contains advice, best practices, lessons learned, and other hands-on information about data visualization in practice.| Nightingale

How a person receives a product is as important as the product itself, with truck drivers being a great way in understanding this point.| Nightingale

“If you give a donkey two servings of food, equidistant apart and of equal quality, then the animal starves.| Nightingale

Nightingale articles that explore techniques and practical applications of various chart types from flowcharts to beeswarm charts and everything in between.| Nightingale

Nightingale content related to the design field. These articles cover topics like infographics, graphic design, information design, and design principles.| Nightingale
An archive of all stories from Nightingale, the journal of the Data Visualization Society. Discussion ranges from design to historic dataviz.| Nightingale

Our first public release of EdWise in summer of 2015 included this mapping functionality.| Nightingale
Social media sites are used by more than two-thirds of Internet users. How has social media grown over time?| Our World in Data
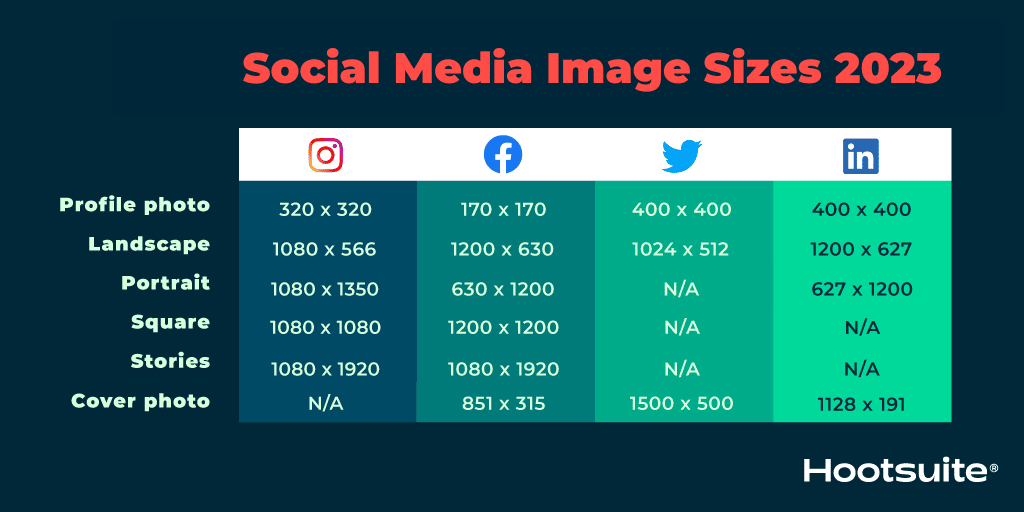
The most recent image sizes for different social media networks, including Instagram, X (f.k.a. Twitter), Facebook, LinkedIn, TikTok, and more.| Social Media Marketing & Management Dashboard
