A dead cat bounce is a short-term asset price recovery after a significant volatile decline, followed by a continuation of the downtrend. Look for a short-lived rally that loses momentum quickly, often trapping bullish traders.| Liberated Stock Trader
Ultimately, for 95% of speculators, day trading is not worth it. Although day traders can make significant money quickly, statistics show that most day traders lose money. Over a six-month period excessive commissions, poor trading decisions, weak strategies, and bad market timing cause losses.| Liberated Stock Trader
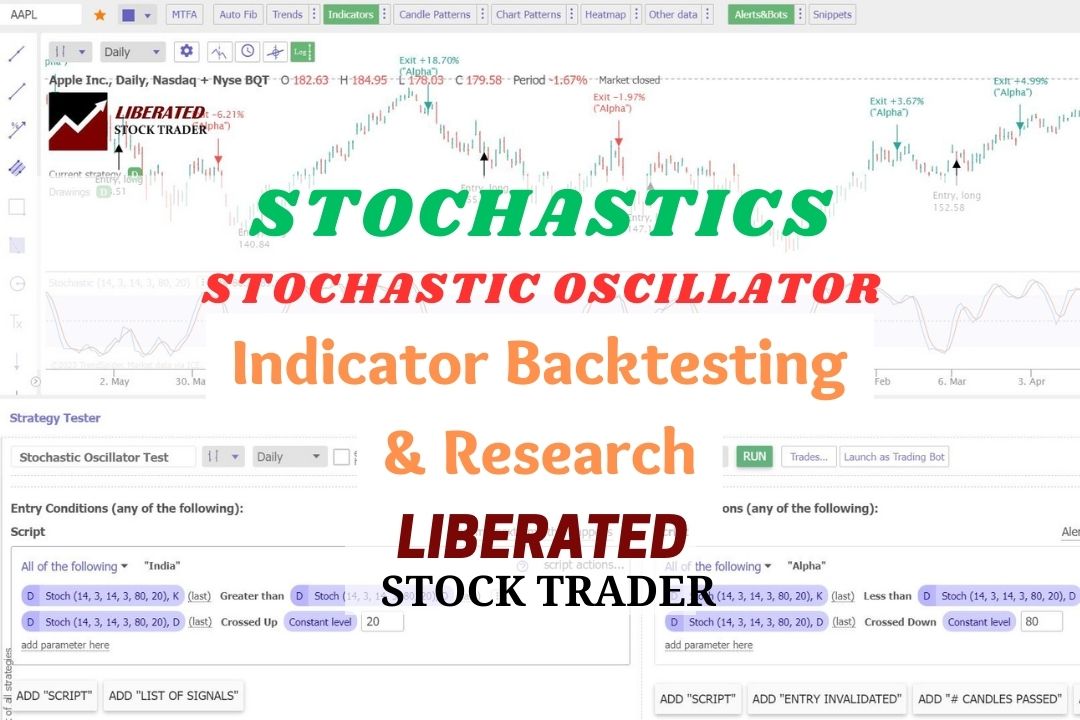
The Stochastic Oscillator momentum indicator compares an asset's closing price to a range of its previous prices. It oscillates between 0 and 100; below 20 indicates oversold, and above 80 suggests an overbought market.| Liberated Stock Trader
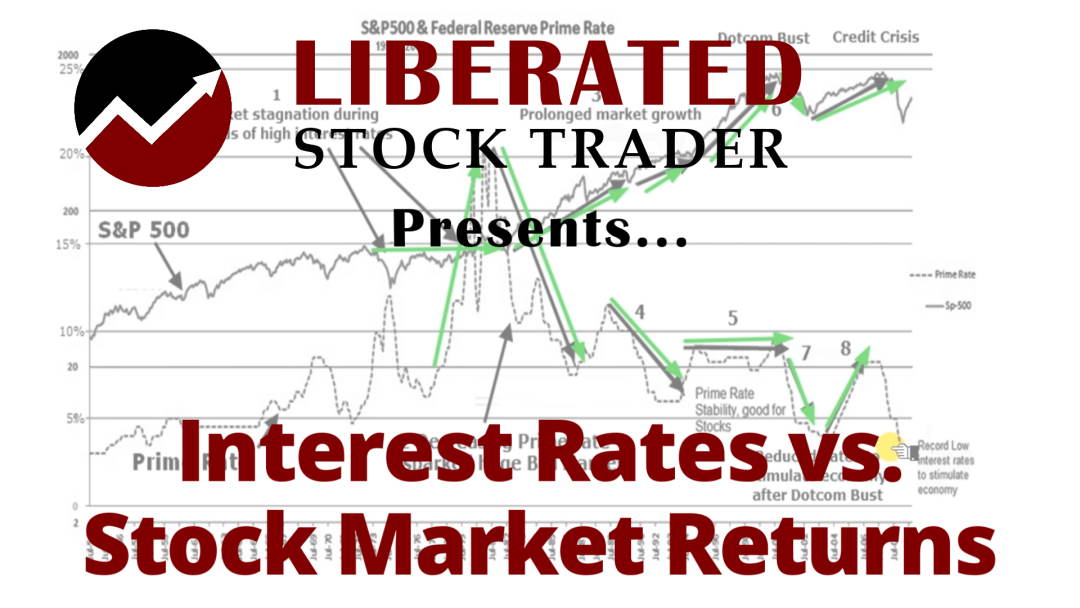
Interest rates significantly impact the stock market. Low rates mean cheap money for businesses and consumers, boosting demand for goods and services. This drives up companies' profits and stock prices. Conversely, rising rates make borrowing costlier, reducing spending and causing stock prices to fall.| Liberated Stock Trader
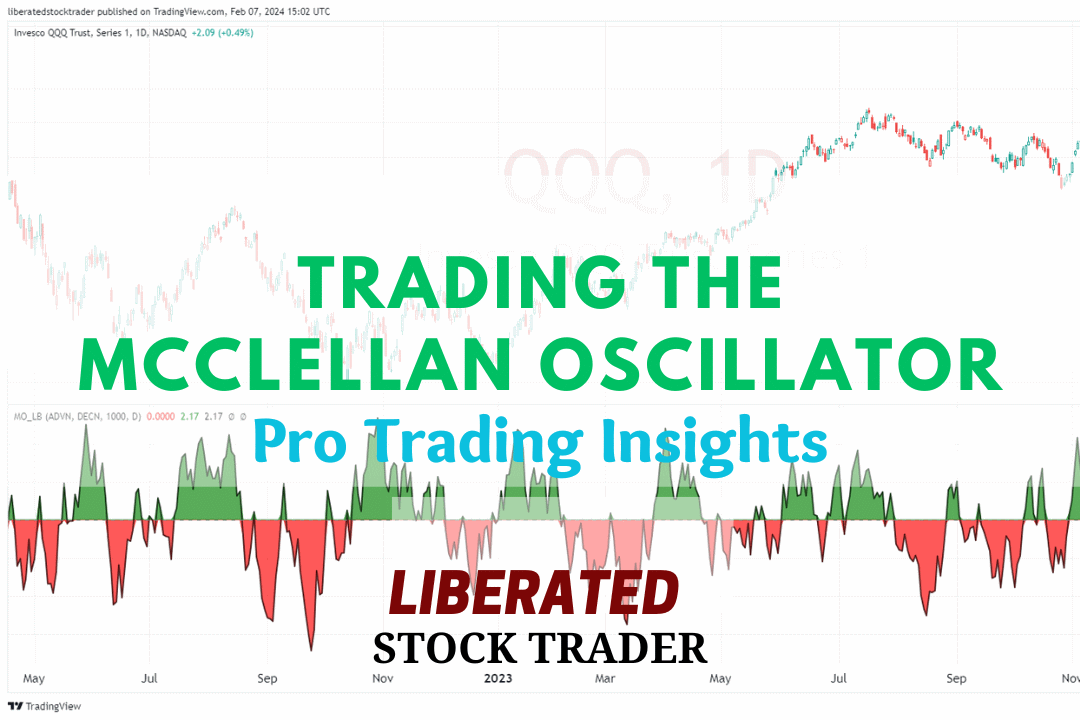
The McClellan Oscillator is a technical analysis tool designed to assess the market breadth of the New York Stock Exchange (NYSE). It is renowned for its effectiveness in revealing the underlying strength or weakness of the market by comparing the number of advancing to declining stocks.| Liberated Stock Trader
An exponential moving average (EMA) technical indicator reduces the lag associated with simple moving averages (SMA) by applying a multiplier to the most recent data. EMAs provide improved sensitivity, enhancing the accuracy of trend analysis.| Liberated Stock Trader
The Relative Strength Index (RSI) is an oscillating momentum indicator that measures the speed and change of stock price movements. RSI uses a scale from 0 to 100 to indicate overbought or oversold conditions.| Liberated Stock Trader
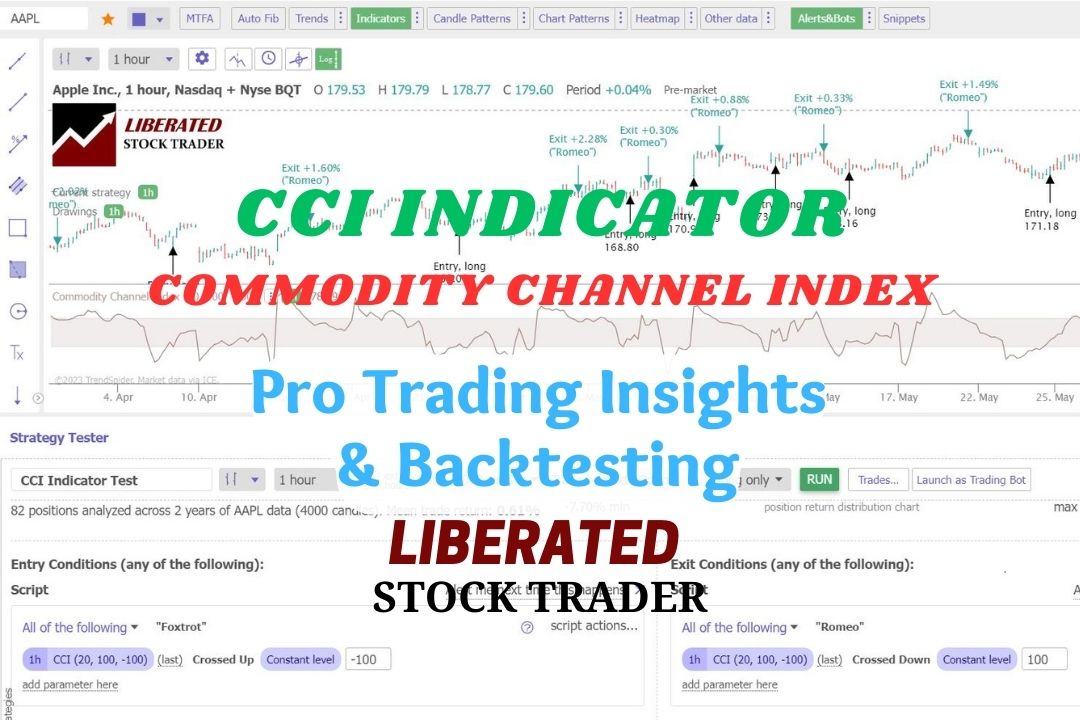
Our test data shows that using the CCI indicator with a 50 setting on the S&P 500 index stocks over 20 years was incredibly profitable, returning a 1,108% profit compared to the market, which returned 555%.| Liberated Stock Trader
The best moving average settings are SMA or EMA 20 on a daily chart, which achieves a 23% win rate. At settings 50, 100, and 200, it is better to use the Hull moving average, which has win rates of 27%, 10%, and 17%, respectively.| Liberated Stock Trader
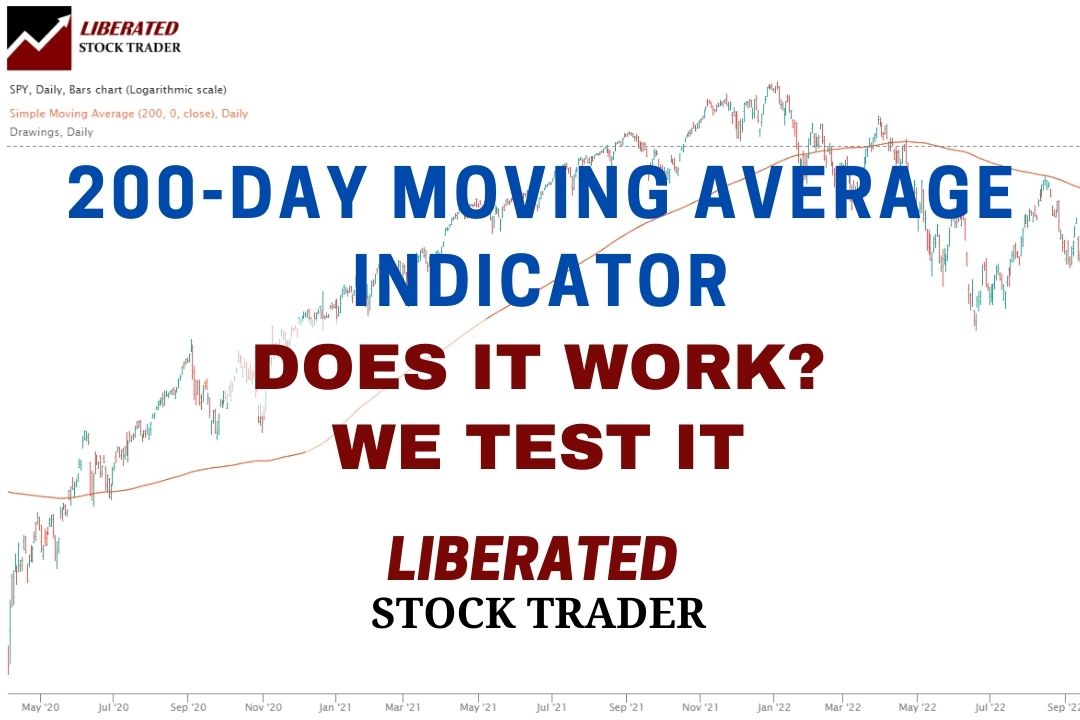
Our testing of the 200-day MA on the S&P500 over 16 years revealed that using this indicator is a losing proposition. A buy-and-hold strategy made a profit of 192% vs. the 200-day MA, which made only 152%.| Liberated Stock Trader
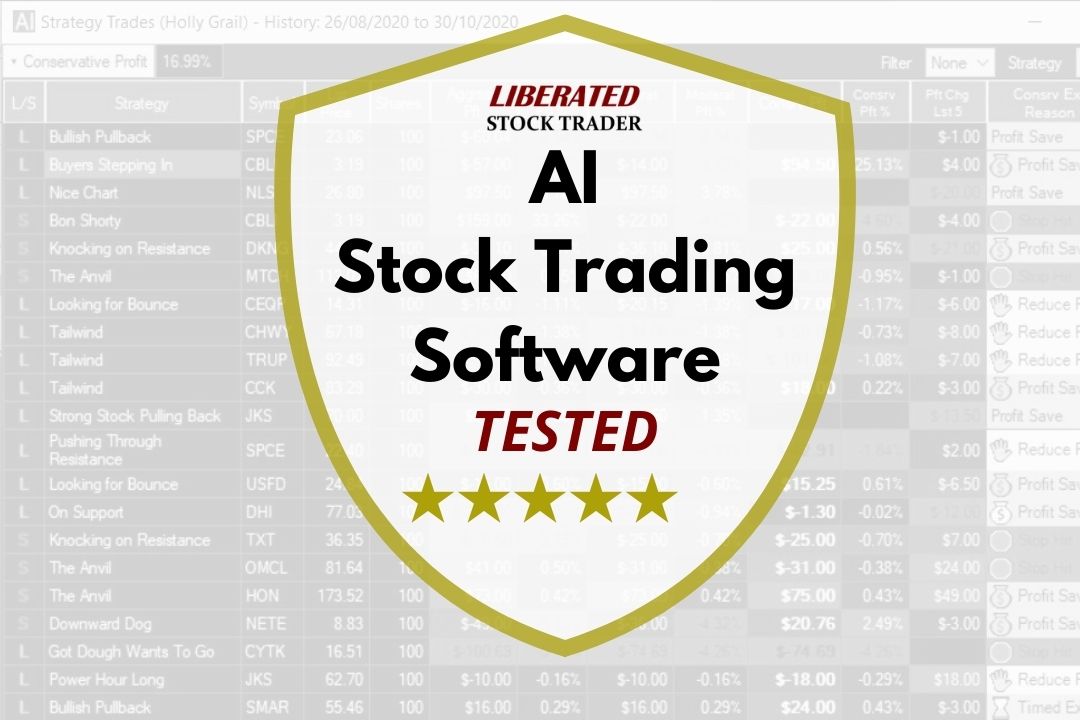
My research identifies Trade Ideas and TrendSpider as the leaders in AI trading software. Trade Ideas offers automated trading and bots, while TrendSpider offers automated pattern recognition, auto-trading, and backtesting.| Liberated Stock Trader
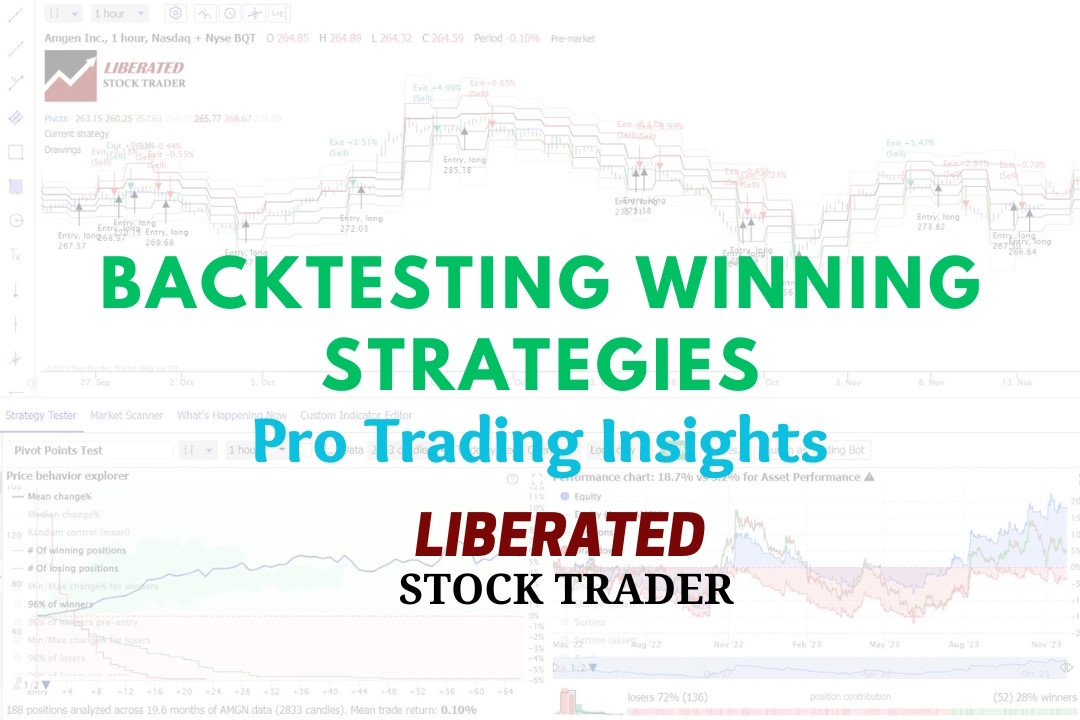
Experienced investors backtest their trading strategies to optimize their portfolios. Backtesting is a critical step that enables traders to assess the potential viability of a trading strategy by applying it to historical data.| Liberated Stock Trader
In technical analysis, momentum indicators help traders identify the strength and direction of a stock's price. We explain and test three popular momentum indicators for reliability.| Liberated Stock Trader