In technical analysis, Fibonacci retracement is used by traders to predict levels of support and resistance by drawing horizontal lines according to the Fibonacci sequence. But Does It Work?| Liberated Stock Trader
Liberated Stock Trader offers free stock investing courses covering value, growth, dividend investing, and technical chart analysis. Our courses are developed by IFTA member and certified financial technician Barry D. Moore.| Liberated Stock Trader
Our research shows that asset bubbles, easy access to cheap credit, weak regulation, and poor institutional risk management are the causes of crashes.| Liberated Stock Trader
Learn stock market investing with the complete online stock trading course by Barry D. Moore, a certified financial analyst from the International Federation of Technical Analysts (IFTA).| Liberated Stock Trader
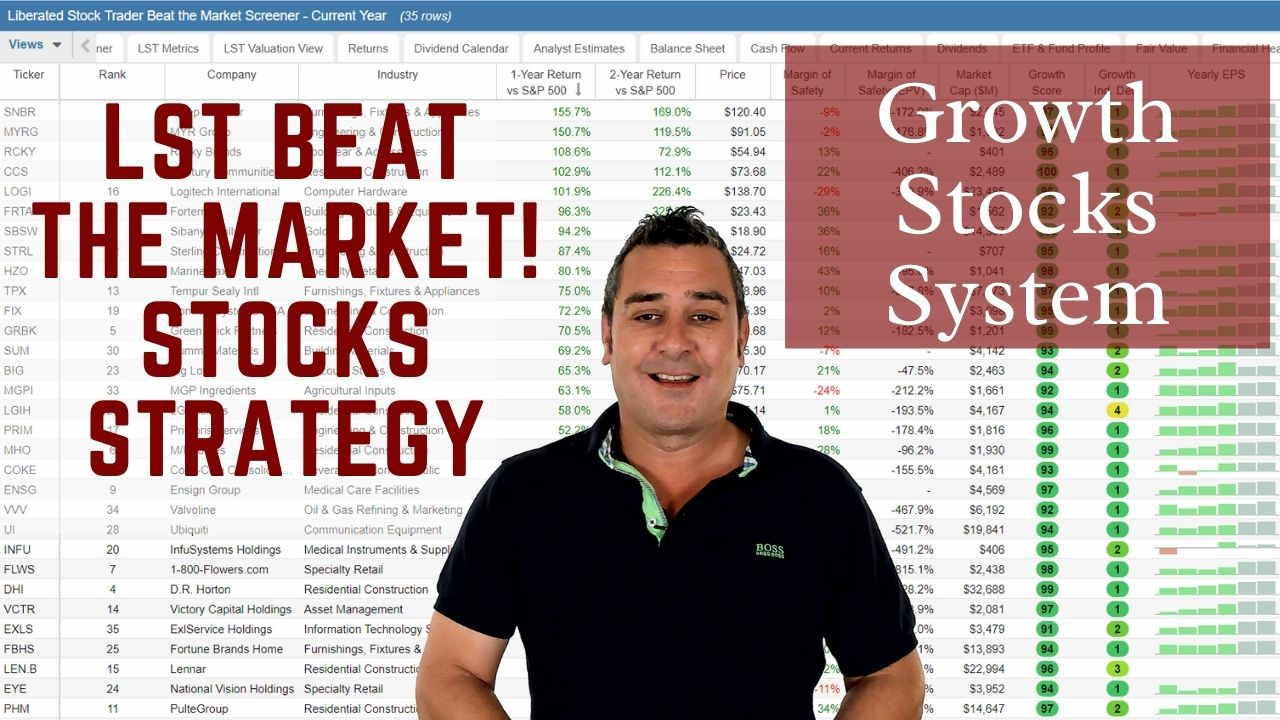
Decades of research and testing unveiled the Liberated Stock Trader Beat the Market System. Our 9-year, backtested, and proven strategy targets 35 financially| Liberated Stock Trader
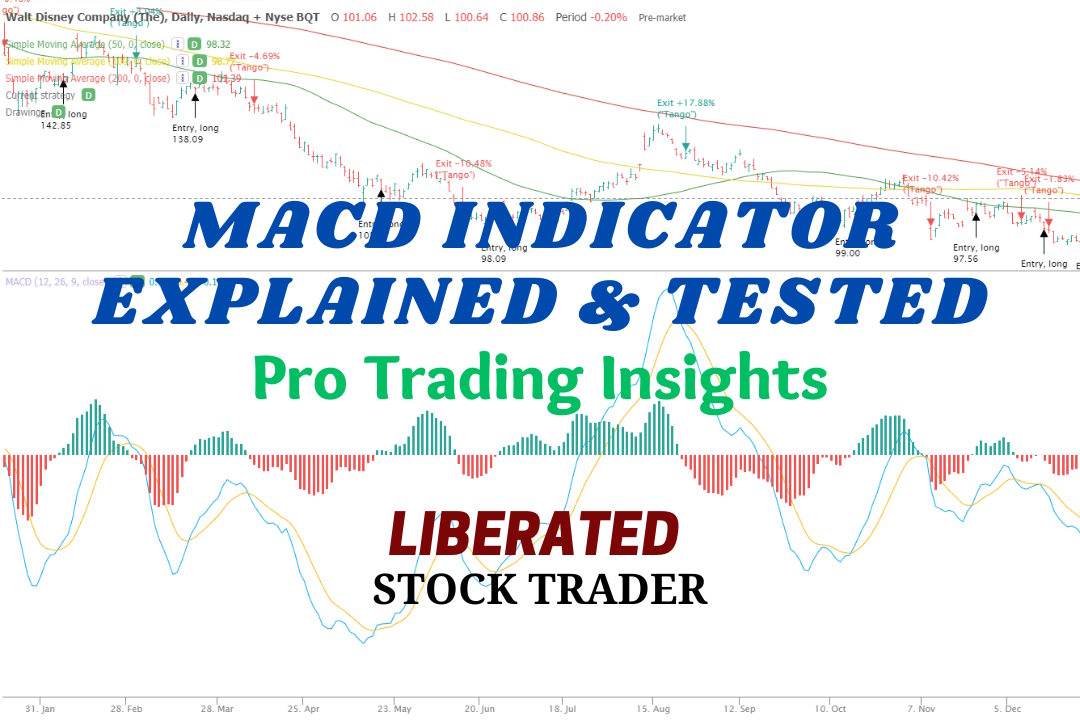
MACD is a trend-following momentum indicator used to identify price trends. We conducted 606,422 test trades to find the best settings and trading strategies.| Liberated Stock Trader
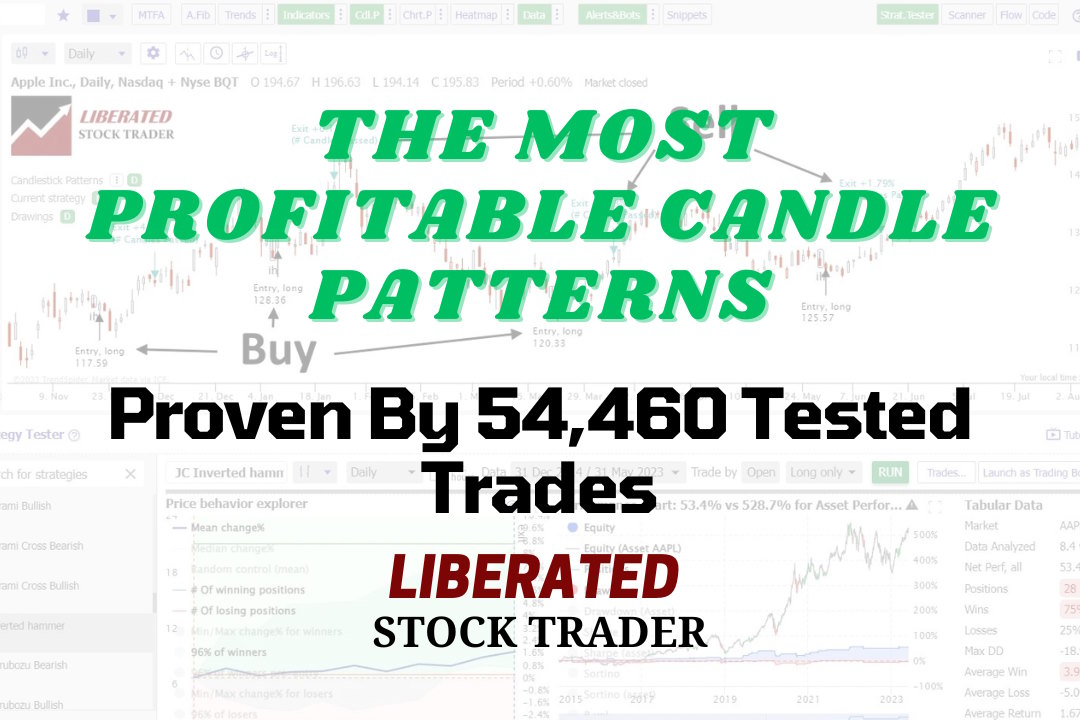
My rigorous testing shows the most reliable candle patterns are the Inverted Hammer (60% success rate), Bearish Marubozu (56.1%), Gravestone Doji (57%), and Bearish Engulfing (57%). The inverted hammer is the most profitable candle pattern, with a 1.12% profit per trade.| Liberated Stock Trader
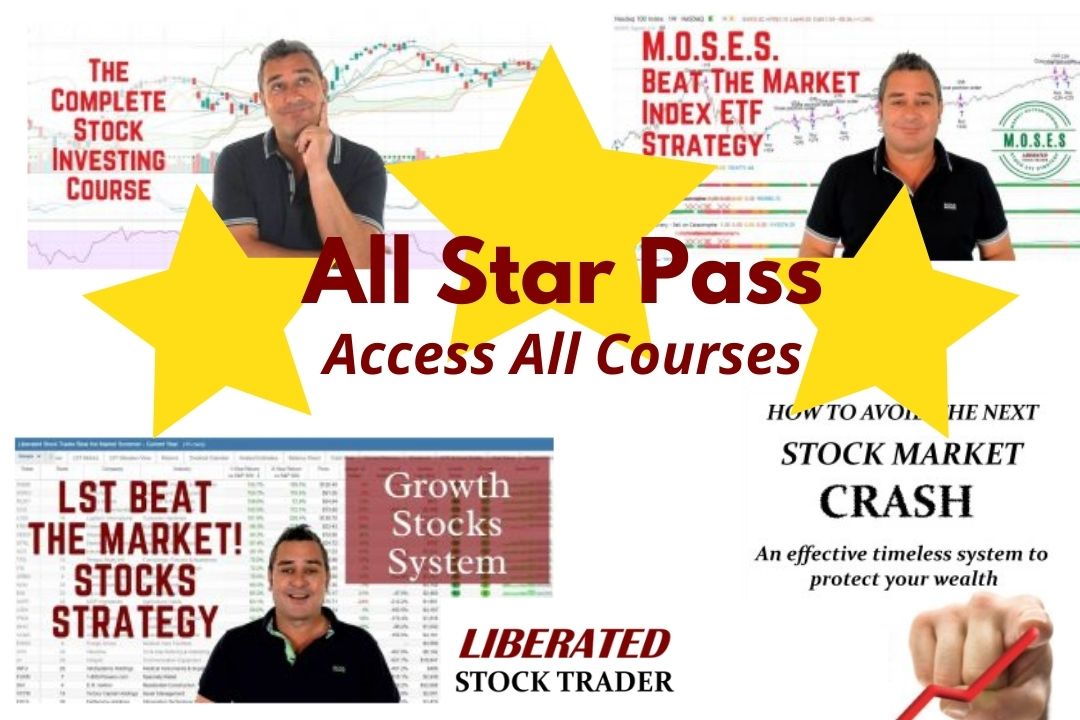
Our 4 Best Stock Investment Courses In One All-Star Pass. Start 2024 The Right Way with Full Lifetime Access To Our Pro Stock Investment Courses & Market-Beating Strategies.| Liberated Stock Trader
Day and swing trading uses technical chart analysis to trade short-term price moves, whereas growth and value investing use long-term fundamental financial analysis. The tools and strategies used for these types of trading are completely different.| Liberated Stock Trader
Professional analysts define all stock market trends using timeframe and direction: Timeframes are short-term, medium-term, and long-term. Direction is described using uptrend, downtrend, or consolidation.| Liberated Stock Trader
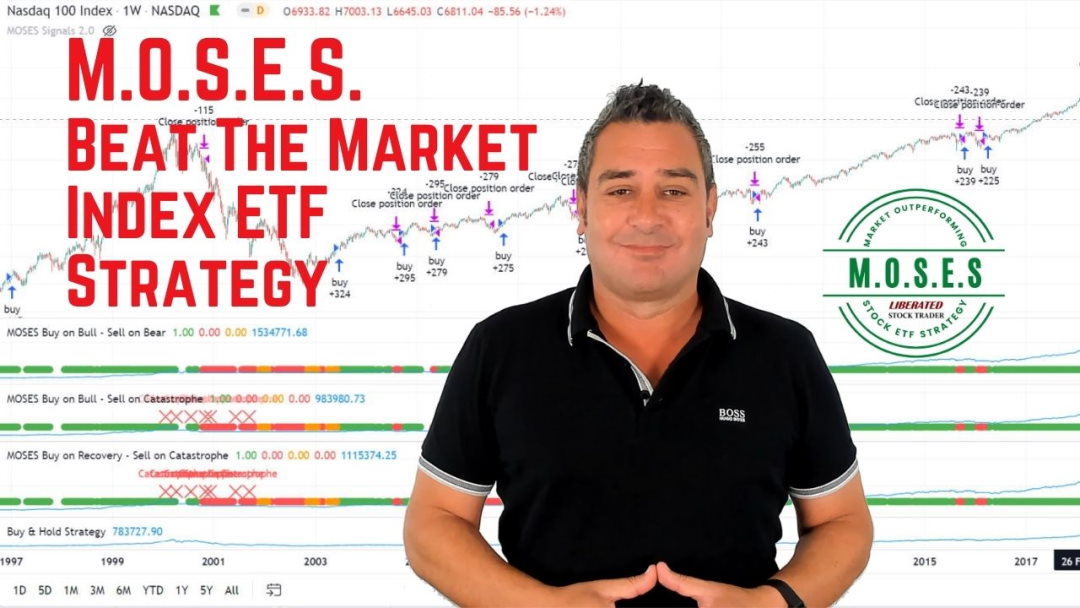
The MOSES ETF investing strategy is a powerful suite of indicators meticulously backtested over 100 years. Designed to empower you to outperform the market, it equips you with the tools to navigate major stock market crashes and unlock greater investing performance.| Liberated Stock Trader
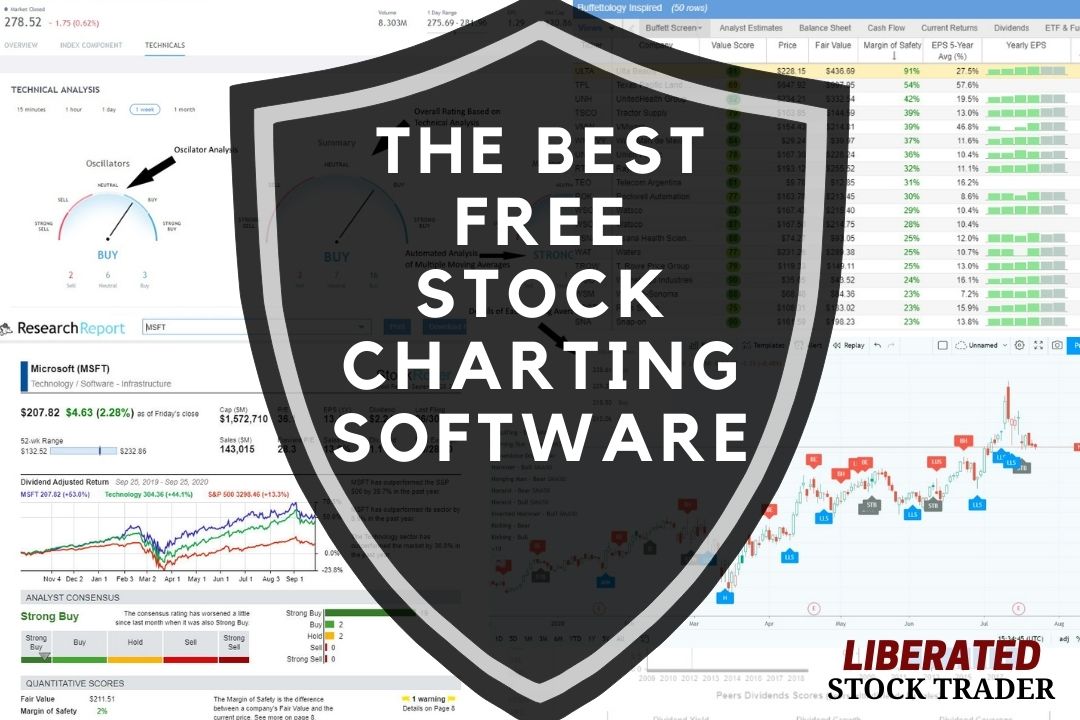
My testing shows that the best free stock charting software is TradingView, Stock Rover, Benzinga Pro, Finviz, and ChartMill. All offer unique features like powerful stock charts, community, real-time news, and global heatmaps.| Liberated Stock Trader
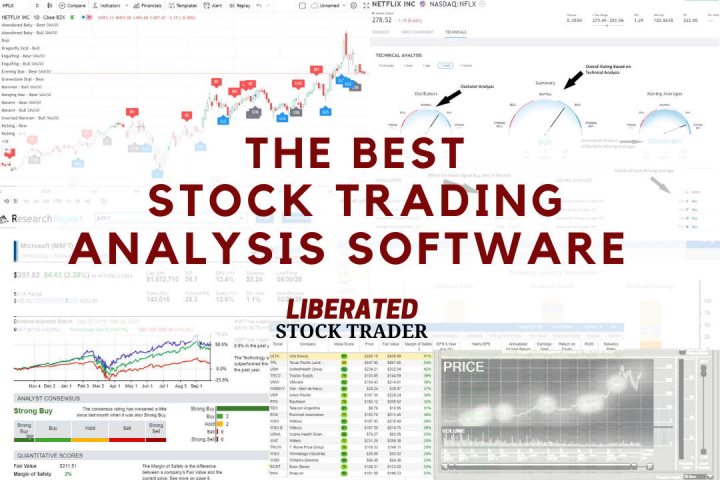
My in-depth testing shows that TradingView, TrendSpider, and Trade Ideas are the best tools for traders, and Stock Rover is superior for investors. Each provides unique benefits, features, and price points.| Liberated Stock Trader
Our research on 10,400 years of exchange data shows the best day trading indicators are the Price Rate of Change, VWAP, Weighted Moving Average, Hull Moving Average, Simple Moving Average, and RSI.| Liberated Stock Trader