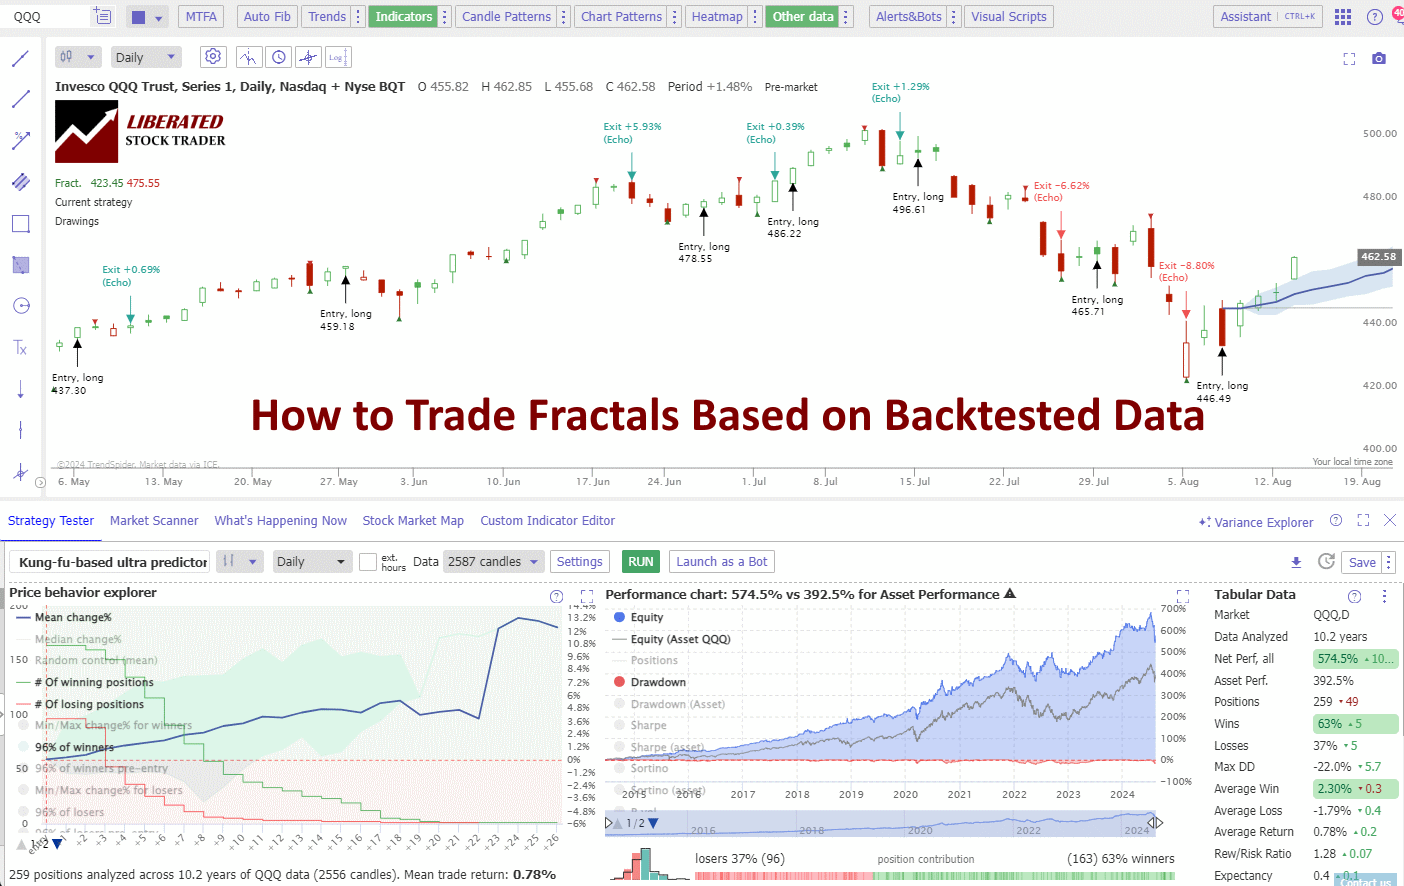
Based on 2,510 tested trades on 80 years of exchange data, I can confirm trading fractal patterns is profitable, with an average reward-to-risk ratio rate of 1.5 across all timescales.| Liberated Stock Trader
Open AI does have stock and is not publicly traded on any stock exchange. As a not-for-profit organization, OpenAI does not have the same financial goals as traditional companies and, therefore, does not need to raise capital through public offerings.| Liberated Stock Trader
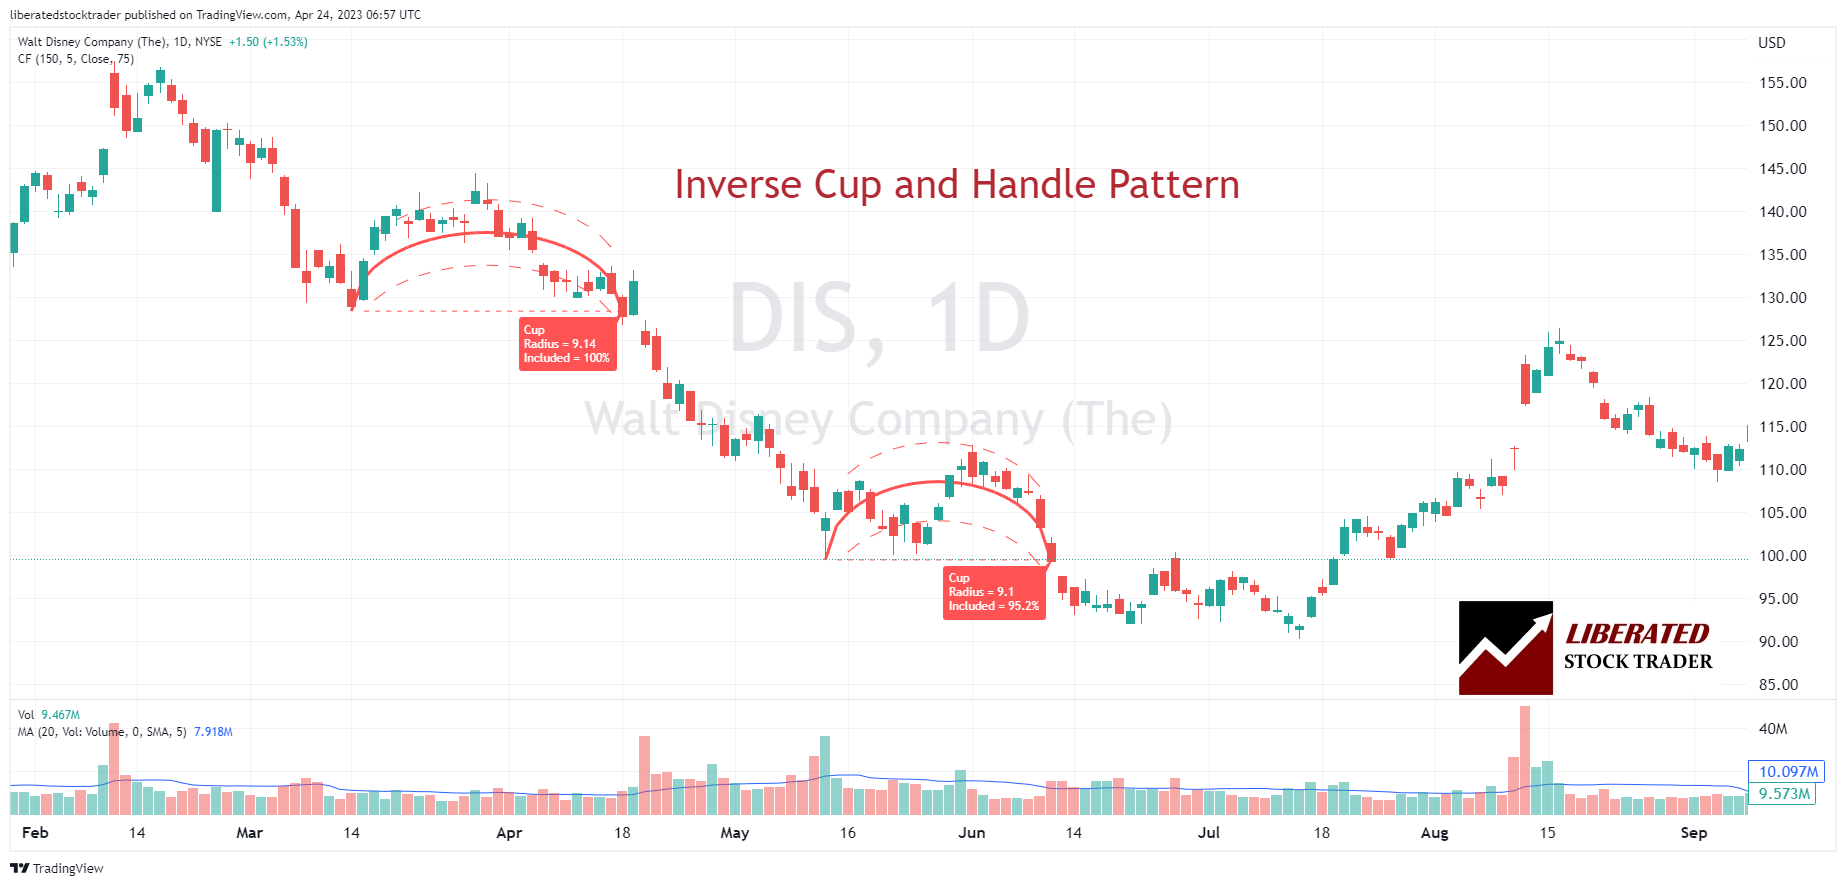
Two decades of trading research indicate that the inverse cup and handle pattern has an 82% success rate and average price drops of 17%. It is an ideal pattern for short-selling.| Liberated Stock Trader
According to testing, the top day trading software is TrendSpider's backtesting, scanning, and trading bots, and Trade Ideas with AI automated trading signals, and free stock trades.| Liberated Stock Trader
Renko charts filter out unnecessary price fluctuations to provide a clear stock price trend that traders can use in their investing strategies. Unlike a traditional bar or candlestick chart, Renko charts are based on price changes rather than time.| Liberated Stock Trader
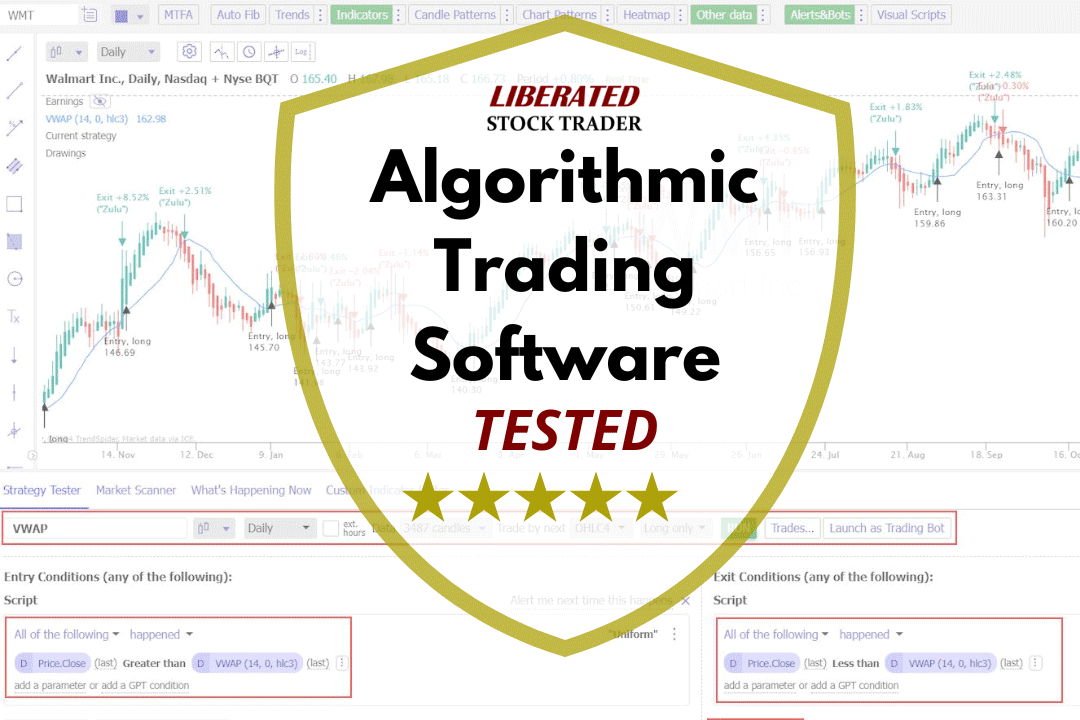
My testing shows that TrendSpider, Trade Ideas, TradingView, and Tickeron are the most effective software for creating, testing, and executing trading algorithms.| Liberated Stock Trader
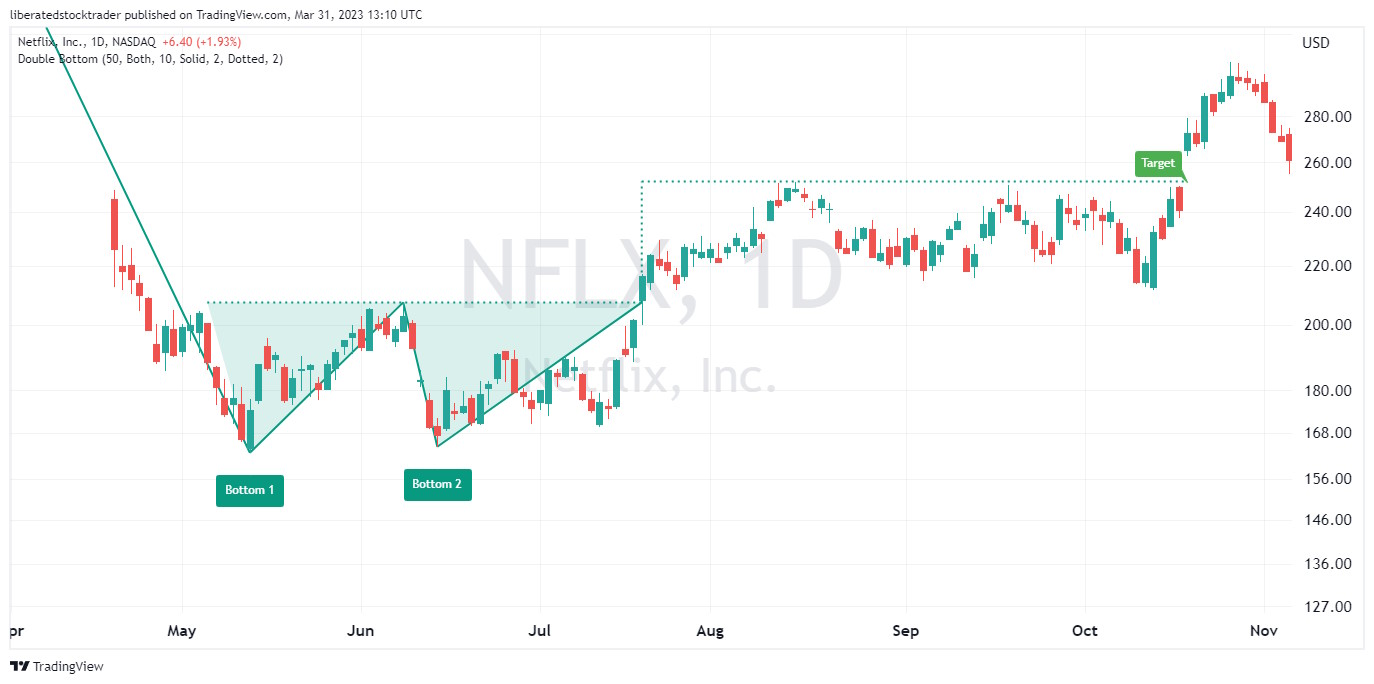
Decades of research reveal the double bottom pattern has an 88% success rate in bull markets and an average profit potential of +50%. The double-bottom chart pattern is one of the most reliable and accurate chart indicators in technical analysis.| Liberated Stock Trader
My research shows the most reliable and accurate bullish patterns are the cup-and-handle, with a 95% bullish success rate, head-and-shoulders (89%), double-bottom (88%), and triple-bottom (87%).| Liberated Stock Trader
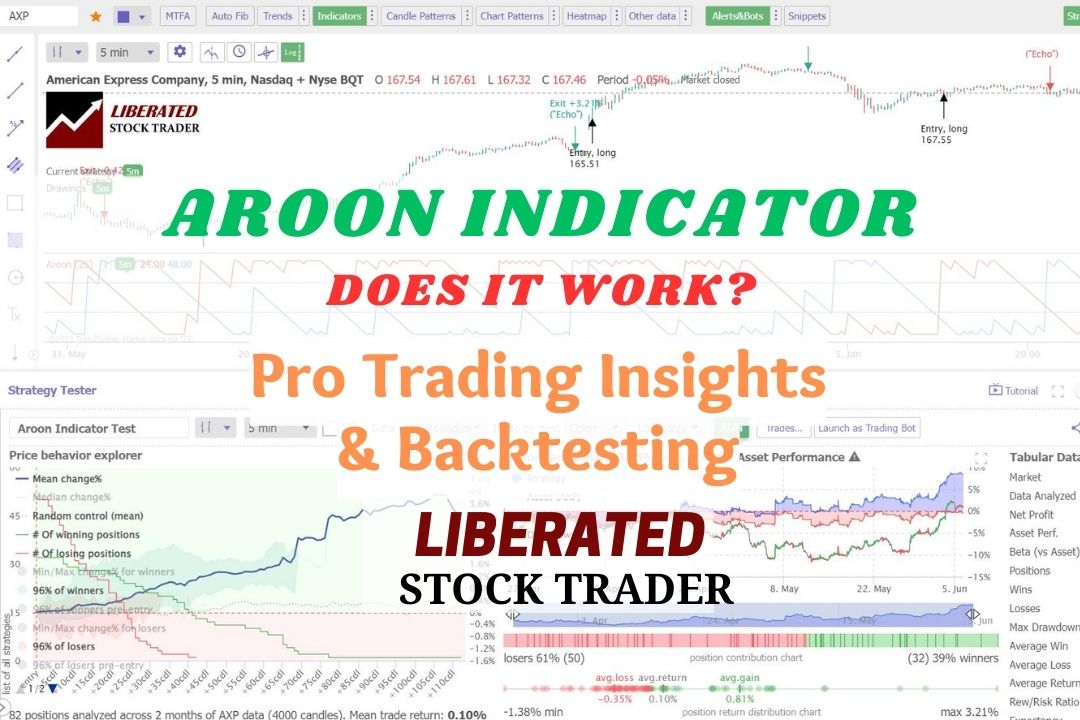
In technical analysis, the Aroon indicator identifies trend reversals and trend strength. This oscillating indicator has two parts: the "Aroon Up" line measures uptrend strength, and the "Aroon Down" line for downtrend strength.| Liberated Stock Trader
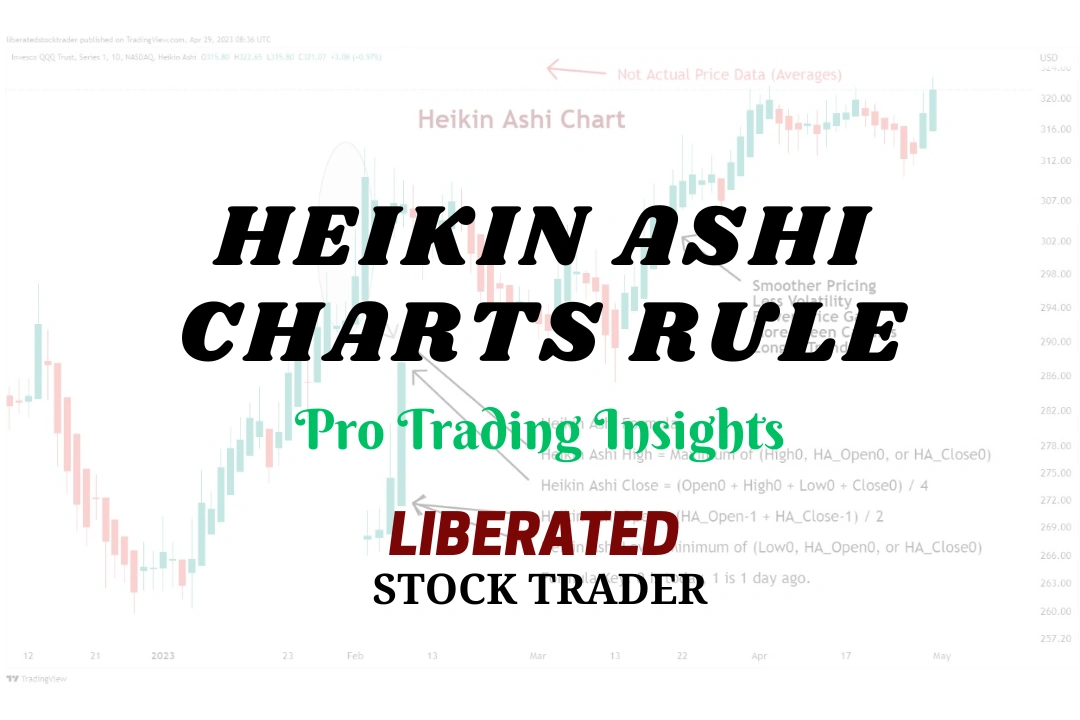
I backtested 360 years of data on the 30 most important US stocks, and our findings prove that Heikin-Ashi chart strategies outperform 66% of equities vs. a buy-and-hold strategy.| Liberated Stock Trader
There are two types of continuation patterns: bullish and bearish. Bullish continuation patterns occur when the market is trending upwards, while bearish continuation patterns happen when the market is trending downwards.| Liberated Stock Trader
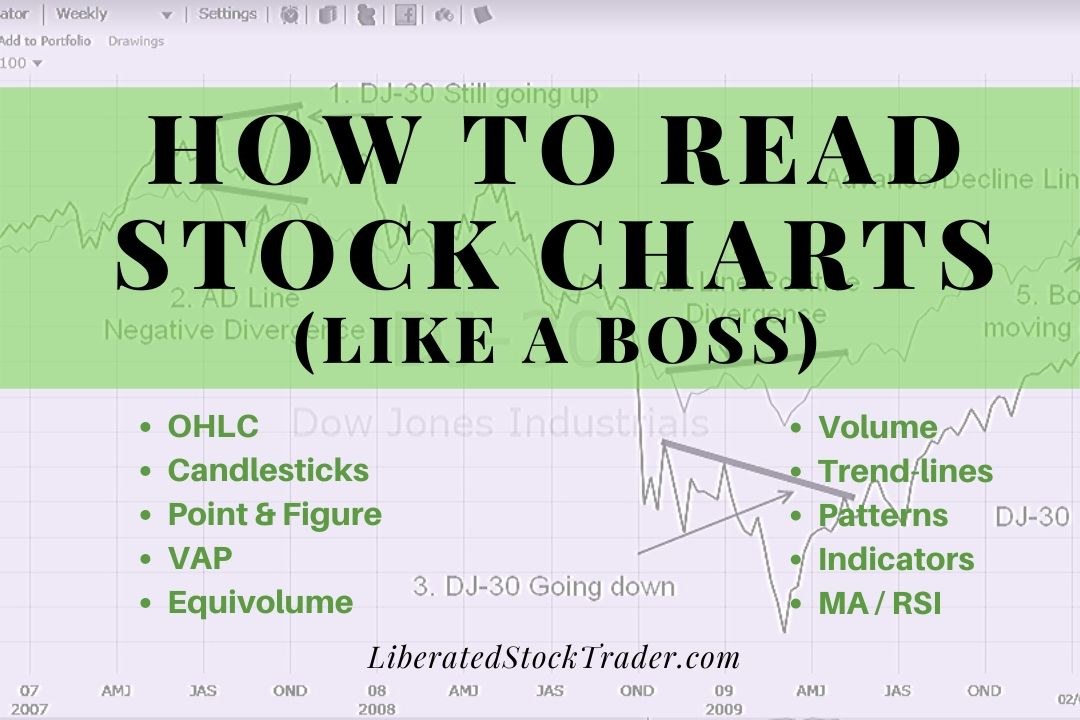
To read stock charts you need to use stock charting software, select your chart type, configure your timeframe, determine price direction using trendlines and use indicators to estimate future prices.| Liberated Stock Trader
The simple moving average (SMA) technical analysis indicator helps identify stock price trends. It calculates an arithmetic average of prices, offering a smooth line that eliminates short-term price volatility.| Liberated Stock Trader
I tested 23,487 RSI trades on 820 years of exchange data. When configured correctly, RSI can be highly profitable, with a 53% success rate and an average of 65% winning trades. The RSI setting of 14 on a 1-hour chart is the most reliable configuration for identifying profitable buy and sell signals.| Liberated Stock Trader
In my 40-day, 5-minute day trading test, pairing ROC with a Heikin Ashi chart outperformed the market 93% of the time, compared to 43% with classic candles, while increasing the win rate (55% vs. 45%) and reward-to-risk ratio (2.7 vs. 1.84).| Liberated Stock Trader
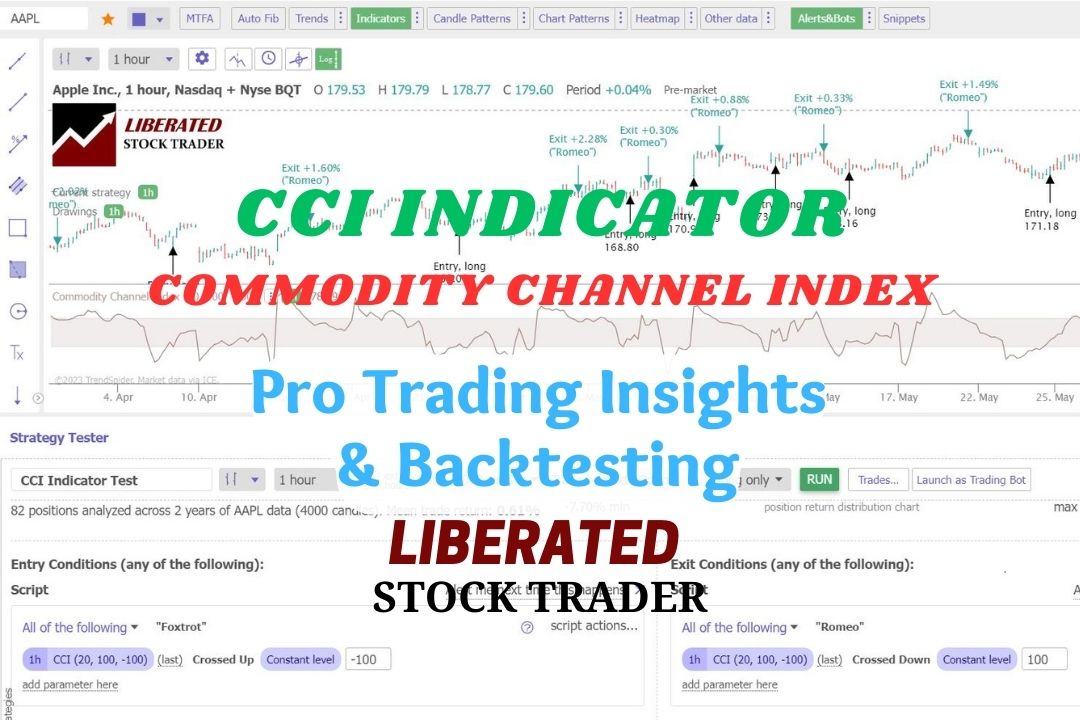
Based on 43,297 test trades, my research indicates that the CCI is a highly profitable momentum indicator, yielding a win rate of up to 85% when used with the correct settings.| Liberated Stock Trader
Research shows that the most reliable chart patterns are the Head and Shoulders, with an 89% success rate, the Double Bottom (88%), and the Triple Bottom and Descending Triangle (87%). The Rectangle Top is the most profitable, with an average win of 51%, followed by the Rectangle Bottom with 48%.| Liberated Stock Trader
The best moving average settings are SMA or EMA 20 on a daily chart, which achieves a 23% win rate. At settings 50, 100, and 200, it is better to use the Hull moving average, which has win rates of 27%, 10%, and 17%, respectively.| Liberated Stock Trader
My 2025 testing awards TradingView 4.8 stars due to its continued innovation in chart analysis, pattern recognition, screening, and backtesting. TradingView is my top recommendation for US and international traders.| Liberated Stock Trader
My test results show the best financial news services are Benzinga Pro, MetaStock R/T, Bloomberg, the Wall Street Journal, and the Economist. Each provides trustworthy stock market news for investors.| Liberated Stock Trader
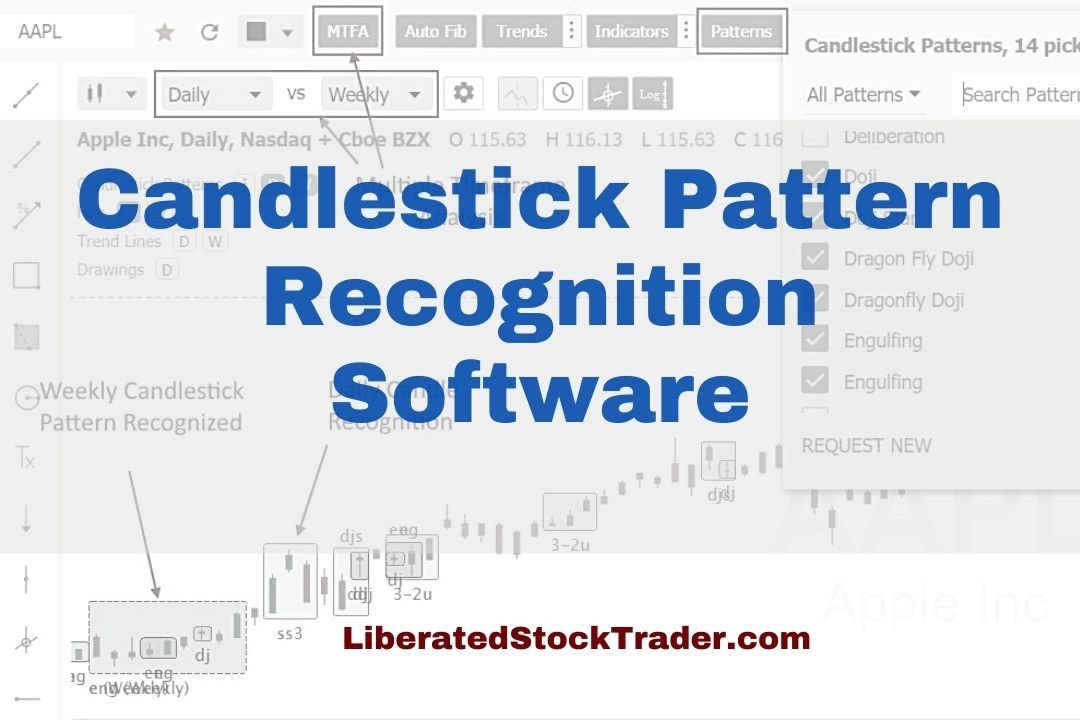
Testing reveals the best stock chart candlestick pattern recognition software is TrendSpider, TradingView, MetaStock, and Finviz.| Liberated Stock Trader
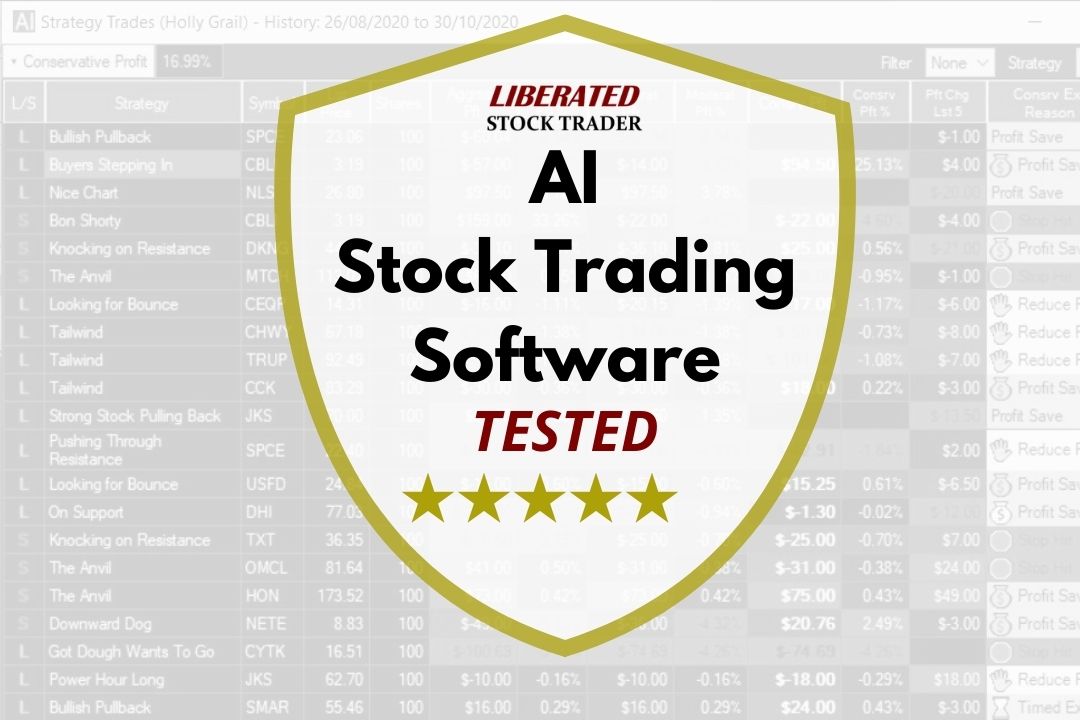
My research identifies Trade Ideas and TrendSpider as the leaders in AI trading software. Trade Ideas offers automated trading and bots, while TrendSpider offers automated pattern recognition, auto-trading, and backtesting.| Liberated Stock Trader
My testing awards Trendspider 4.8/5 stars due to its innovation. Its powerful algorithms recognize trendlines, chart patterns, and candlesticks automatically. It also has automated trading bots, real AI LLMs, and powerful point-and-click back- testing.| Liberated Stock Trader
Our research on 10,400 years of exchange data shows the best day trading indicators are the Price Rate of Change, VWAP, Weighted Moving Average, Hull Moving Average, Simple Moving Average, and RSI.| Liberated Stock Trader
My in-depth testing shows Trade Ideas is the ultimate black box AI-powered day trading signal platform with built-in automated bot trading.| Liberated Stock Trader