A one-point move in a stock price equals a one-dollar change. When someone says a stock is down two points, its price has declined by two dollars. Points in a stock index are similar to points in a stock, but instead of referring to the actual stock price, they refer to an index's performance.| Liberated Stock Trader
Be careful when trading bearish flags. According to published research, the bear flag pattern has a low success rate of 45%. This means you are flipping a coin when trading this pattern, as the odds are not in your favor. The high-tight bear flag is the only flag pattern you should trade.| Liberated Stock Trader
Stock volume measures the number of shares traded and indicates market strength. Rising markets with increasing volume are viewed as bullish, and falling prices on higher volume are bearish.| Liberated Stock Trader
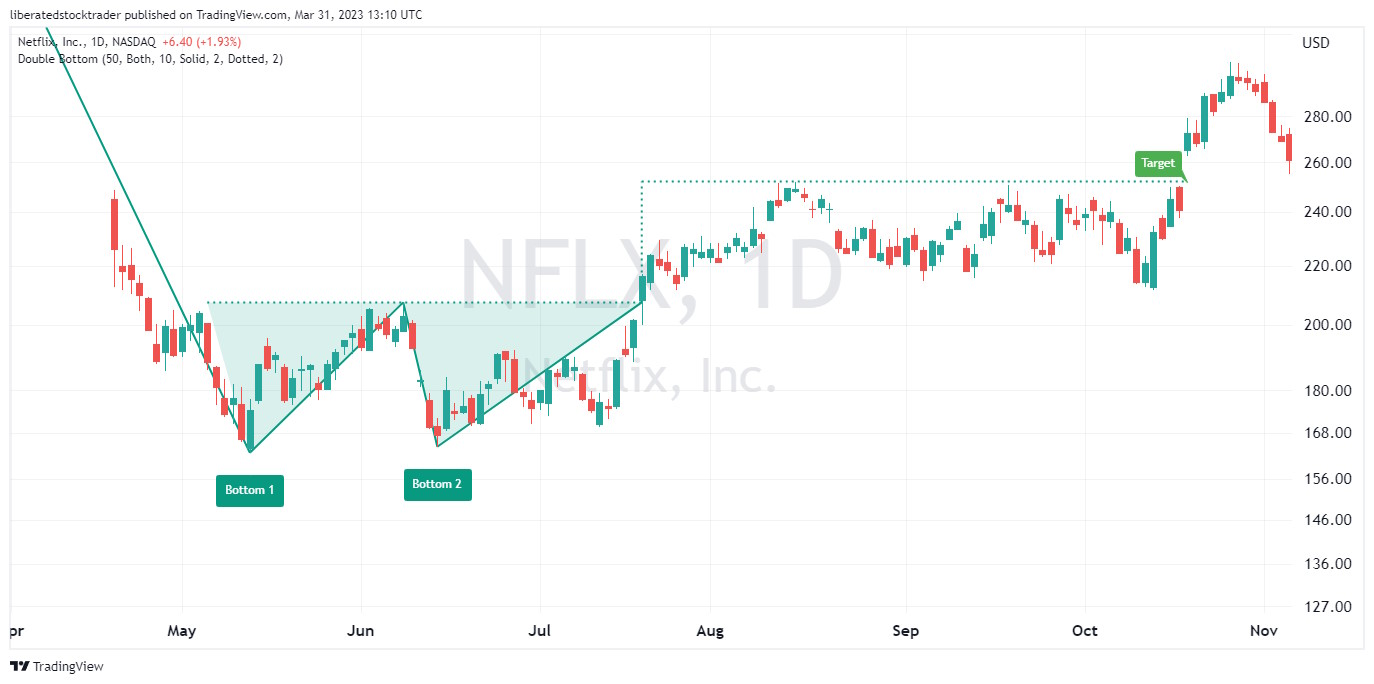
Decades of research reveal the double bottom pattern has an 88% success rate in bull markets and an average profit potential of +50%. The double-bottom chart pattern is one of the most reliable and accurate chart indicators in technical analysis.| Liberated Stock Trader
There are two types of continuation patterns: bullish and bearish. Bullish continuation patterns occur when the market is trending upwards, while bearish continuation patterns happen when the market is trending downwards.| Liberated Stock Trader
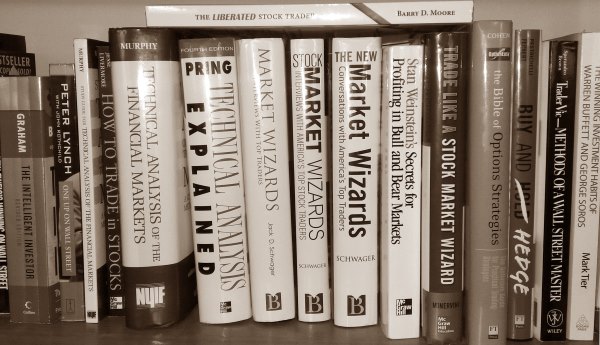
The best technical analysis books leading industry bodies recommend are Technical Analysis of the Financial Markets, Technical Analysis Explained, Cloud Charts, and Forecasting Financial Markets.| Liberated Stock Trader
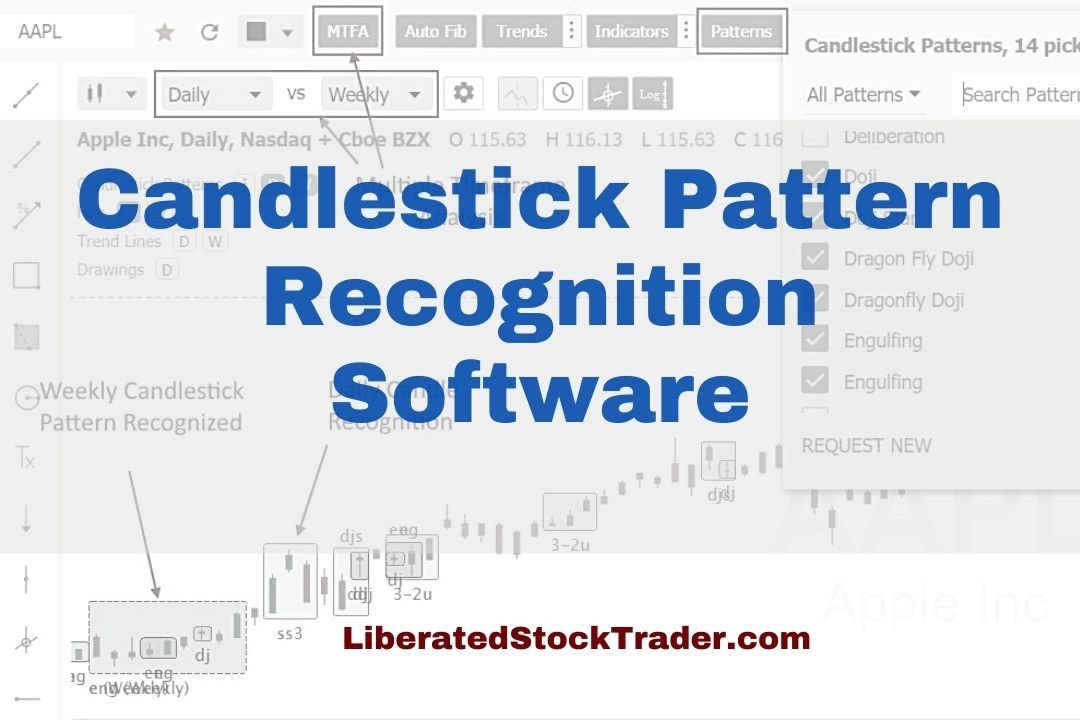
Testing reveals the best stock chart candlestick pattern recognition software is TrendSpider, TradingView, MetaStock, and Finviz.| Liberated Stock Trader