Custom master template - Data Bloo
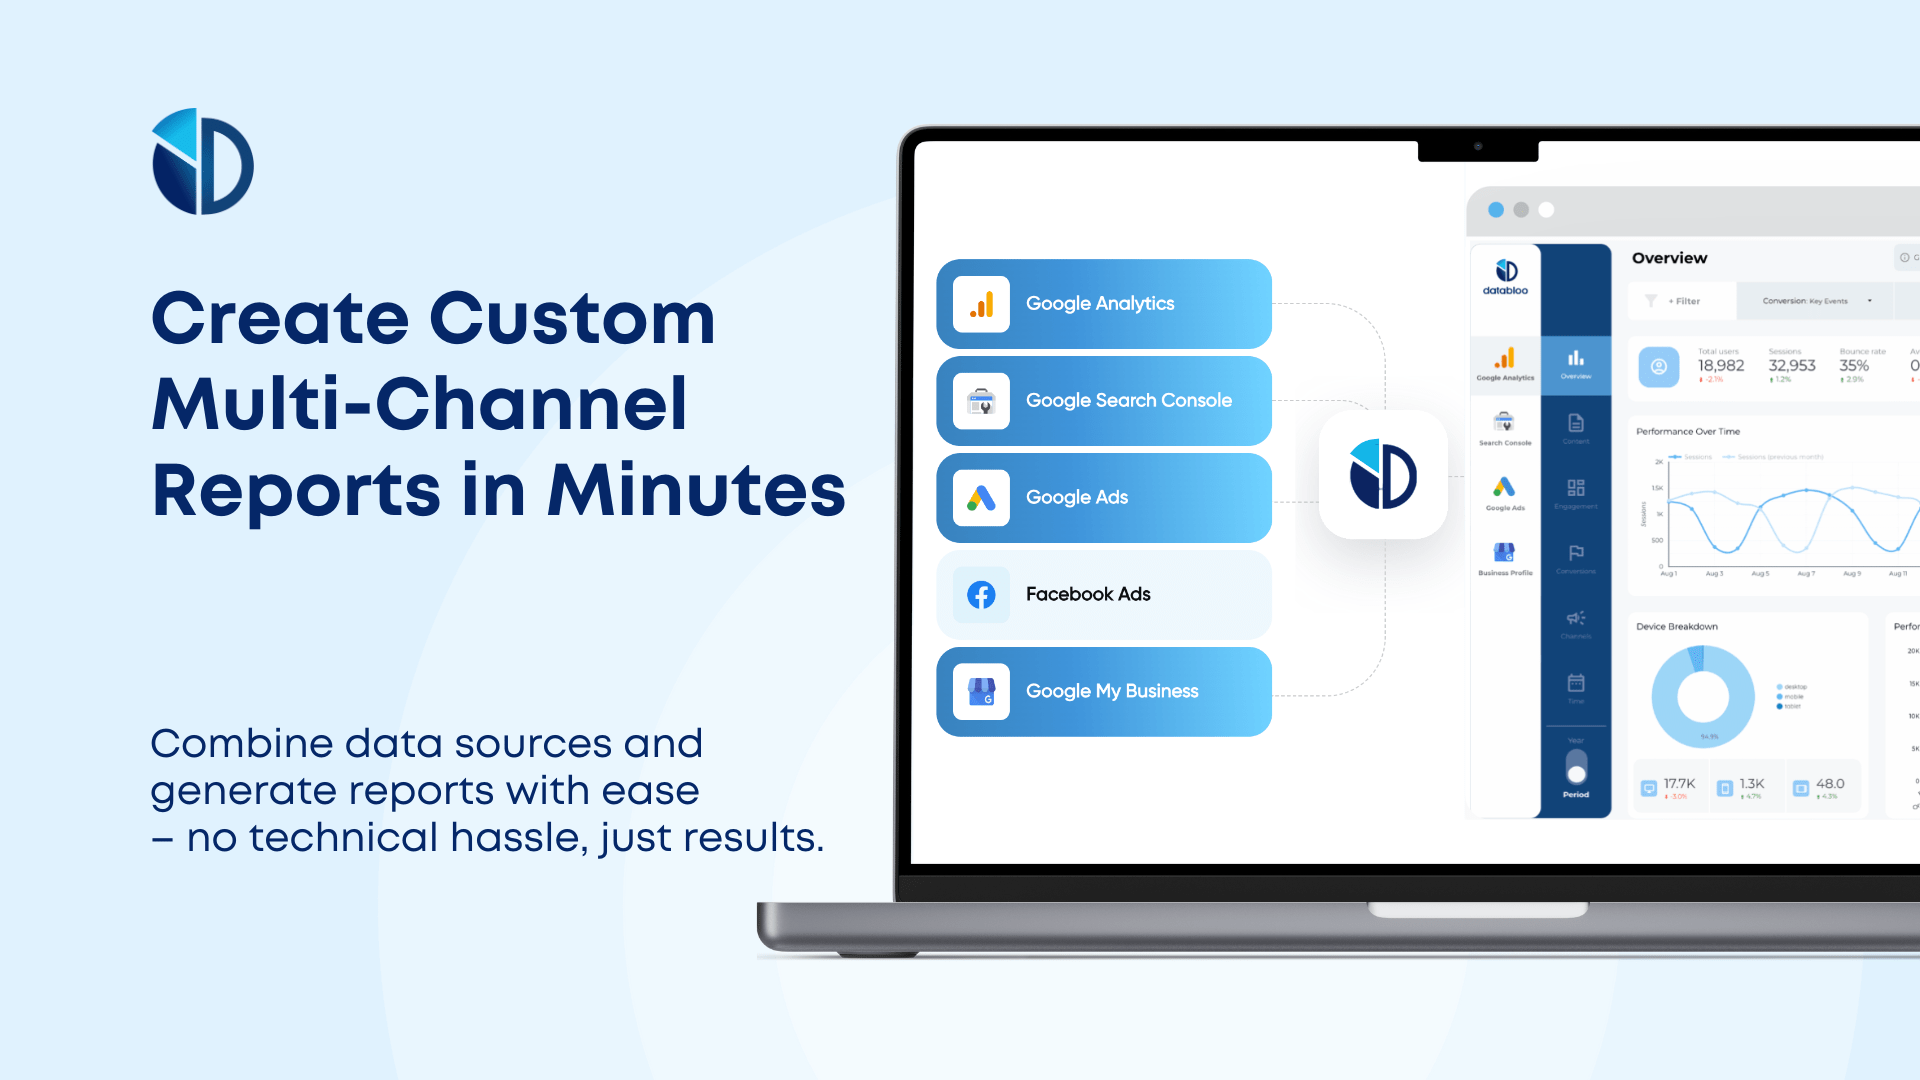
Create custom multi-channel reports in minutes with Looker Studio. Combine data sources, save time, and get actionable insights with ease.| Data Bloo
Create custom multi-channel reports in minutes with Looker Studio. Combine data sources, save time, and get actionable insights with ease.| Data Bloo
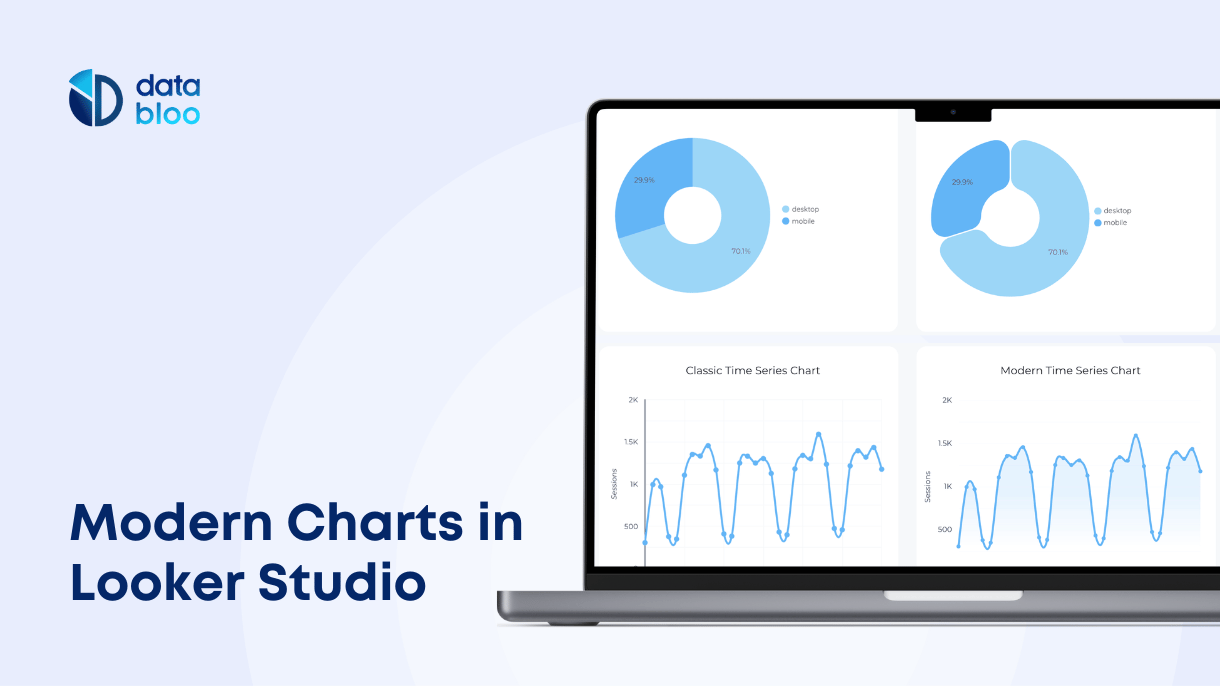
Discover Looker Studio's new Modern Charts with enhanced styling, rounded edges, gradients, and better customization for clearer data visualization.| Data Bloo
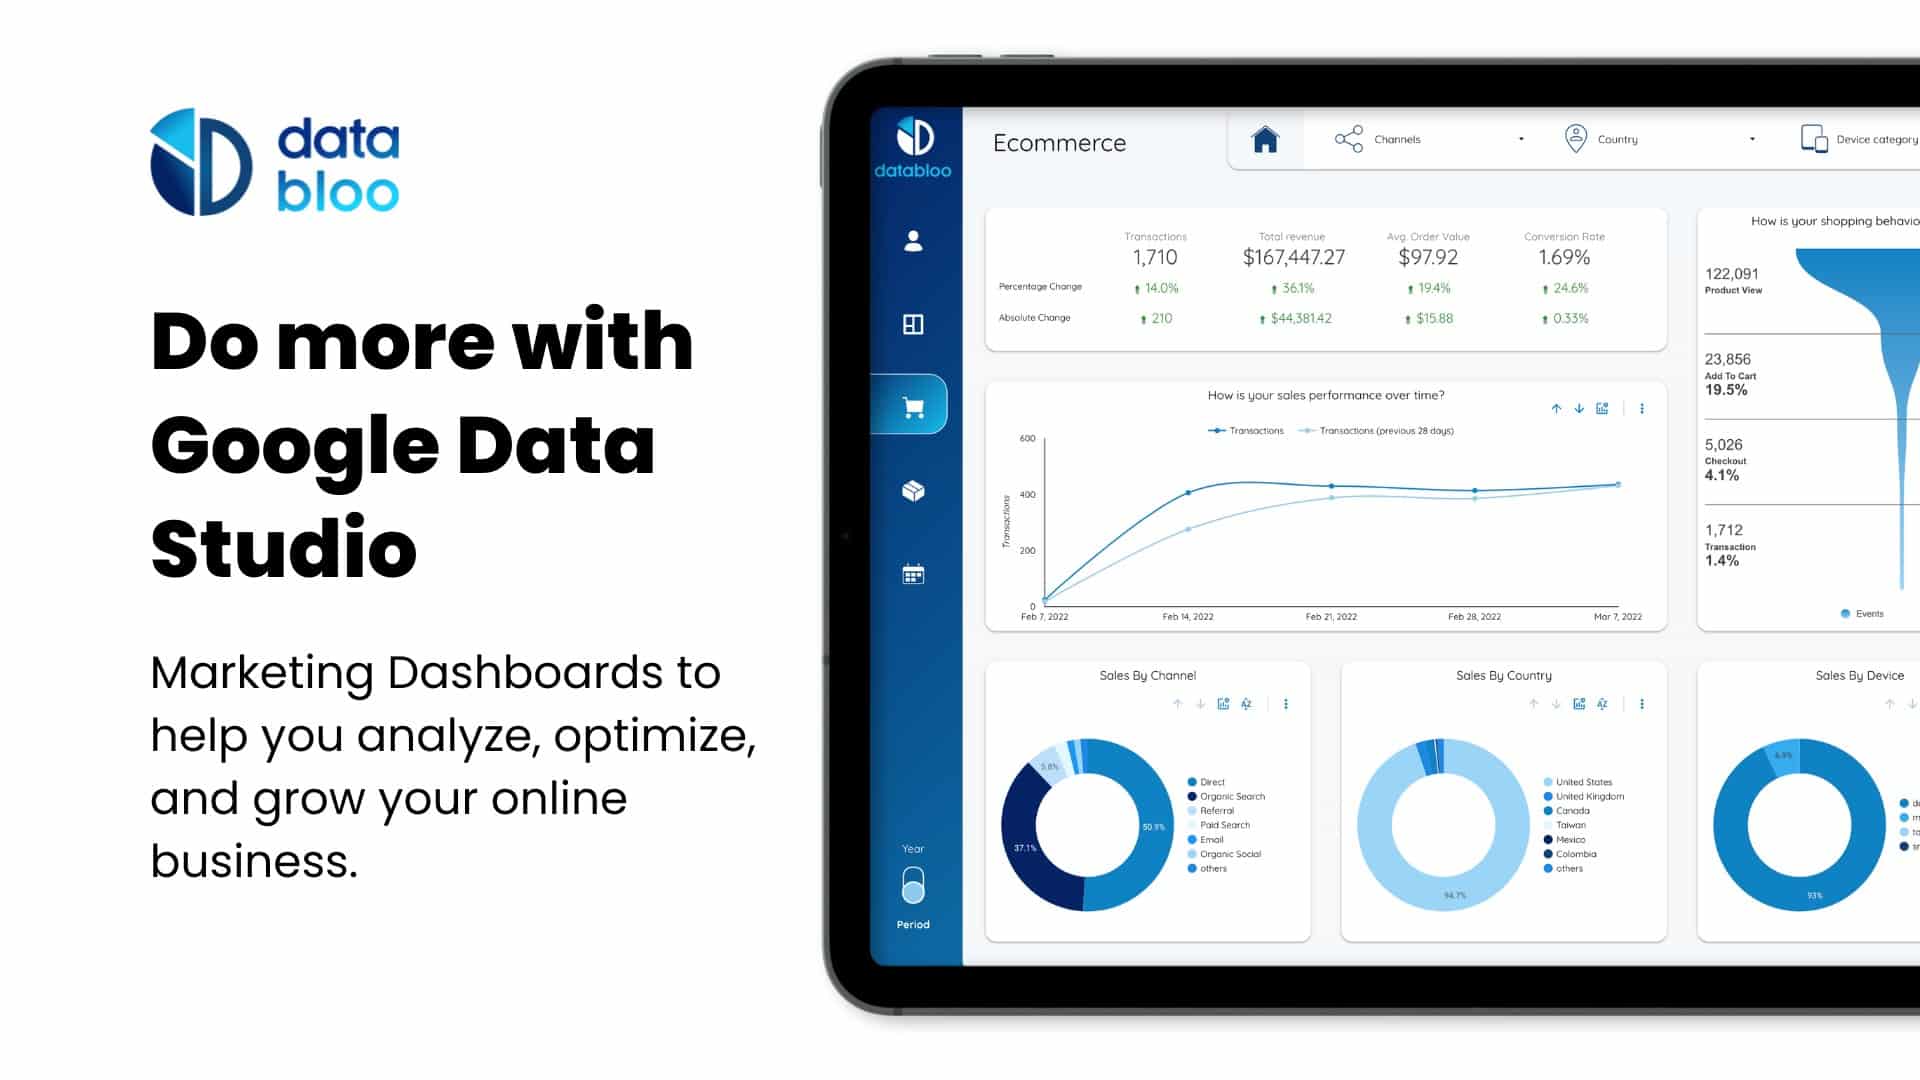
Check out our Looker Studio Gallery for ecommerce, SEO, SEM and paid social. Upgrade your digital reporting in minutes with our ready-to-use Looker Studio templates.| Data Bloo
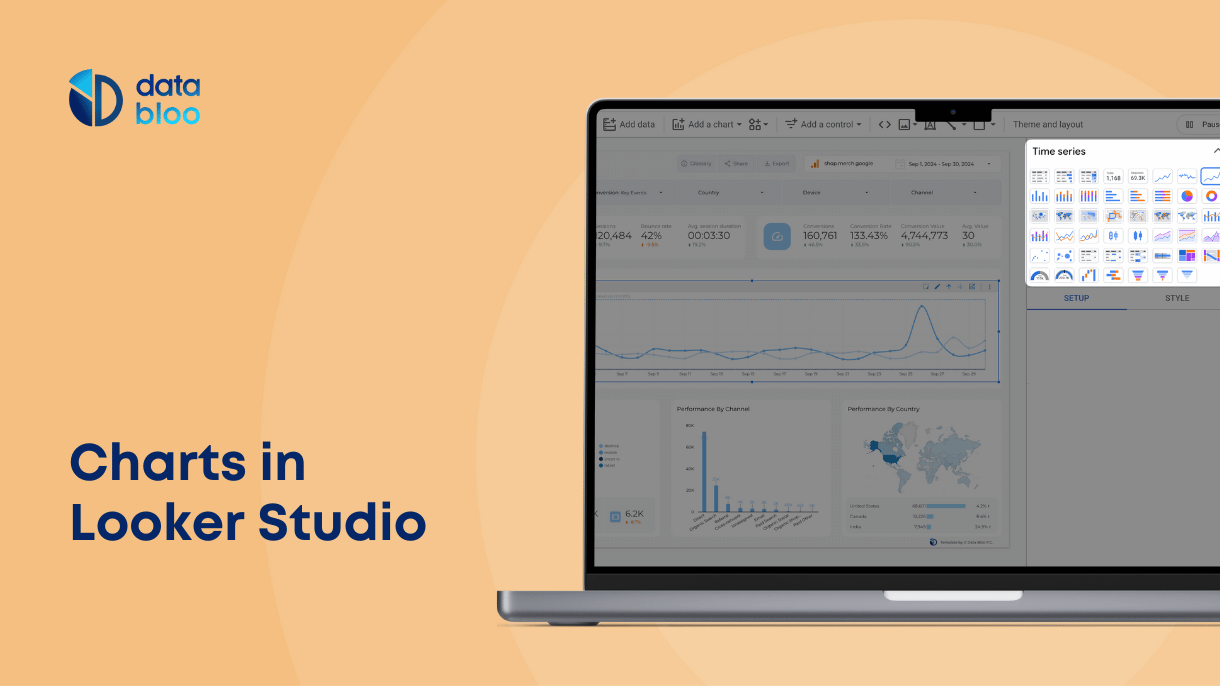
Use Google Looker Studio charts to visualize your data and create top notch reports. Here are the most common preset charts and custom community visualizations.| Data Bloo
