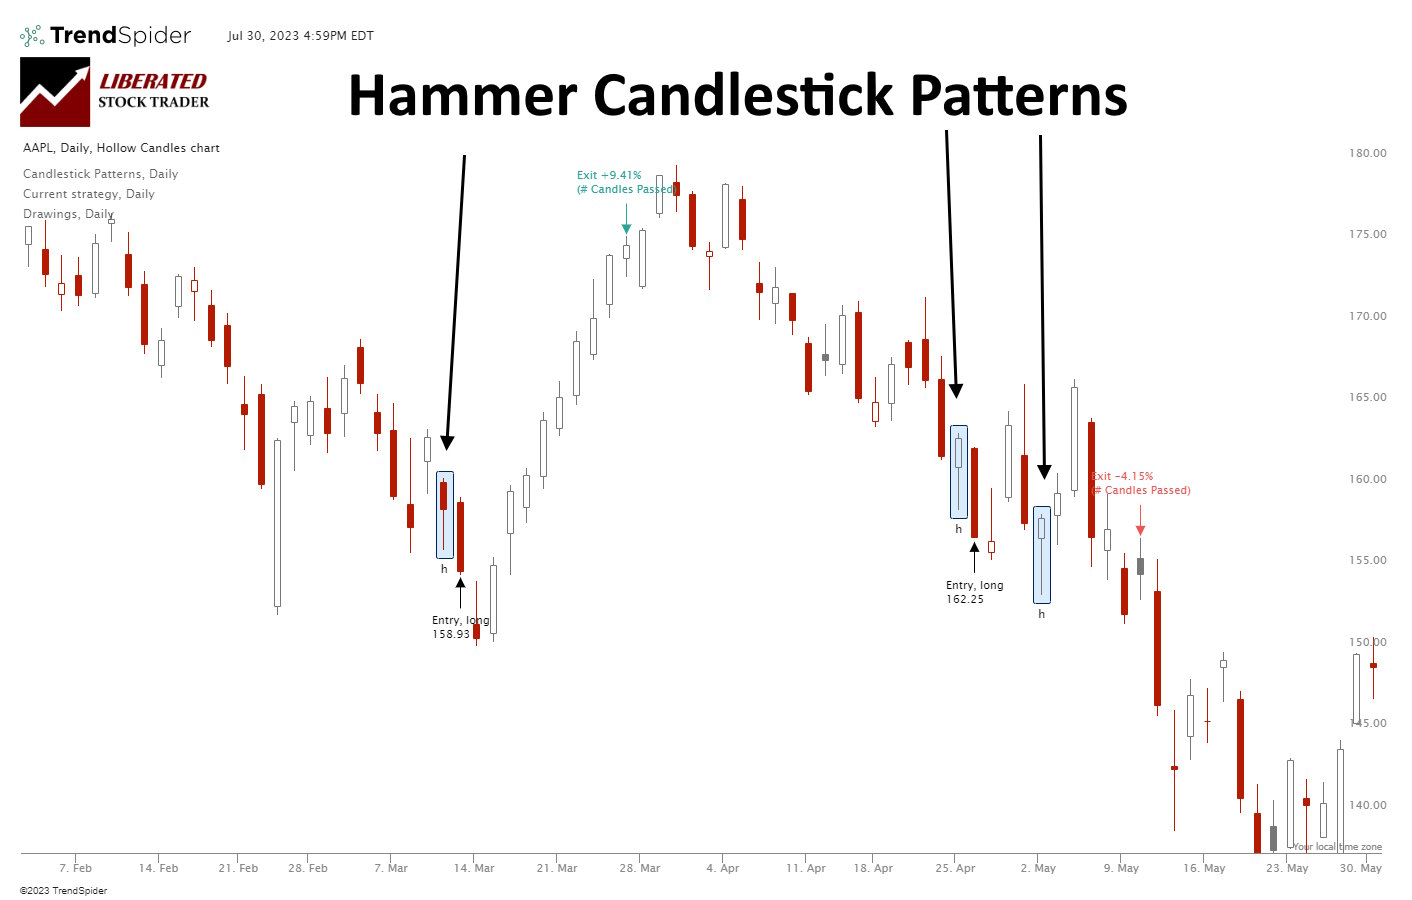
According to 2,219 tested trades, a Hammer is extremely unreliable and unprofitable. It has a low % accuracy rate of 52.1%, resulting in a razor-thin 0.18% profit per trade.| Liberated Stock Trader
The three main types of financial statements are the balance sheet, income statement, and cash flow statement. Each one provides a different perspective on a company's finances.| Liberated Stock Trader
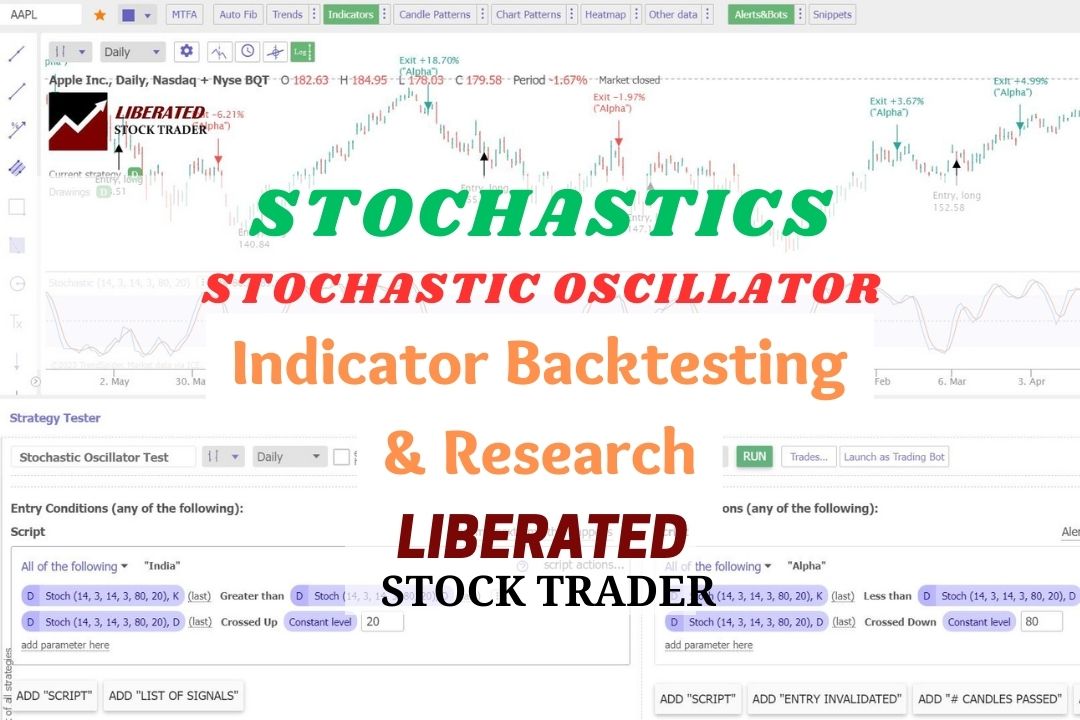
The Stochastic Oscillator momentum indicator compares an asset's closing price to a range of its previous prices. It oscillates between 0 and 100; below 20 indicates oversold, and above 80 suggests an overbought market.| Liberated Stock Trader
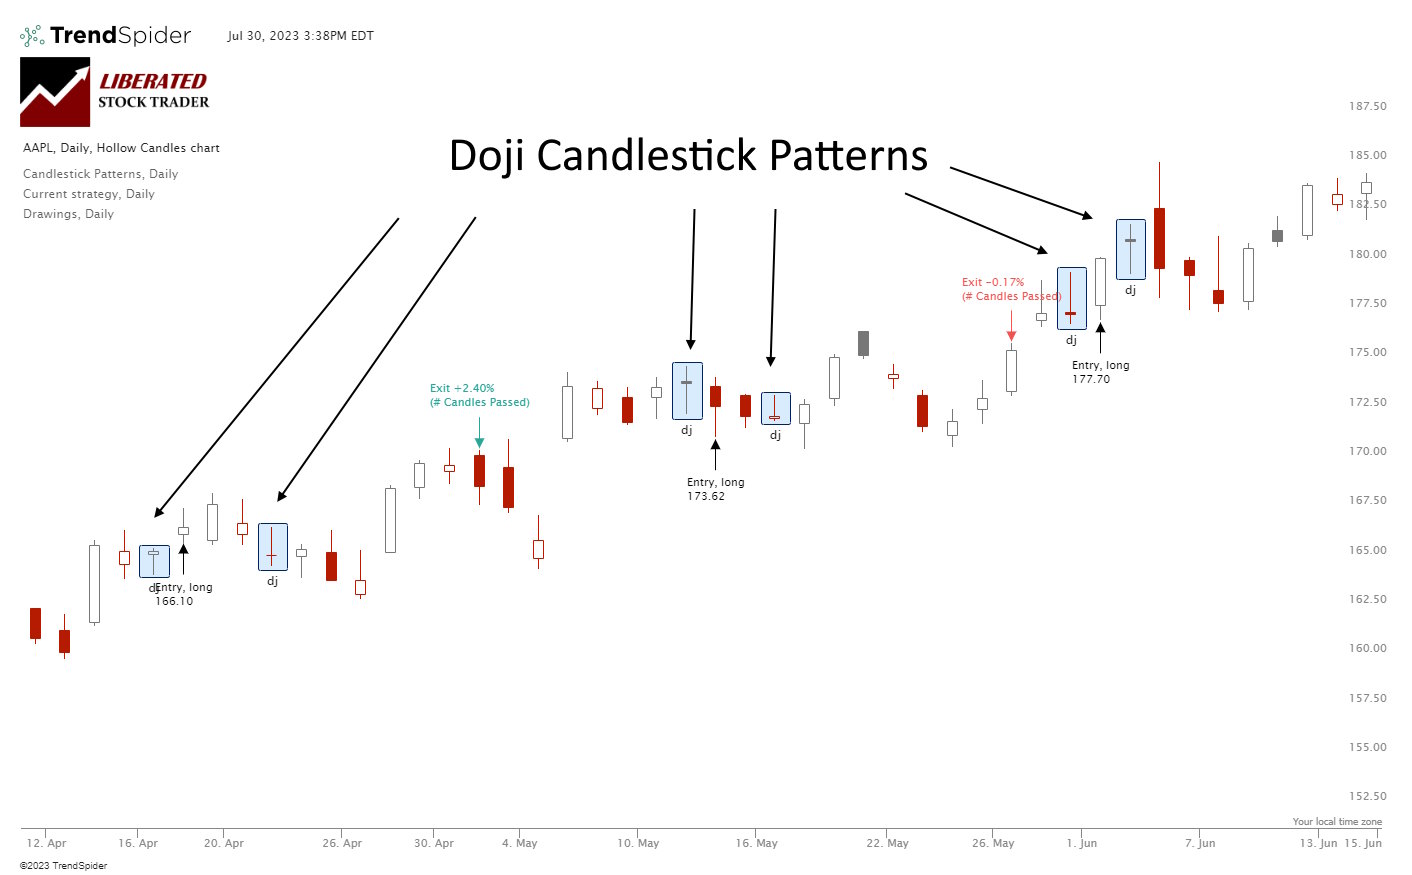
A Doji candlestick chart pattern indicates a battle between buyers and sellers, ending in equilibrium. The Doji marks a potential trend reversal. Is the Doji pattern profitable or accurate? Our evidence suggests its profitability is marginal.| Liberated Stock Trader
Decades of research have proven the most predictable bearish chart patterns are the inverted cup-and-handle, with an average price decrease of 17%, the rectangle top (-16%), head-and-shoulders (-16%), and the descending triangle (-15%).| Liberated Stock Trader
An exponential moving average (EMA) technical indicator reduces the lag associated with simple moving averages (SMA) by applying a multiplier to the most recent data. EMAs provide improved sensitivity, enhancing the accuracy of trend analysis.| Liberated Stock Trader
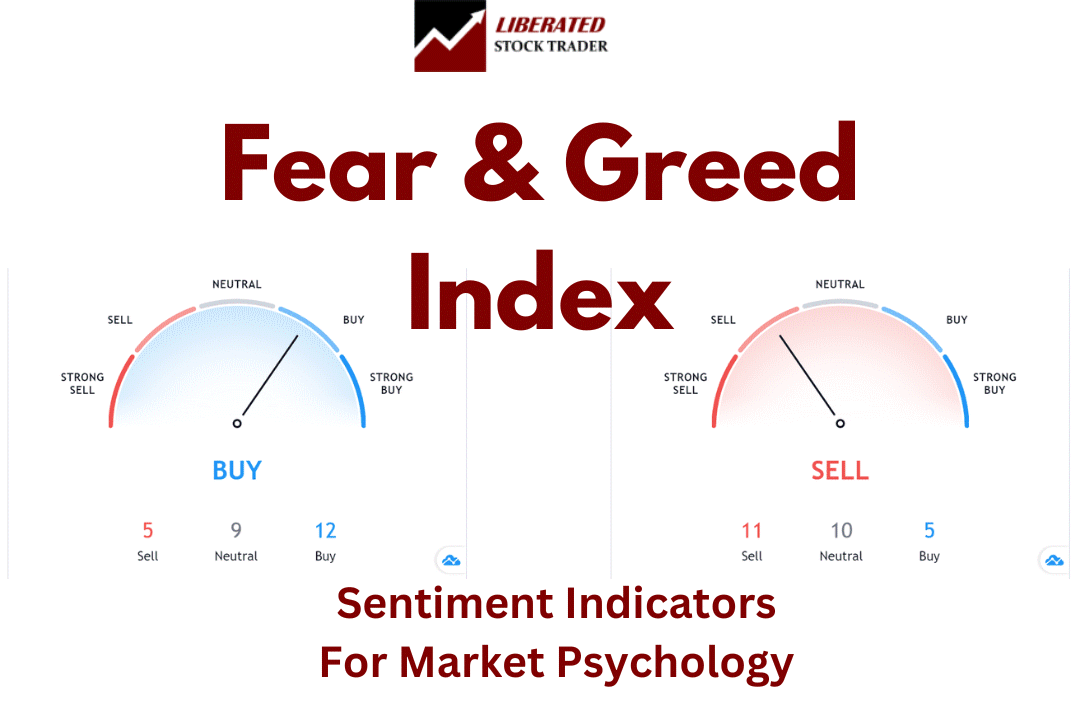
Our Fear and Greed Index goes beyond the basics, offering nine real-time and historical charts to help you stay ahead. With live data from the Federal Reserve, VIX CBOE, and 15 technical stock price signals, you'll have the tools to make smarter decisions today.| Liberated Stock Trader
Learn stock market investing with the complete online stock trading course by Barry D. Moore, a certified financial analyst from the International Federation of Technical Analysts (IFTA).| Liberated Stock Trader
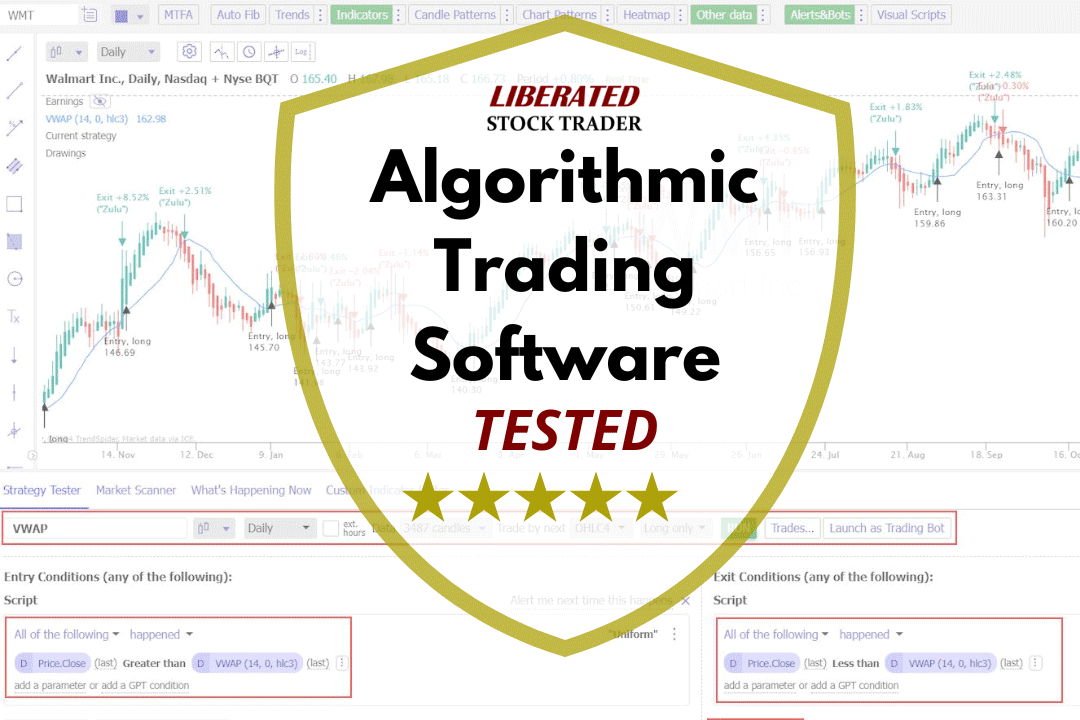
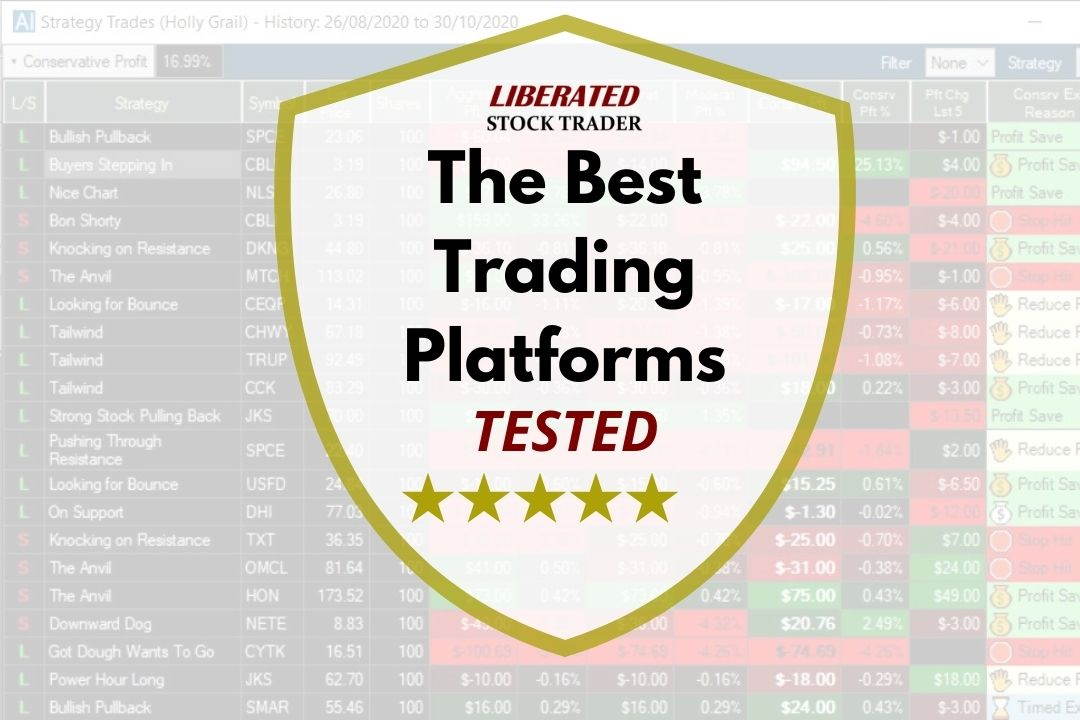
My testing shows that TrendSpider, Trade Ideas, TradingView, and Tickeron are the most effective software for creating, testing, and executing trading algorithms.| Liberated Stock Trader
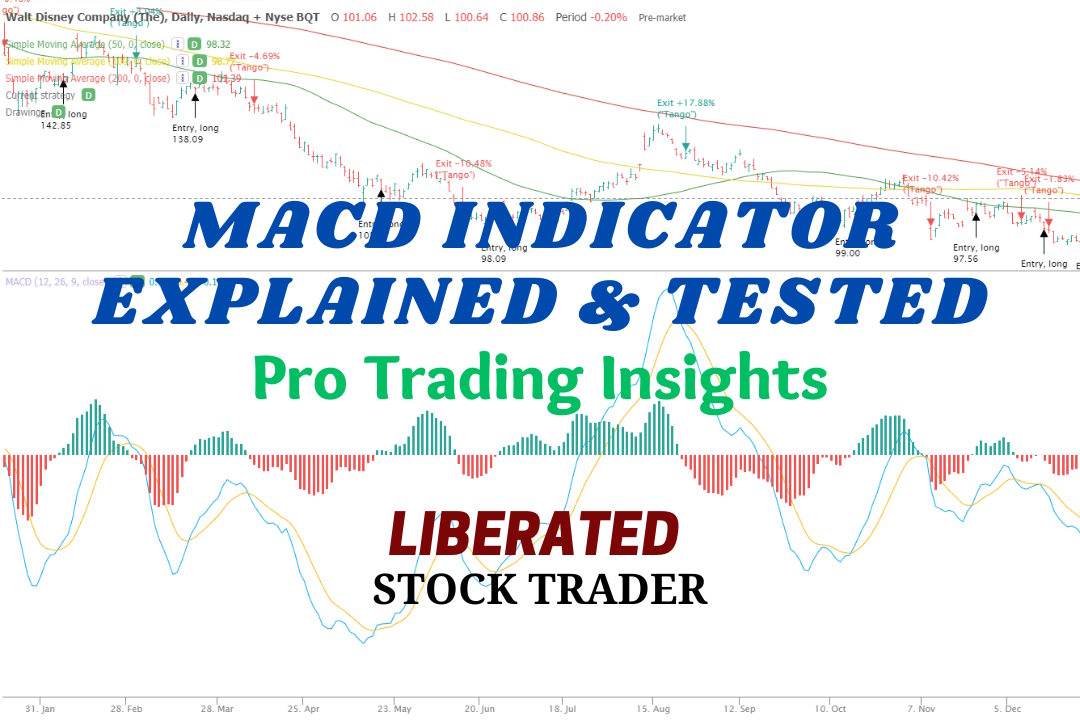
MACD is a trend-following momentum indicator used to identify price trends. We conducted 606,422 test trades to find the best settings and trading strategies.| Liberated Stock Trader
My research shows the most reliable and accurate bullish patterns are the cup-and-handle, with a 95% bullish success rate, head-and-shoulders (89%), double-bottom (88%), and triple-bottom (87%).| Liberated Stock Trader
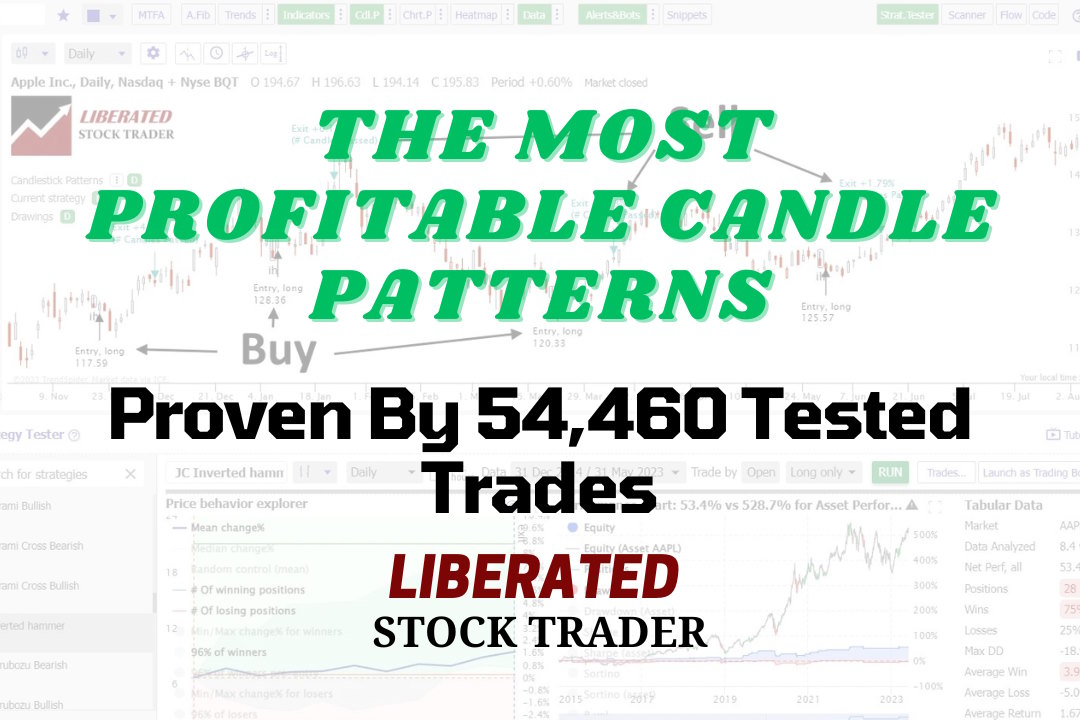
My rigorous testing shows the most reliable candle patterns are the Inverted Hammer (60% success rate), Bearish Marubozu (56.1%), Gravestone Doji (57%), and Bearish Engulfing (57%). The inverted hammer is the most profitable candle pattern, with a 1.12% profit per trade.| Liberated Stock Trader
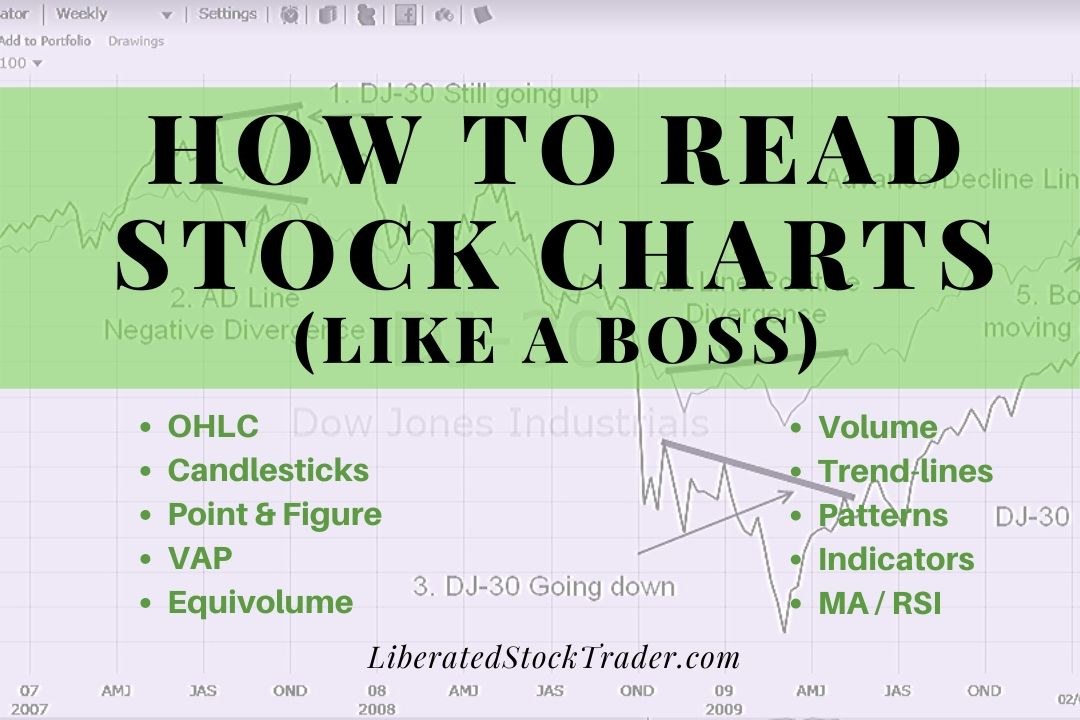
To read stock charts you need to use stock charting software, select your chart type, configure your timeframe, determine price direction using trendlines and use indicators to estimate future prices.| Liberated Stock Trader
Professional analysts define all stock market trends using timeframe and direction: Timeframes are short-term, medium-term, and long-term. Direction is described using uptrend, downtrend, or consolidation.| Liberated Stock Trader
The simple moving average (SMA) technical analysis indicator helps identify stock price trends. It calculates an arithmetic average of prices, offering a smooth line that eliminates short-term price volatility.| Liberated Stock Trader
The Relative Strength Index (RSI) is an oscillating momentum indicator that measures the speed and change of stock price movements. RSI uses a scale from 0 to 100 to indicate overbought or oversold conditions.| Liberated Stock Trader
Research shows that the most reliable chart patterns are the Head and Shoulders, with an 89% success rate, the Double Bottom (88%), and the Triple Bottom and Descending Triangle (87%). The Rectangle Top is the most profitable, with an average win of 51%, followed by the Rectangle Bottom with 48%.| Liberated Stock Trader
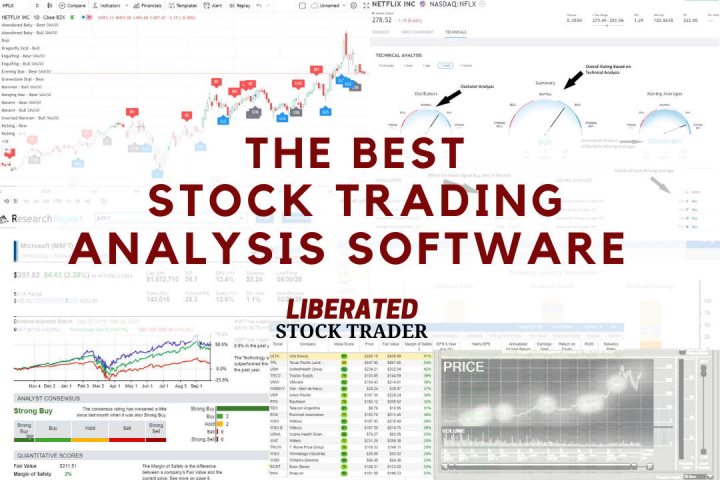
My in-depth testing shows that TradingView, TrendSpider, and Trade Ideas are the best tools for traders, and Stock Rover is superior for investors. Each provides unique benefits, features, and price points.| Liberated Stock Trader
My testing shows that TrendSpider, Trade Ideas, and TradingView are the best-automated trading software. Each platform offers auto-trading bots, pattern recognition, backtesting, and broker integration.| Liberated Stock Trader
My research identifies Trade Ideas and TrendSpider as the leaders in AI trading software. Trade Ideas offers automated trading and bots, while TrendSpider offers automated pattern recognition, auto-trading, and backtesting.| Liberated Stock Trader
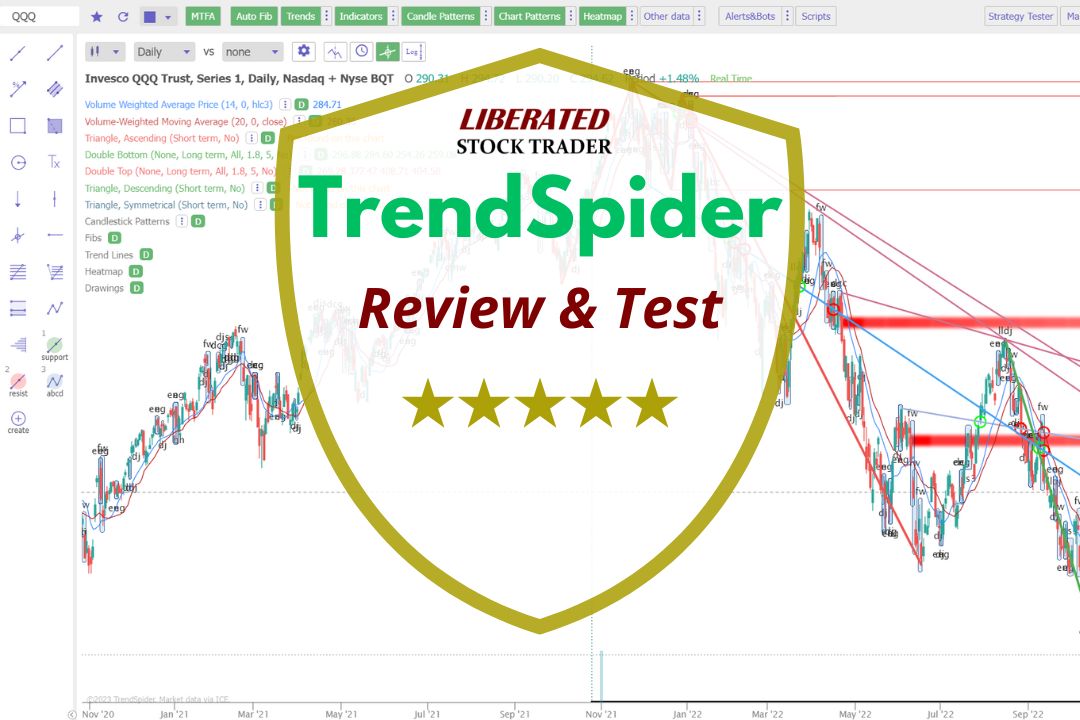
My testing awards Trendspider 4.8/5 stars due to its innovation. Its powerful algorithms recognize trendlines, chart patterns, and candlesticks automatically. It also has automated trading bots, real AI LLMs, and powerful point-and-click back- testing.| Liberated Stock Trader
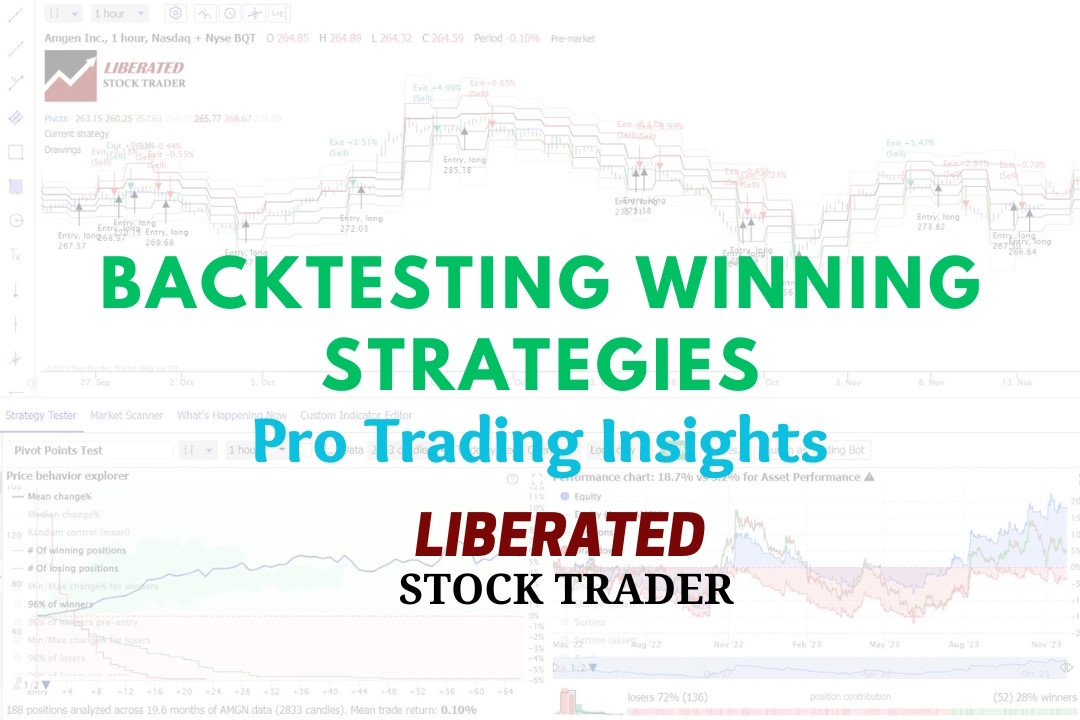
Experienced investors backtest their trading strategies to optimize their portfolios. Backtesting is a critical step that enables traders to assess the potential viability of a trading strategy by applying it to historical data.| Liberated Stock Trader
In technical analysis, momentum indicators help traders identify the strength and direction of a stock's price. We explain and test three popular momentum indicators for reliability.| Liberated Stock Trader