
Detektor: Nye Borgerlige står til både 0,9 og 6,3 procent. Forvirret? Så læs med her | Folketingsvalg 2022 | DR
De næste uger vil vi blive bombarderet med meningsmålinger. Men kan vi stole på dem?| DR
De næste uger vil vi blive bombarderet med meningsmålinger. Men kan vi stole på dem?| DR
There are good reasons to think carefully about the y-axis when you design figures, including considerations on whether to start your y-axis at zero or not. In this post, I provide a simple piece of advice: when presenting bar charts on a linear scale, start at 0. Not 0.38. Not 0.31. Not 0.04. 0.| Erik Gahner Larsen
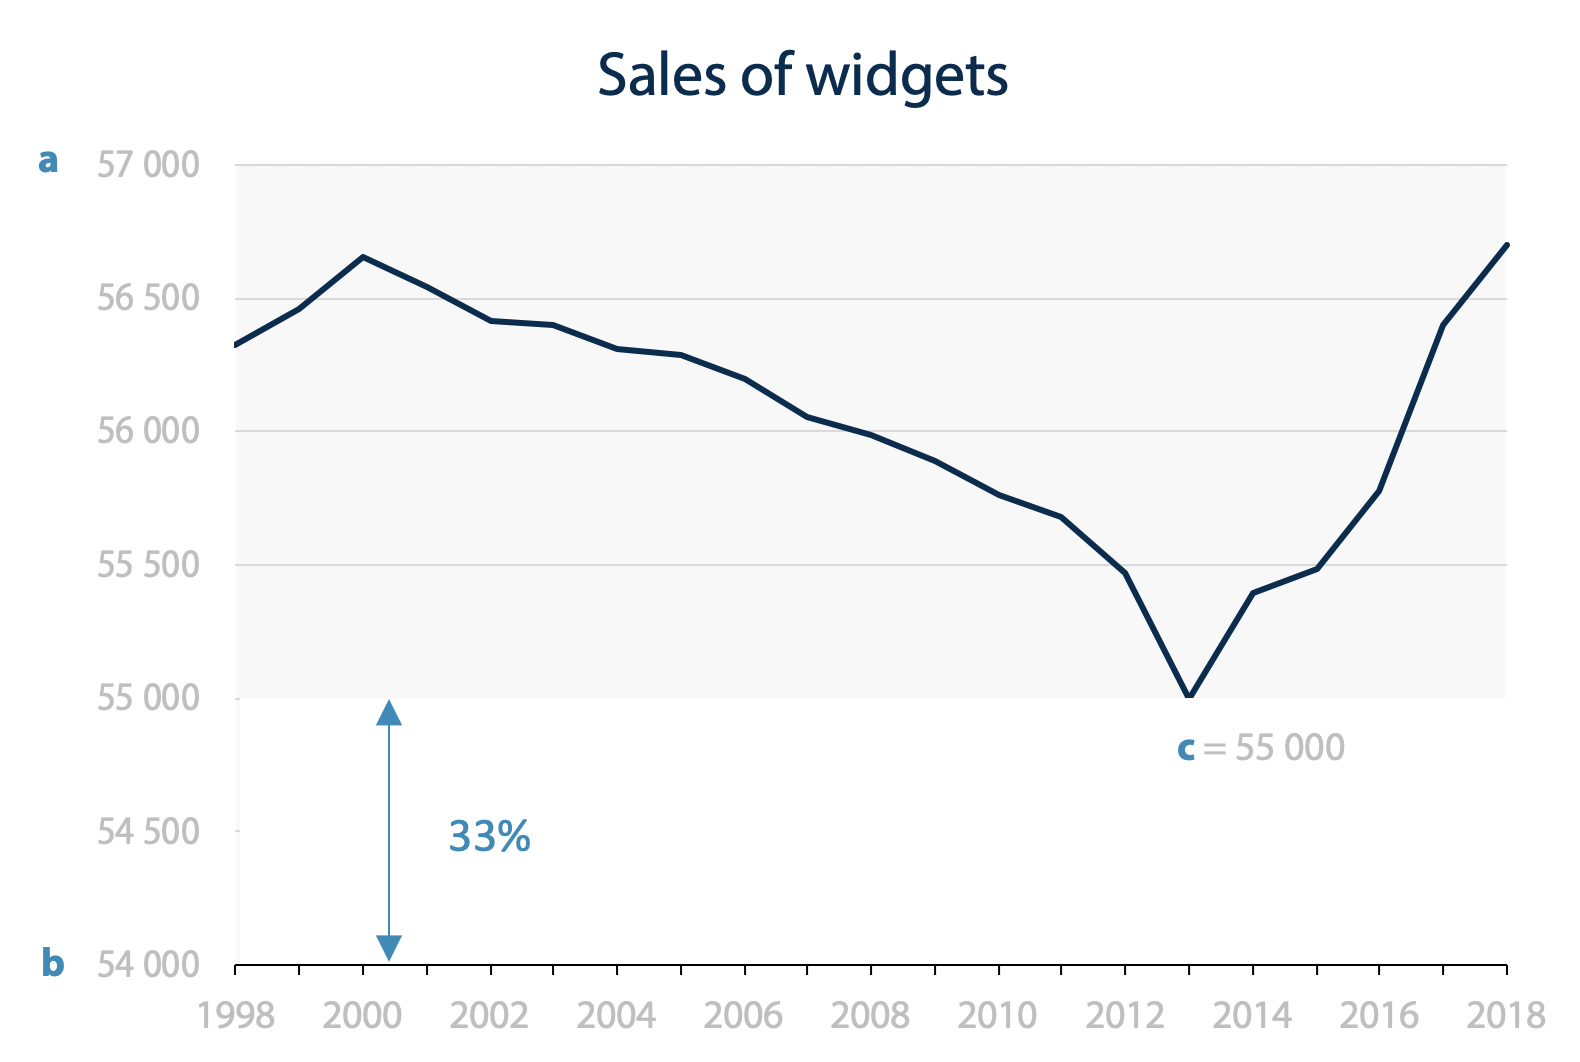
While we hold that bar charts should start at zero, there is no such expectation for line charts. But you’ll always find someone on social media to denounce a “dishonest” line chart that enhances the variations by truncating the y-axis. There is usually ample pushback, but it often leads to the question: Where should it […]| Voilà:
