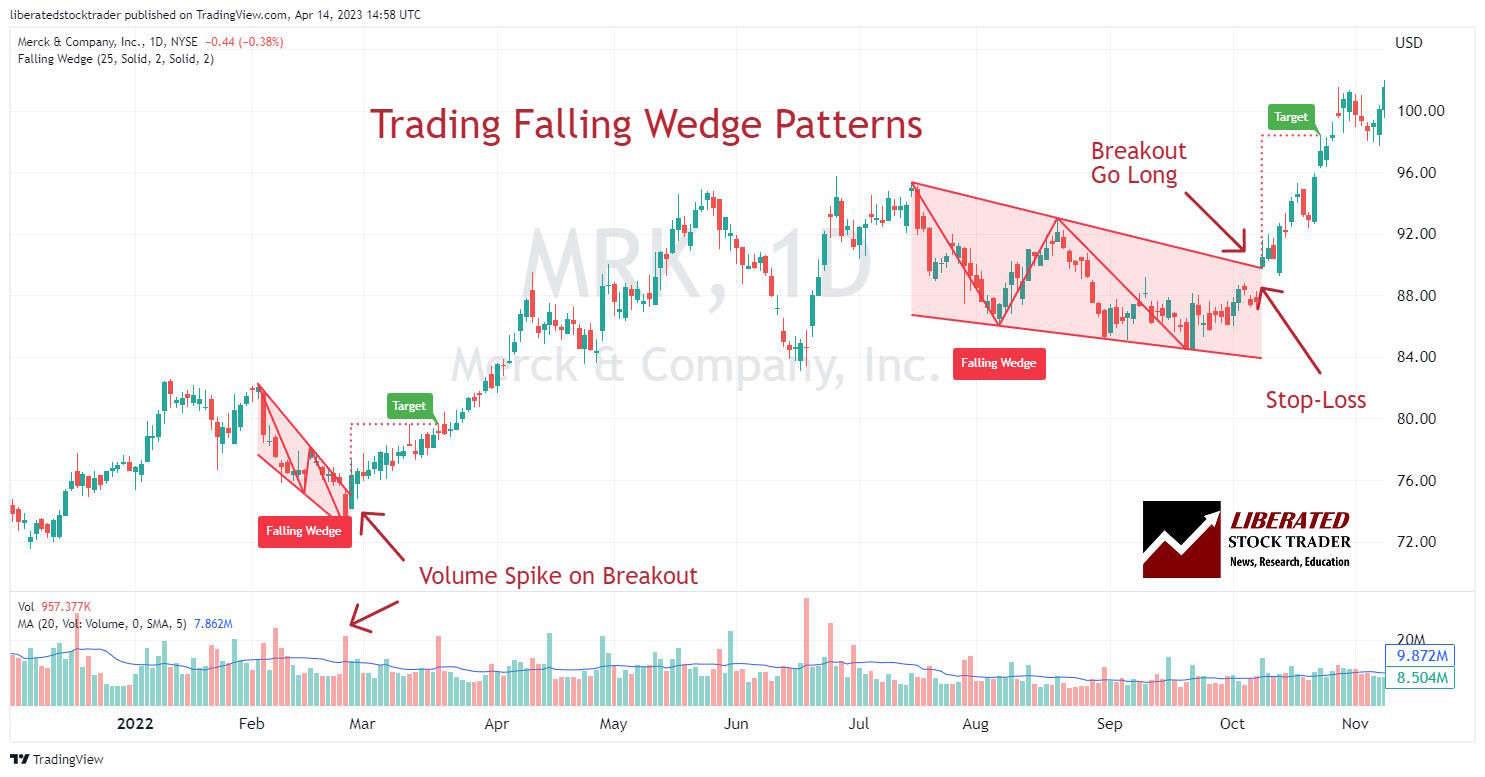
Trading a Falling Wedge for a 74% Success Rate and 38% Profit!
According to published research, the falling wedge pattern has a 74% success rate in bull markets with an average potential profit of +38%.| Liberated Stock Trader
According to published research, the falling wedge pattern has a 74% success rate in bull markets with an average potential profit of +38%.| Liberated Stock Trader
I conducted 4,052 backtested trades using 307 years of exchange data to determine if the Supertrend is super! The Supertrend indicator is not profitable for swing traders using a standard daily candlestick/OHLC chart. It achieved a 43% win rate, with an average win of 7.8%.| Liberated Stock Trader

My test trades yielded a 1.77 reward-to-risk ratio, with an average winning trade of 8.5%. Across a large sample, an ATR-based strategy yielded a small gain per trade, but it lost more often than it won and experienced significant drawdowns.| Liberated Stock Trader
Using VWAP with a 14 setting on a daily Heikin Ashi chart is vastly superior to conventional OHLC charts. Using an OHLC chart, the strategy barely breaks even with a low-profit expectancy of 0.15. In contrast with a Heikin Ashi chart, the strategy is incredibly profitable, with a profit expectance of 0.83 and a reward-to-risk ratio of 3.03.| Liberated Stock Trader
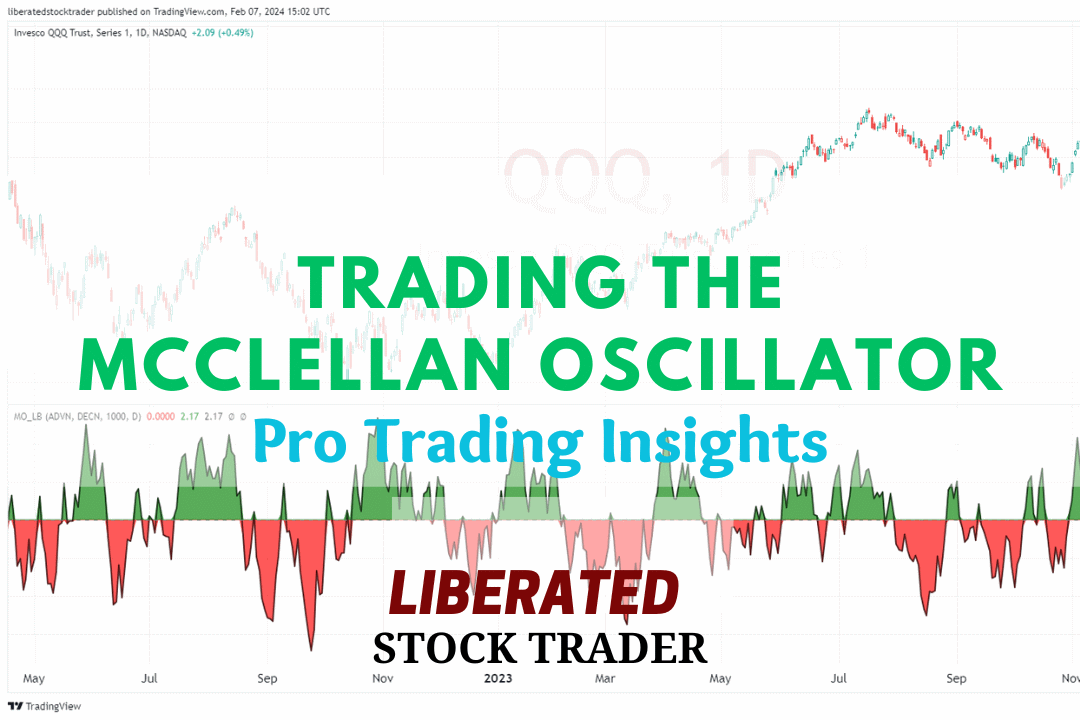
The McClellan Oscillator is a technical analysis tool designed to assess the market breadth of the New York Stock Exchange (NYSE). It is renowned for its effectiveness in revealing the underlying strength or weakness of the market by comparing the number of advancing to declining stocks.| Liberated Stock Trader

Stock volume measures the number of shares traded and indicates market strength. Rising markets with increasing volume are viewed as bullish, and falling prices on higher volume are bearish.| Liberated Stock Trader
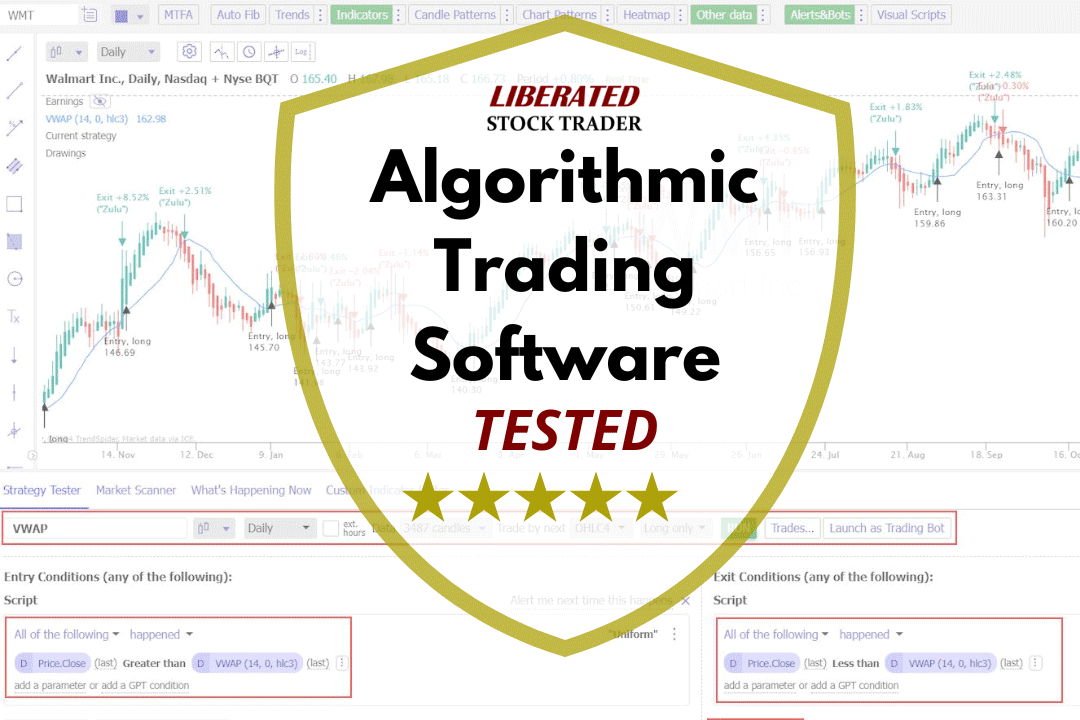
My testing shows that TrendSpider, Trade Ideas, TradingView, and Tickeron are the most effective software for creating, testing, and executing trading algorithms.| Liberated Stock Trader
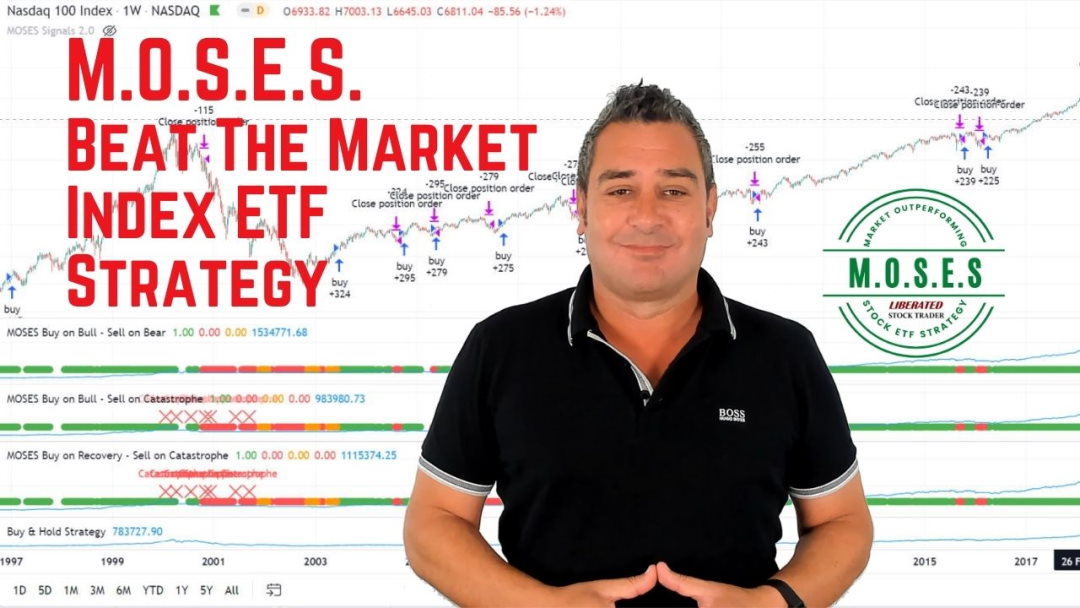
The MOSES ETF investing strategy is a powerful suite of indicators meticulously backtested over 100 years. Designed to empower you to outperform the market, it equips you with the tools to navigate major stock market crashes and unlock greater investing performance.| Liberated Stock Trader

I tested 23,487 RSI trades on 820 years of exchange data. When configured correctly, RSI can be highly profitable, with a 53% success rate and an average of 65% winning trades. The RSI setting of 14 on a 1-hour chart is the most reliable configuration for identifying profitable buy and sell signals.| Liberated Stock Trader

The best moving average settings are SMA or EMA 20 on a daily chart, which achieves a 23% win rate. At settings 50, 100, and 200, it is better to use the Hull moving average, which has win rates of 27%, 10%, and 17%, respectively.| Liberated Stock Trader
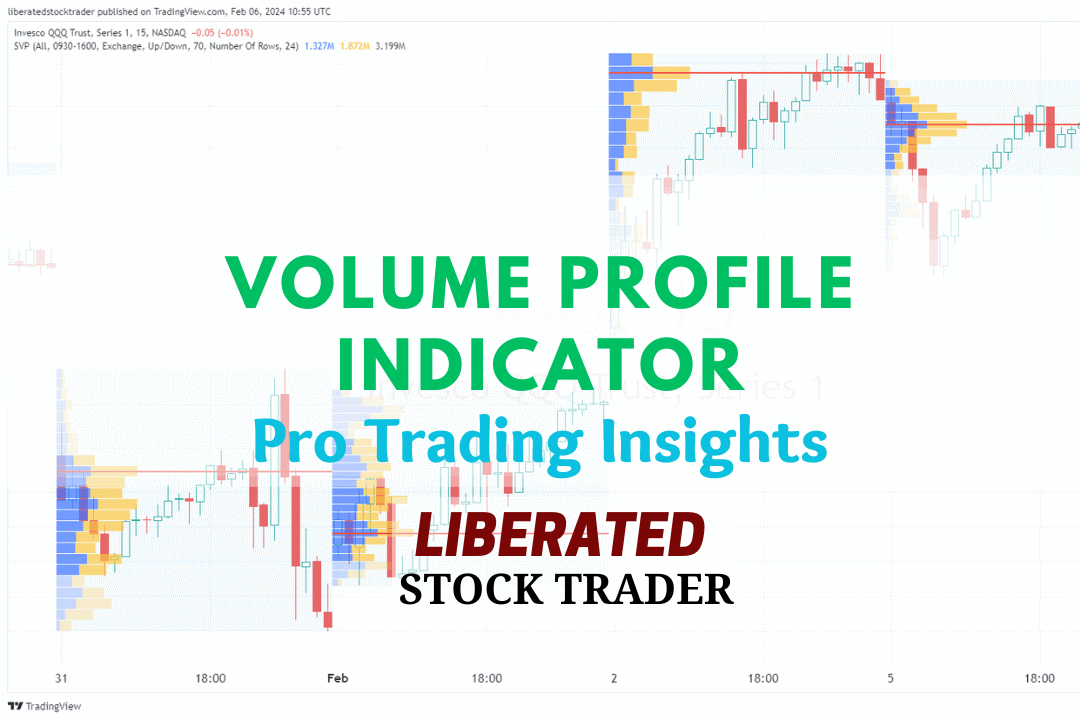
Volume profile technical analysis indicators provide a uniquely detailed overview of volume distribution across price levels, offering traders insights into market structure and supply and demand zones.| Liberated Stock Trader

Our research on 10,400 years of exchange data shows the best day trading indicators are the Price Rate of Change, VWAP, Weighted Moving Average, Hull Moving Average, Simple Moving Average, and RSI.| Liberated Stock Trader
In technical analysis, momentum indicators help traders identify the strength and direction of a stock's price. We explain and test three popular momentum indicators for reliability.| Liberated Stock Trader
