
Video Guide: Profitable Stock Chart Patterns for Traders
Research indicates that the most reliable and profitable stock chart patterns include the inverse head and shoulders, double bottom, triple bottom, and| Liberated Stock Trader
Research indicates that the most reliable and profitable stock chart patterns include the inverse head and shoulders, double bottom, triple bottom, and| Liberated Stock Trader

Renko charts filter out unnecessary price fluctuations to provide a clear stock price trend that traders can use in their investing strategies.| Liberated Stock Trader

Trendlines are a visual representation of the trend direction in the stock market. They are formed by connecting two or more significant highs or lows on a stock chart, creating a diagonal line that indicates the general trend of the asset's price movement.| Liberated Stock Trader
A sell signal gives traders a heads-up on when to consider closing positions, helping them lock in gains or cut losses using actual triggers, not just hunches.| Liberated Stock Trader

Price action trading is a method of day trading that relies on technical analysis but ignores conventional fundamental indicators, focusing instead on the movement of prices.| Liberated Stock Trader
Swing Trading and Day Trading differ in the timeframe, strategy, tools, and leverage. Day traders trade intraday using leverage; swing traders hold positions for days or weeks. Swing traders use real-time news, patterns, and indicators to make decisions, whereas day traders typically look for volatility to enable price scalping.| Liberated Stock Trader
My research indicates that the most effective chart types for traders are Heikin-Ashi, Candlestick, OHLC, Raindrop, and Renko charts. These charts provide the optimal balance of price and trend reversal information to help investors develop effective trading strategies.| Liberated Stock Trader

A buy signal is essentially an indicator or event that suggests it may be a good time to purchase a particular stock, whether based on technical data, chart patterns, or intrinsic value.| Liberated Stock Trader
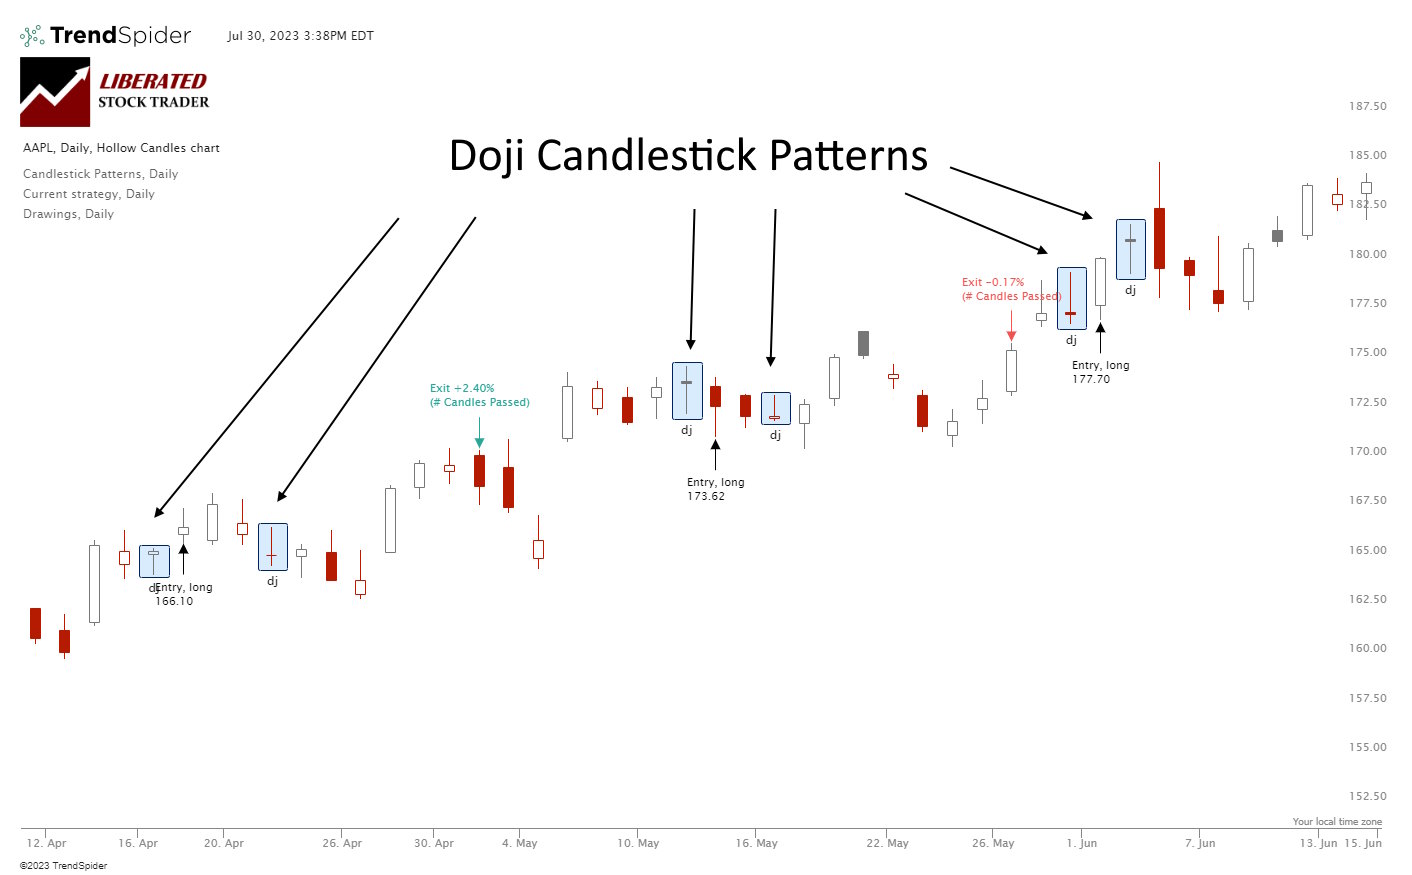
A Doji candlestick chart pattern indicates a battle between buyers and sellers, ending in equilibrium. The Doji marks a potential trend reversal. Is the Doji pattern profitable or accurate? Our evidence suggests its profitability is marginal.| Liberated Stock Trader

The best moving average settings are SMA or EMA 20 on a daily chart, which achieves a 23% win rate. At settings 50, 100, and 200, it is better to use the Hull moving average, which has win rates of 27%, 10%, and 17%, respectively.| Liberated Stock Trader
In technical analysis, momentum indicators help traders identify the strength and direction of a stock's price. We explain and test three popular momentum indicators for reliability.| Liberated Stock Trader
