
Apple Inc Financial Statements – NASDAQ:AAPL – TradingView
Get an overview of Apple Inc financials with all the important metrics. View AAPL market cap, dividends, revenue breakdown, and more on one page.| TradingView
Get an overview of Apple Inc financials with all the important metrics. View AAPL market cap, dividends, revenue breakdown, and more on one page.| TradingView

█ OVERVIEW This indicator displays the Commitment of Traders (COT) financial data for futures markets. █ CONCEPTS Commitment of Traders (COT) data is tallied by the Commodity Futures Trading Commission (CFTC), a US federal agency that oversees the trading of derivative markets such as futures in the US. It is weekly data that provides traders with information about open interest for an asset. The CFTC oversees derivative markets traded on different exchanges, so COT dat...| TradingView

Trendlines are a visual representation of the trend direction in the stock market. They are formed by connecting two or more significant highs or lows on a stock chart, creating a diagonal line that indicates the general trend of the asset's price movement.| Liberated Stock Trader
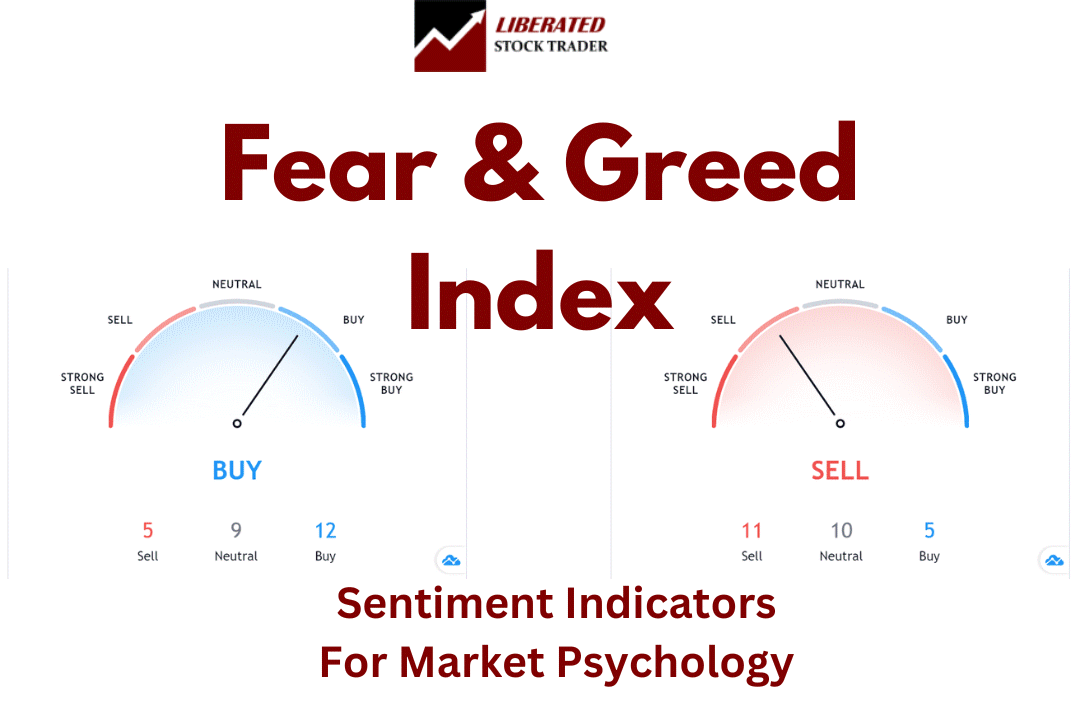
Successful traders use market sentiment to gain a competitive edge and improve their chances of making profitable trades.| Liberated Stock Trader

As a Professional market analyst, I build effective trading strategies using techniques such as indicator divergences, multi-time frame analysis, indicator combinations, and rigorous backtesting.| Liberated Stock Trader
The Futures Market is where individuals and institutions buy and sell contracts to deliver a commodity, currency, or security at an agreed-upon time. These contracts are standardized for quality, quantity, delivery dates, and settlement terms.| Liberated Stock Trader

Commodities are tangible goods such as food, metals, and energy that traders can buy or sell in the financial markets. These commodities are traded on global exchanges, and their prices fluctuate based on supply and demand.| Liberated Stock Trader

Decades of research have proven the most predictable bearish chart patterns are the inverted cup-and-handle, with an average price decrease of 17%, the rectangle top (-16%), head-and-shoulders (-16%), and the descending triangle (-15%).| Liberated Stock Trader
Our Fear and Greed Index goes beyond the basics, offering nine real-time and historical charts to help you stay ahead. With live data from the Federal Reserve, VIX CBOE, and 15 technical stock price signals, you'll have the tools to make smarter decisions today.| Liberated Stock Trader

Professional analysts define all stock market trends using timeframe and direction: Timeframes are short-term, medium-term, and long-term. Direction is described using uptrend, downtrend, or consolidation.| Liberated Stock Trader

I tested 23,487 RSI trades on 820 years of exchange data. When configured correctly, RSI can be highly profitable, with a 53% success rate and an average of 65% winning trades. The RSI setting of 14 on a 1-hour chart is the most reliable configuration for identifying profitable buy and sell signals.| Liberated Stock Trader

The best moving average settings are SMA or EMA 20 on a daily chart, which achieves a 23% win rate. At settings 50, 100, and 200, it is better to use the Hull moving average, which has win rates of 27%, 10%, and 17%, respectively.| Liberated Stock Trader
