
Variance Definition | DeepAI
In short, variance is the measurement of the distance of a set of random numbers from their collective average value.| DeepAI
In short, variance is the measurement of the distance of a set of random numbers from their collective average value.| DeepAI

Standard deviation is the measure of dispersion, or how spread out values are, in a dataset.| DeepAI
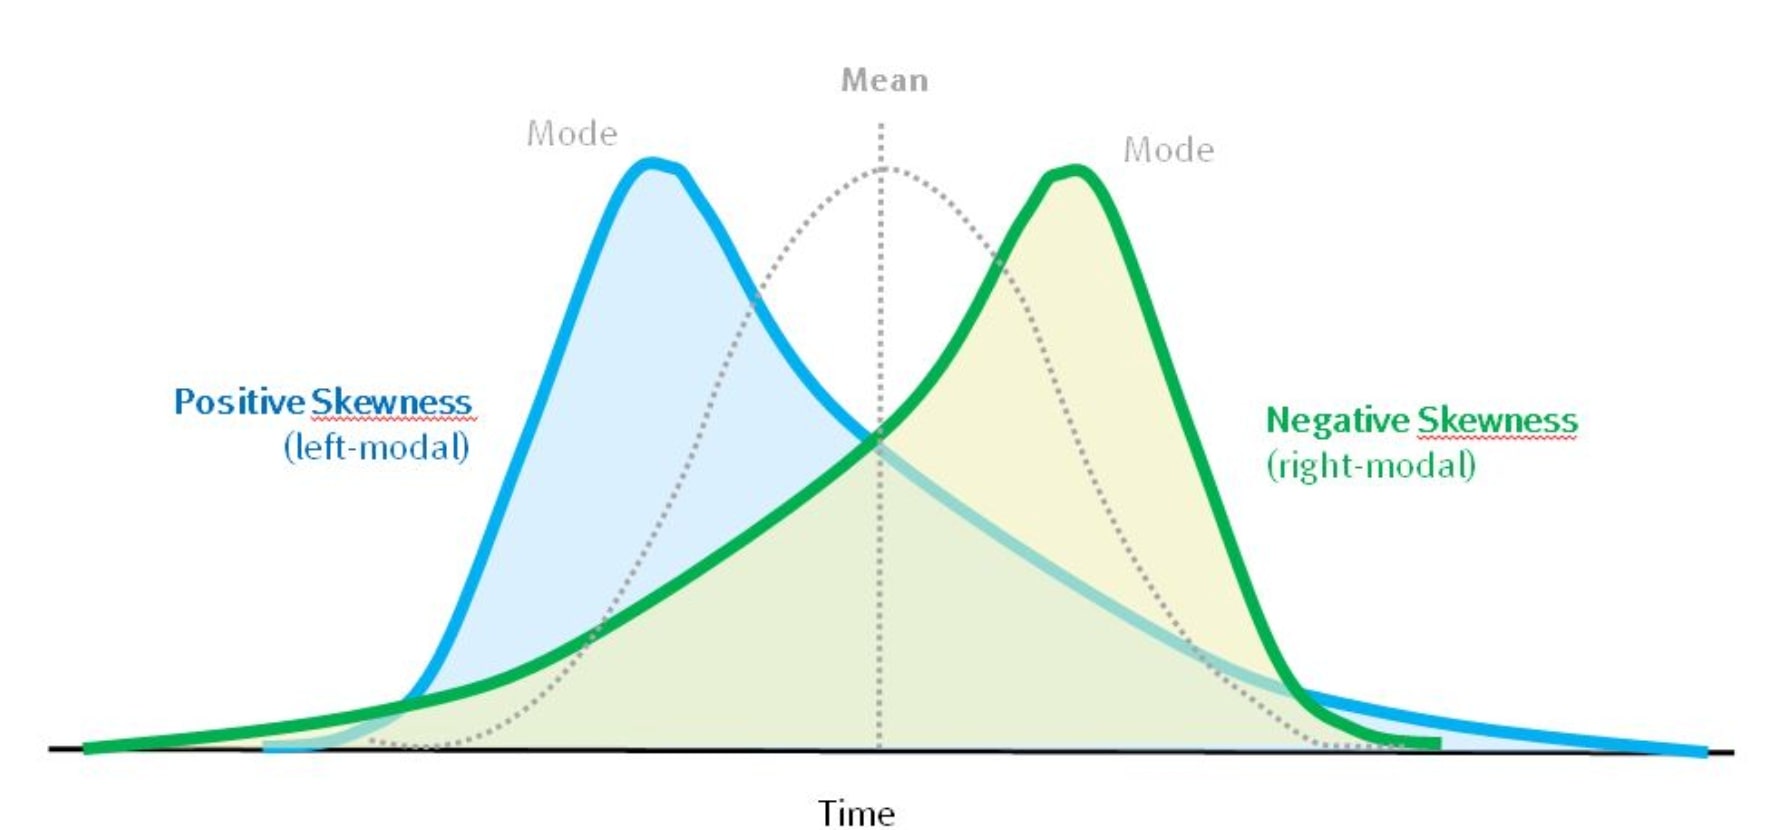
Skewness is a quantifiable measure of how distorted a data sample is from the normal distribution.| DeepAI

A Random Variable is defined as a variable whose possible values are outcomes of a random phenomenon.| DeepAI
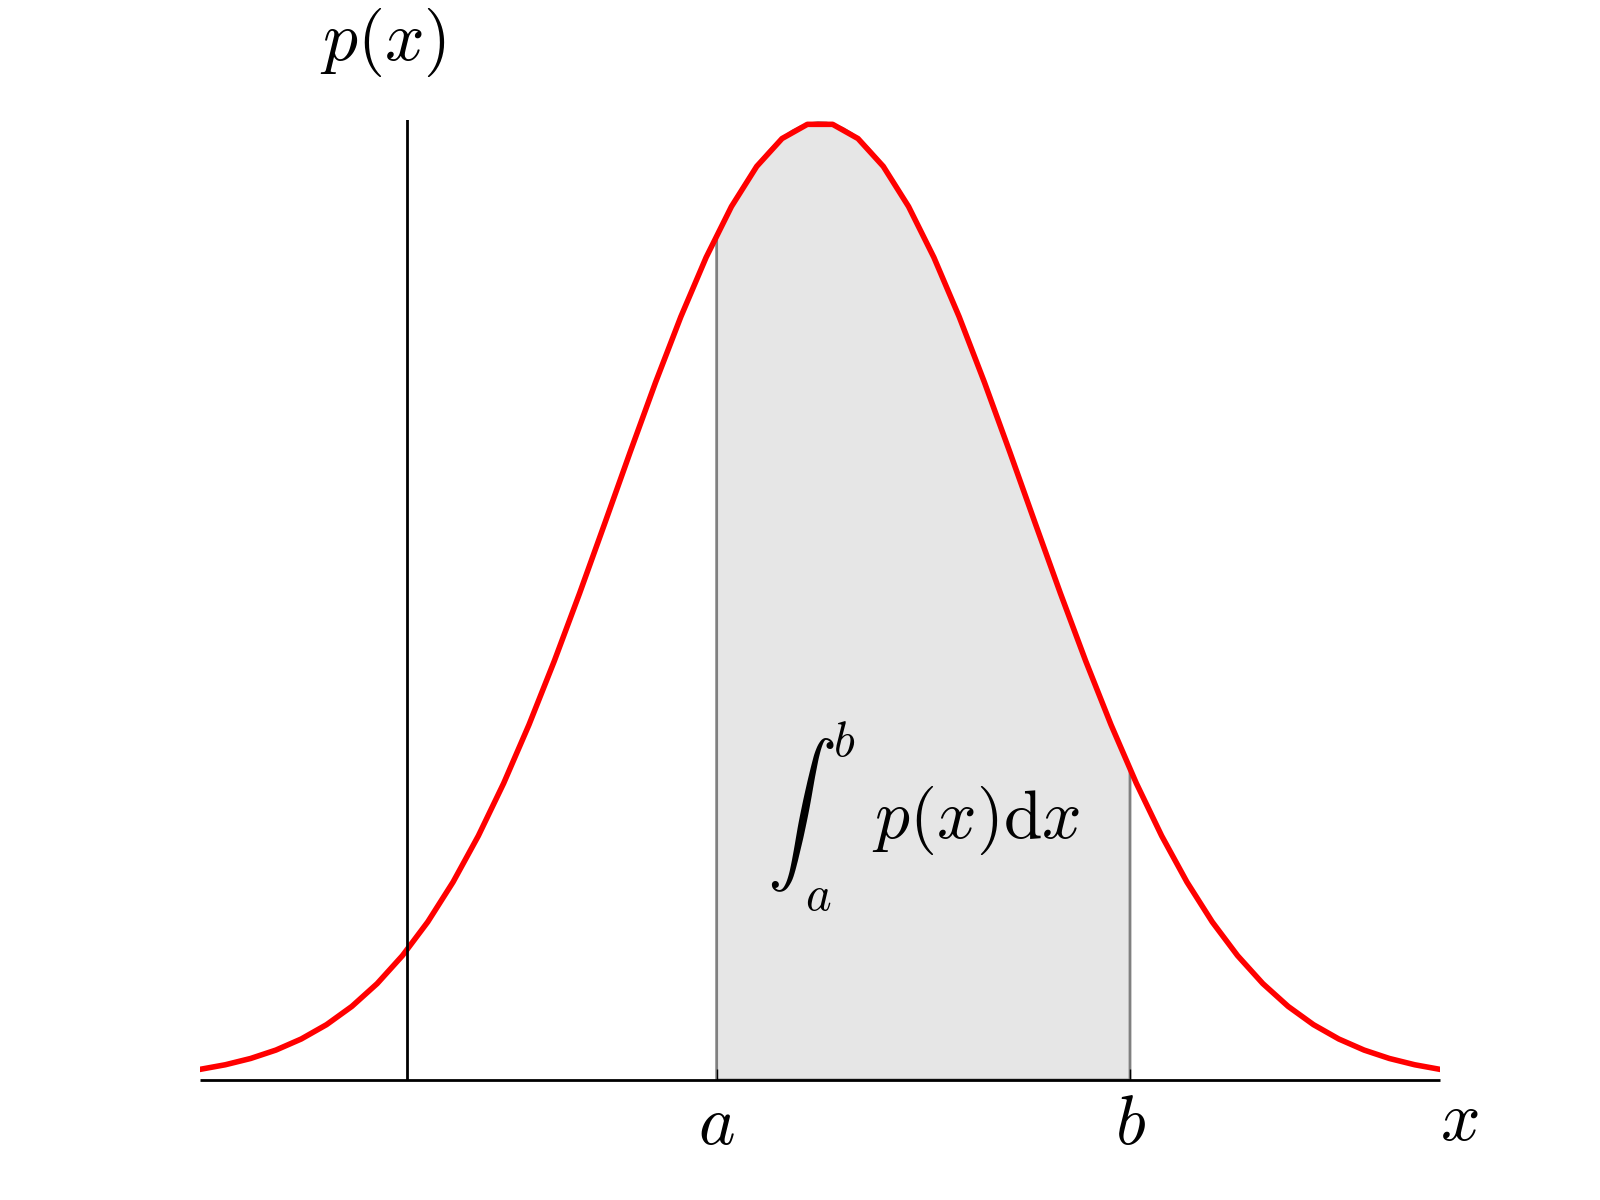
A Probability Density Function is a statistical expression used in probability theory as a way of representing the range of possible values of a continuous random variable. The area under the curve represents the interval of which a continuous random variable will fall, and the total area of the interval represents the probability that the variable will occur.| DeepAI
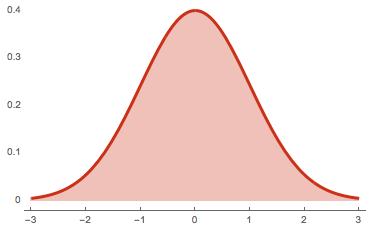
The normal distribution is the most important and most widely used distribution in statistics. It is sometimes called the bell curve or Gaussian distribution, because it has a peculiar shape of a bell. Mostly, a binomial distribution is similar to normal distribution. The difference between the two is normal distribution is continuous.| DeepAI

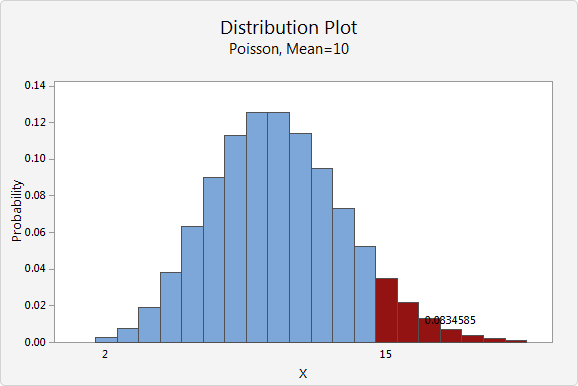
The exponential distribution, also known as the negative exponential distribution, is a probability distribution that describes time between events in a Poisson process.| DeepAI

Probability Theory describes probabilities in terms of a probability space, typically assigning a value between 0 and 1, known as the probability measure, and a set of outcomes known as the sample space.| DeepAI
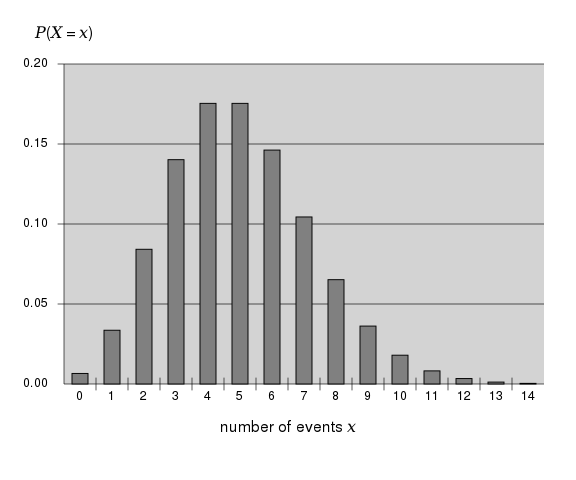
A Probability Distribution is the sum of the probabilities of the events occurring. There are two distinct types of probability distributions, continuous and discrete.| DeepAI
Probability in deep learning is used to mimic human common sense by allowing a machine to interpret phenomena that it has no frame of reference for.| DeepAI
