How to Make a Scatter Plot in Google Sheets: Easy 2024 Guide
Find out how to make a scatter plot in Google Sheets here with this simple to follow step-by-step guide with screenshots.| Spreadsheet Point
Find out how to make a scatter plot in Google Sheets here with this simple to follow step-by-step guide with screenshots.| Spreadsheet Point

Learn how to make a bar graph in Google Sheets. We cover every type of bar chart you can make and you can go through the entire guide in under 10 minutes!| Spreadsheet Point
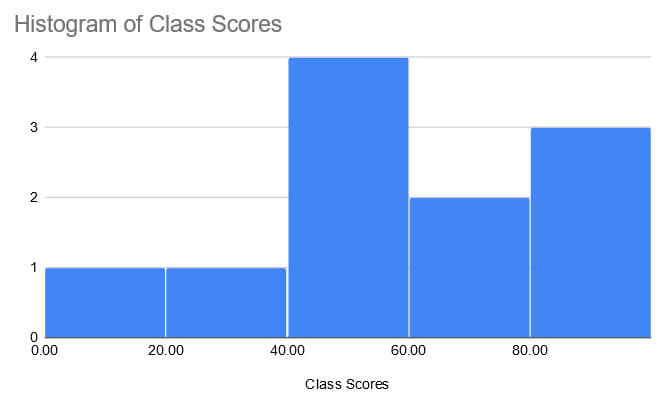
A Histogram will help you to visualize your data and make itmore digestible. This guide breaks down how to make a histogram in Google Sheets into an easy steps.| Spreadsheet Point

Learn how to fill empty cells with 0 in Google Sheets. This guide shows three methods, including how to replace empty cells with a formula.| Spreadsheet Point

In this tutorial, learn how to quickly add error bars in Google Sheets. You can easily ass these to columns charts, line charts, or area charts| Spreadsheet Point

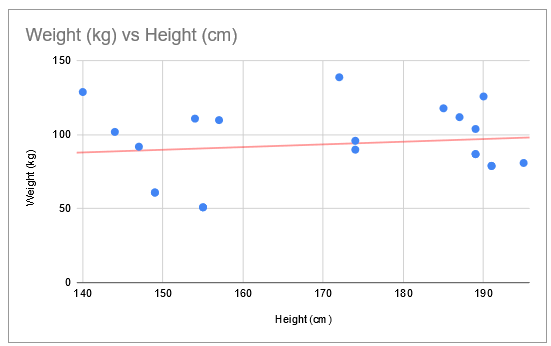
Scatter plots are hard to interpret without a trend line. Find out how to add a line of best fit in Google Sheets to make your data more readable.| Spreadsheet Point

Excel has replaced the original tracking feature with co-authoring. This guide will show you exactly how to get the track changes in Excel feature back.| Spreadsheet Point
