53 Years of Data Reveal Best Month for Stocks
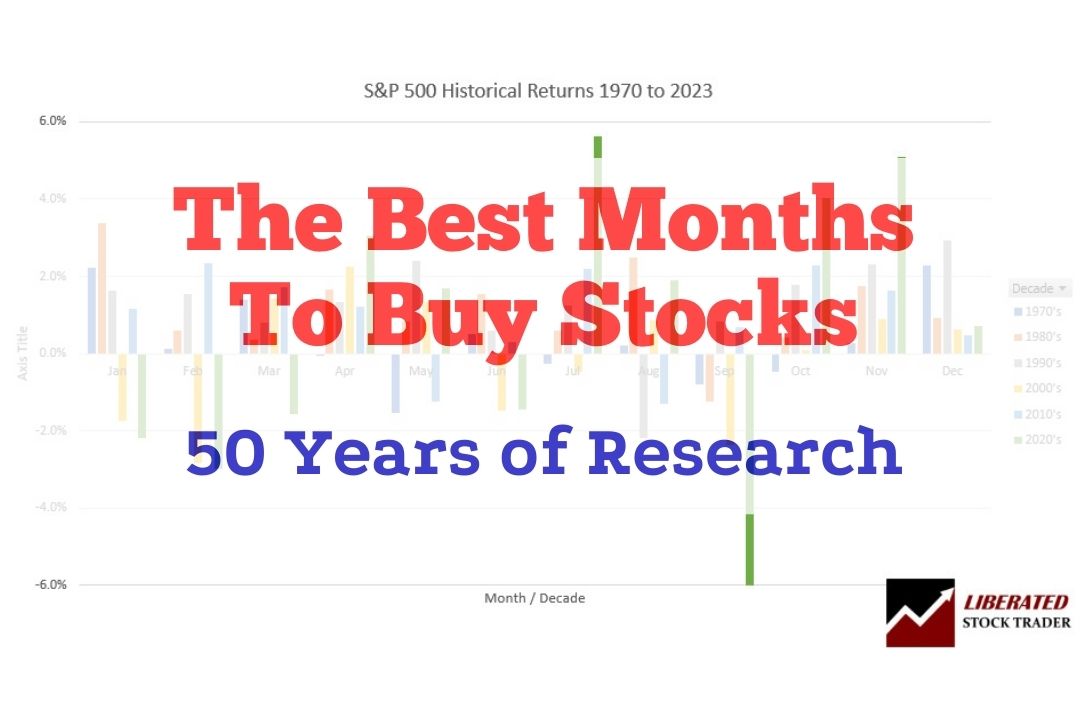
According to our research, using 53 years of stock exchange data, the best time to buy stocks is in October, and the best time to sell stocks is in July.| Liberated Stock Trader
According to our research, using 53 years of stock exchange data, the best time to buy stocks is in October, and the best time to sell stocks is in July.| Liberated Stock Trader

Our ultimate guide to technical analysis, with its 14 videos and detailed examples covering charts, trends, indicators, patterns, and tools, will fast-track your knowledge.| Liberated Stock Trader

Macroeconomic or systemic changes within the broader economy influence a cyclical stock's price. These stocks are renowned for mirroring the economic cycles through the growth, boom, bust, and recovery phases.| Liberated Stock Trader

There are two types of continuation patterns: bullish and bearish. Bullish continuation patterns occur when the market is trending upwards, while bearish continuation patterns happen when the market is trending downwards.| Liberated Stock Trader

Research shows that the most reliable chart patterns are the Head and Shoulders, with an 89% success rate, the Double Bottom (88%), and the Triple Bottom and Descending Triangle (87%). The Rectangle Top is the most profitable, with an average win of 51%, followed by the Rectangle Bottom with 48%.| Liberated Stock Trader
