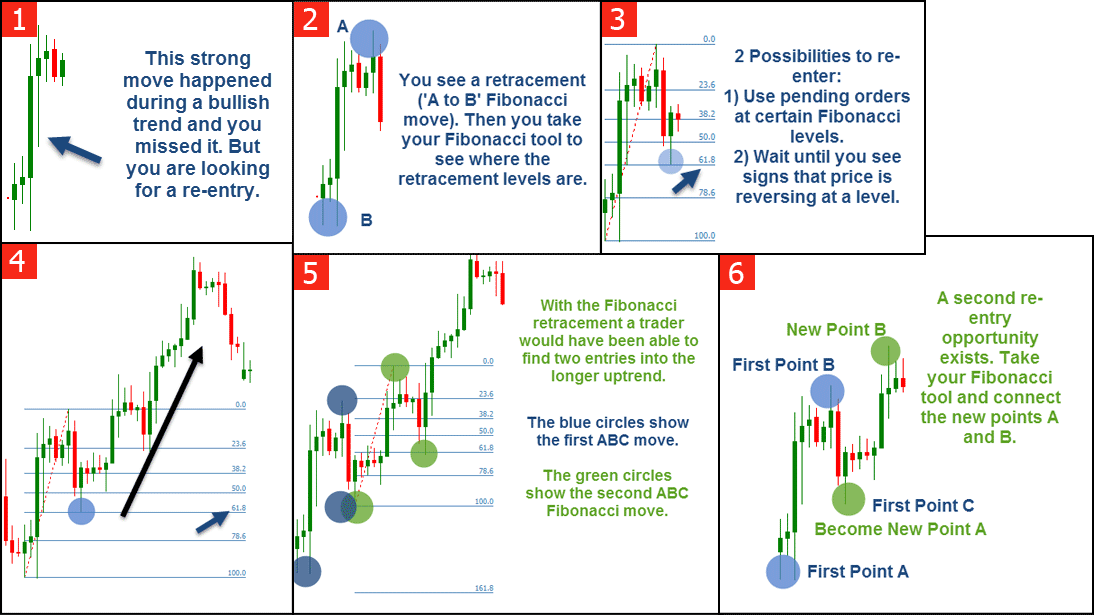
The Fibonacci tool is very popular amongst traders and for good reasons. The Fibonacci is a universal trading concept that can be applied to all timeframes and markets. There are also countless Fibonacci tools from spirals, retracements, Fib time zones, Fib speed resistance to extension. In this article, I will explain how to correctly draw […]| tradeciety.com
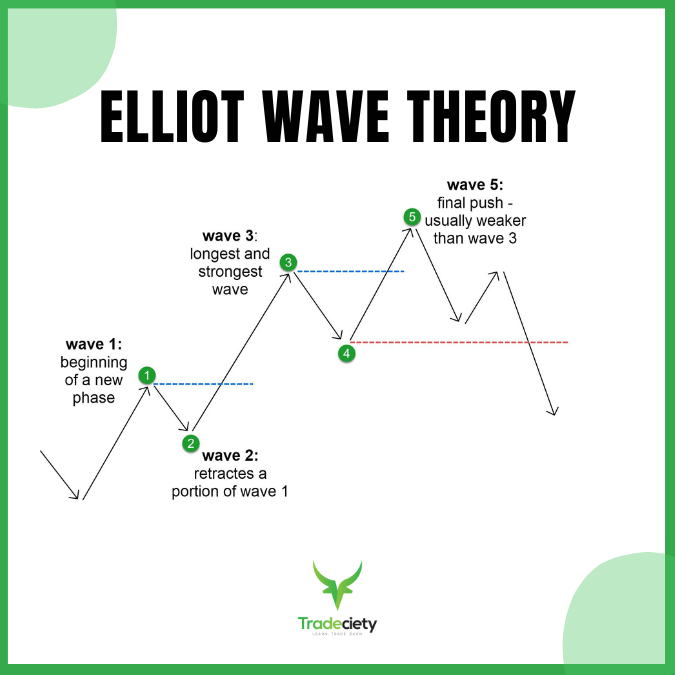
Learn how to apply Elliot Wave Theory in trading with our comprehensive guide. Discover the core principles, wave patterns, and advanced techniques for better market analysis.| tradeciety.com
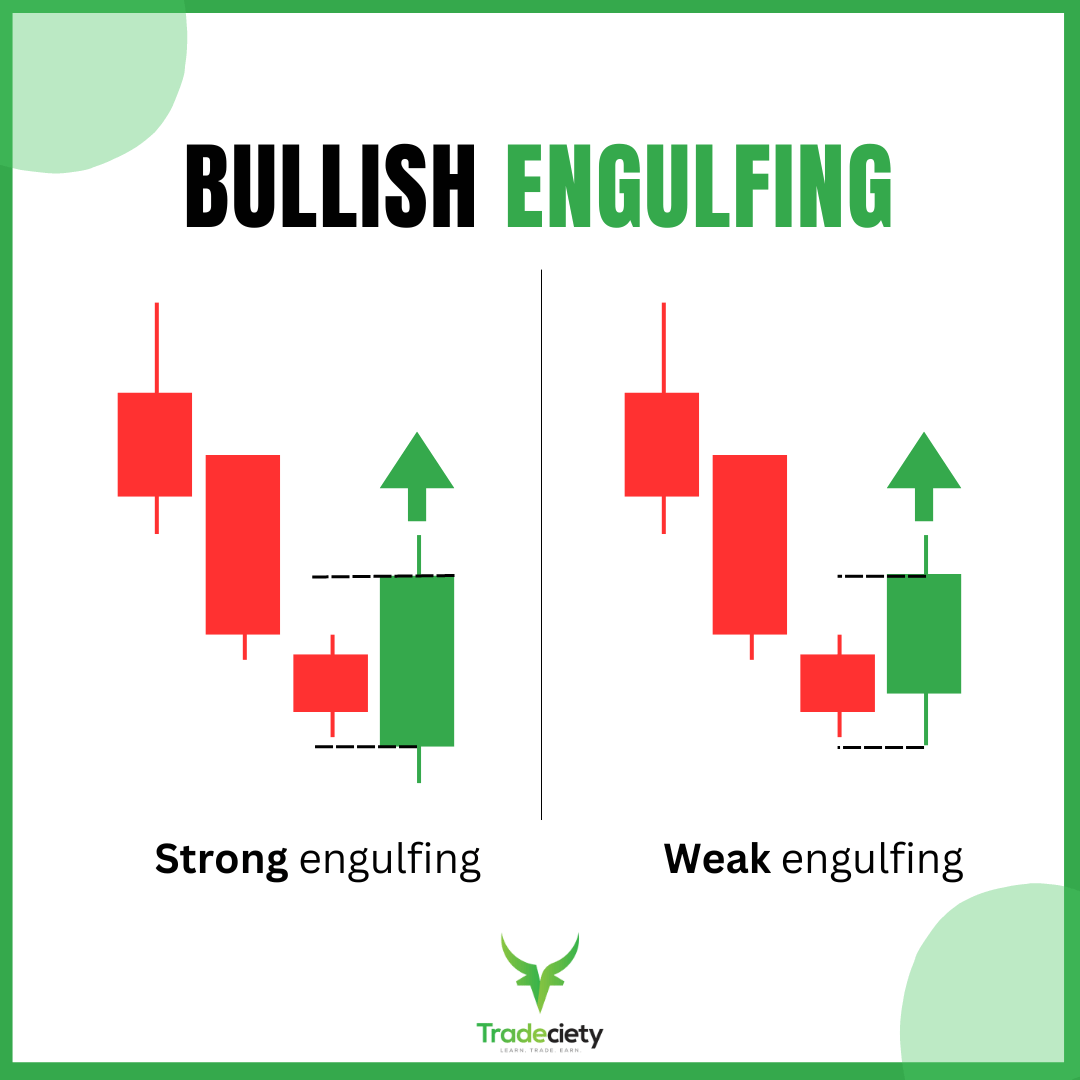
Master the powerful engulfing candlestick pattern to enhance your trading strategy. Learn how to identify and trade bullish and bearish engulfing candles effectively, with tips on key criteria for maximum success.| tradeciety.com
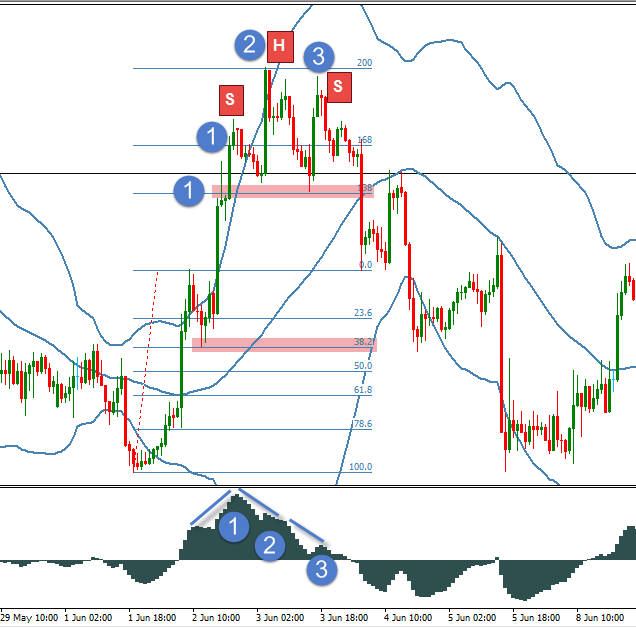
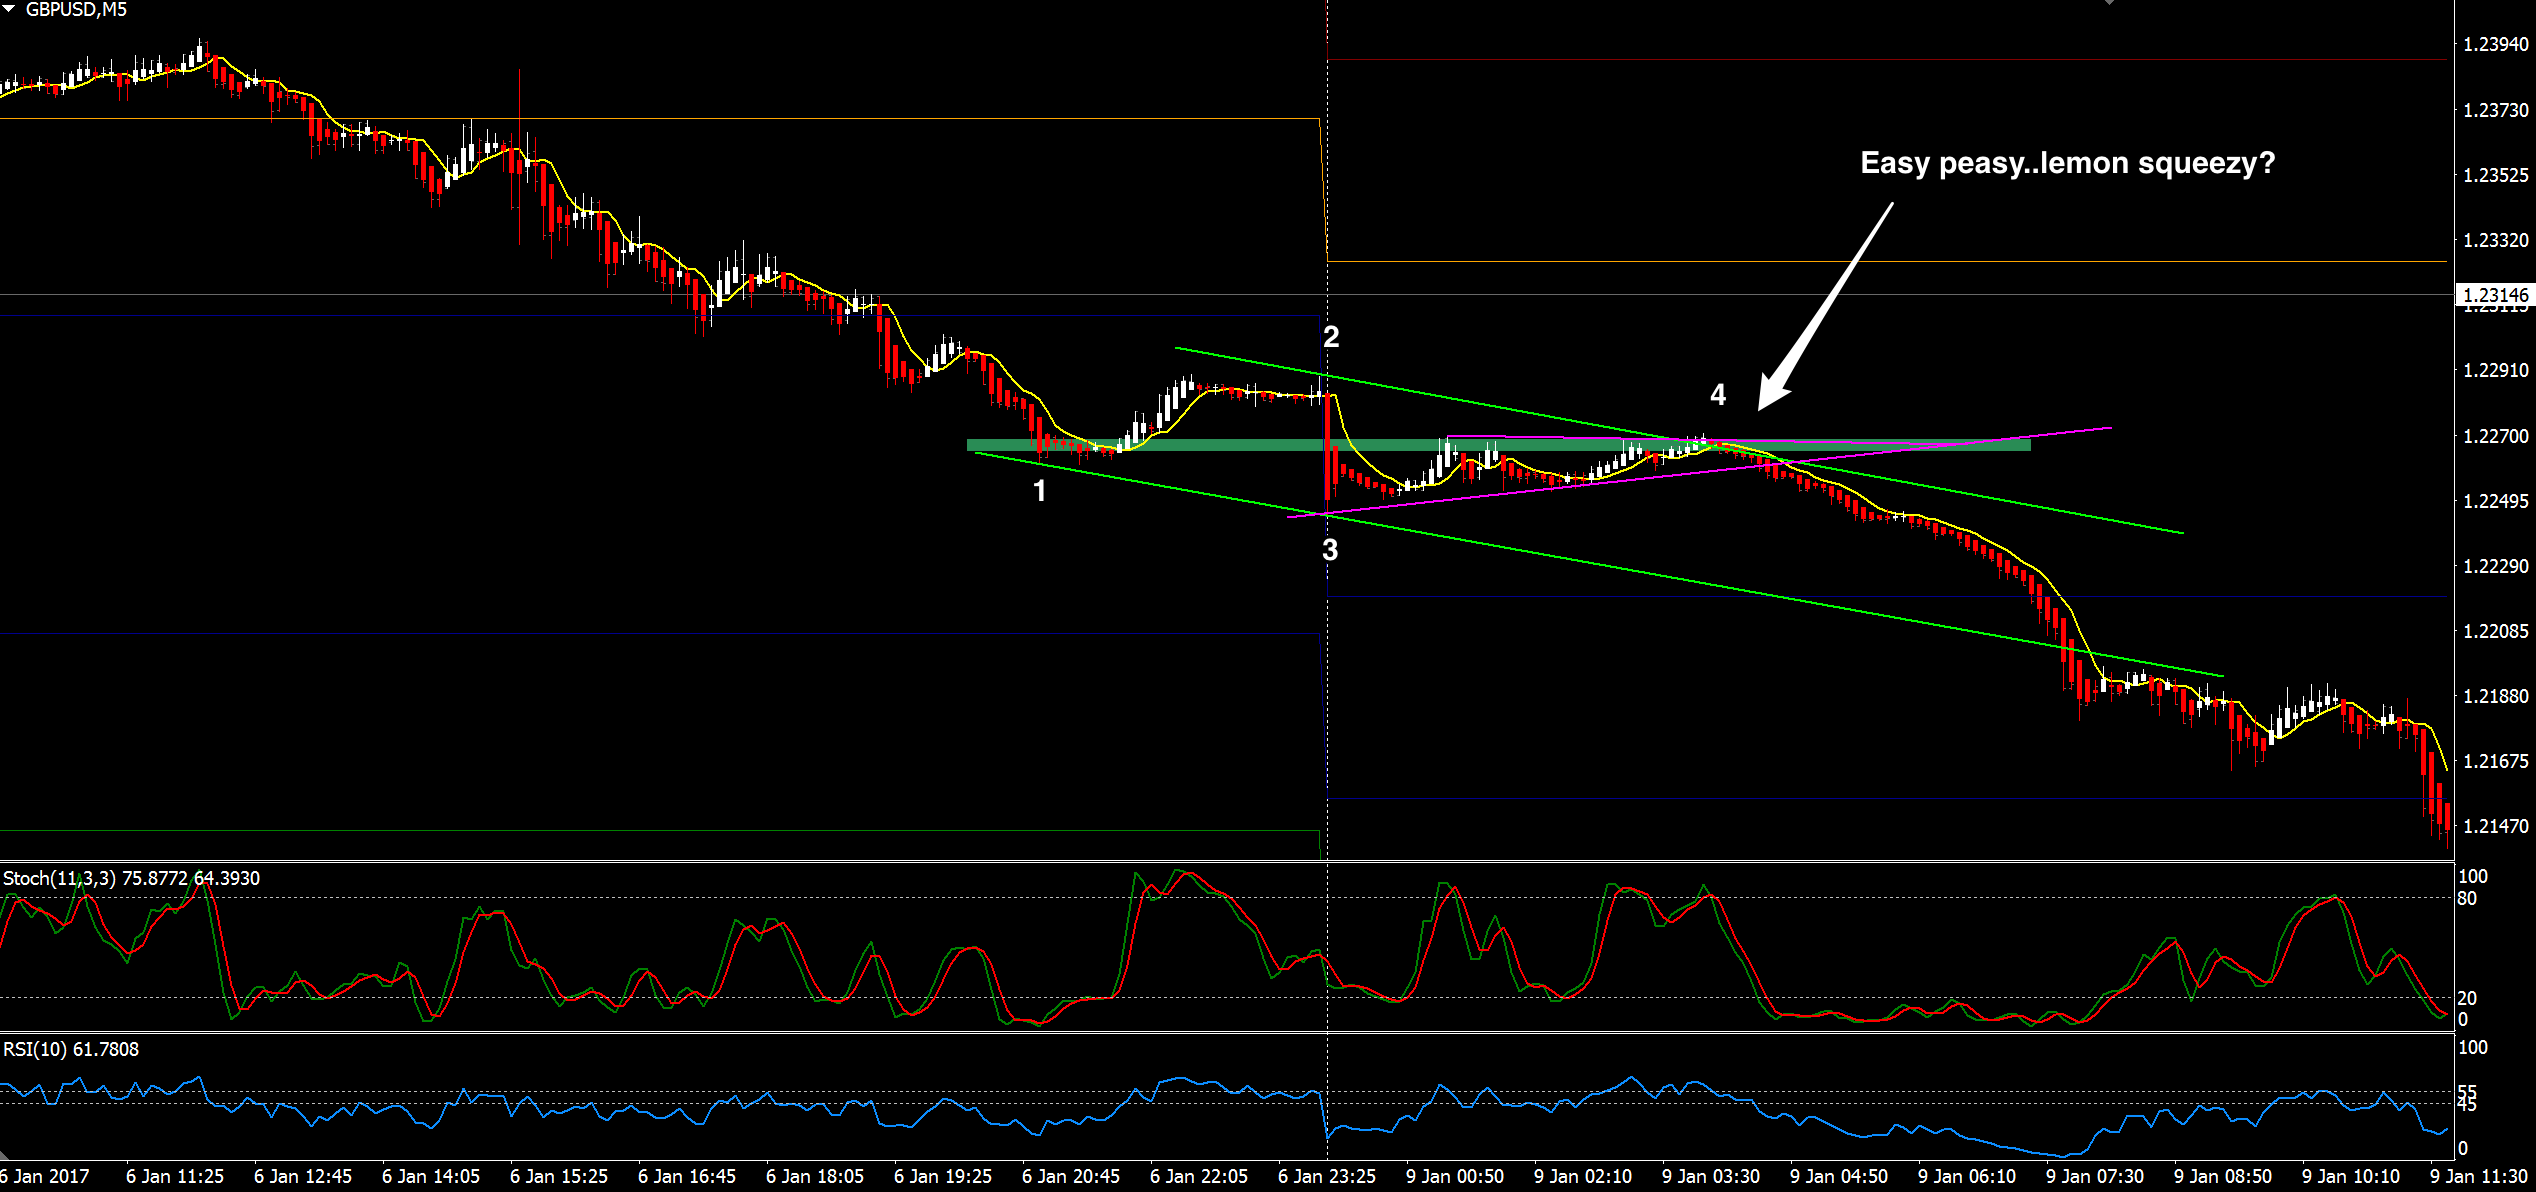
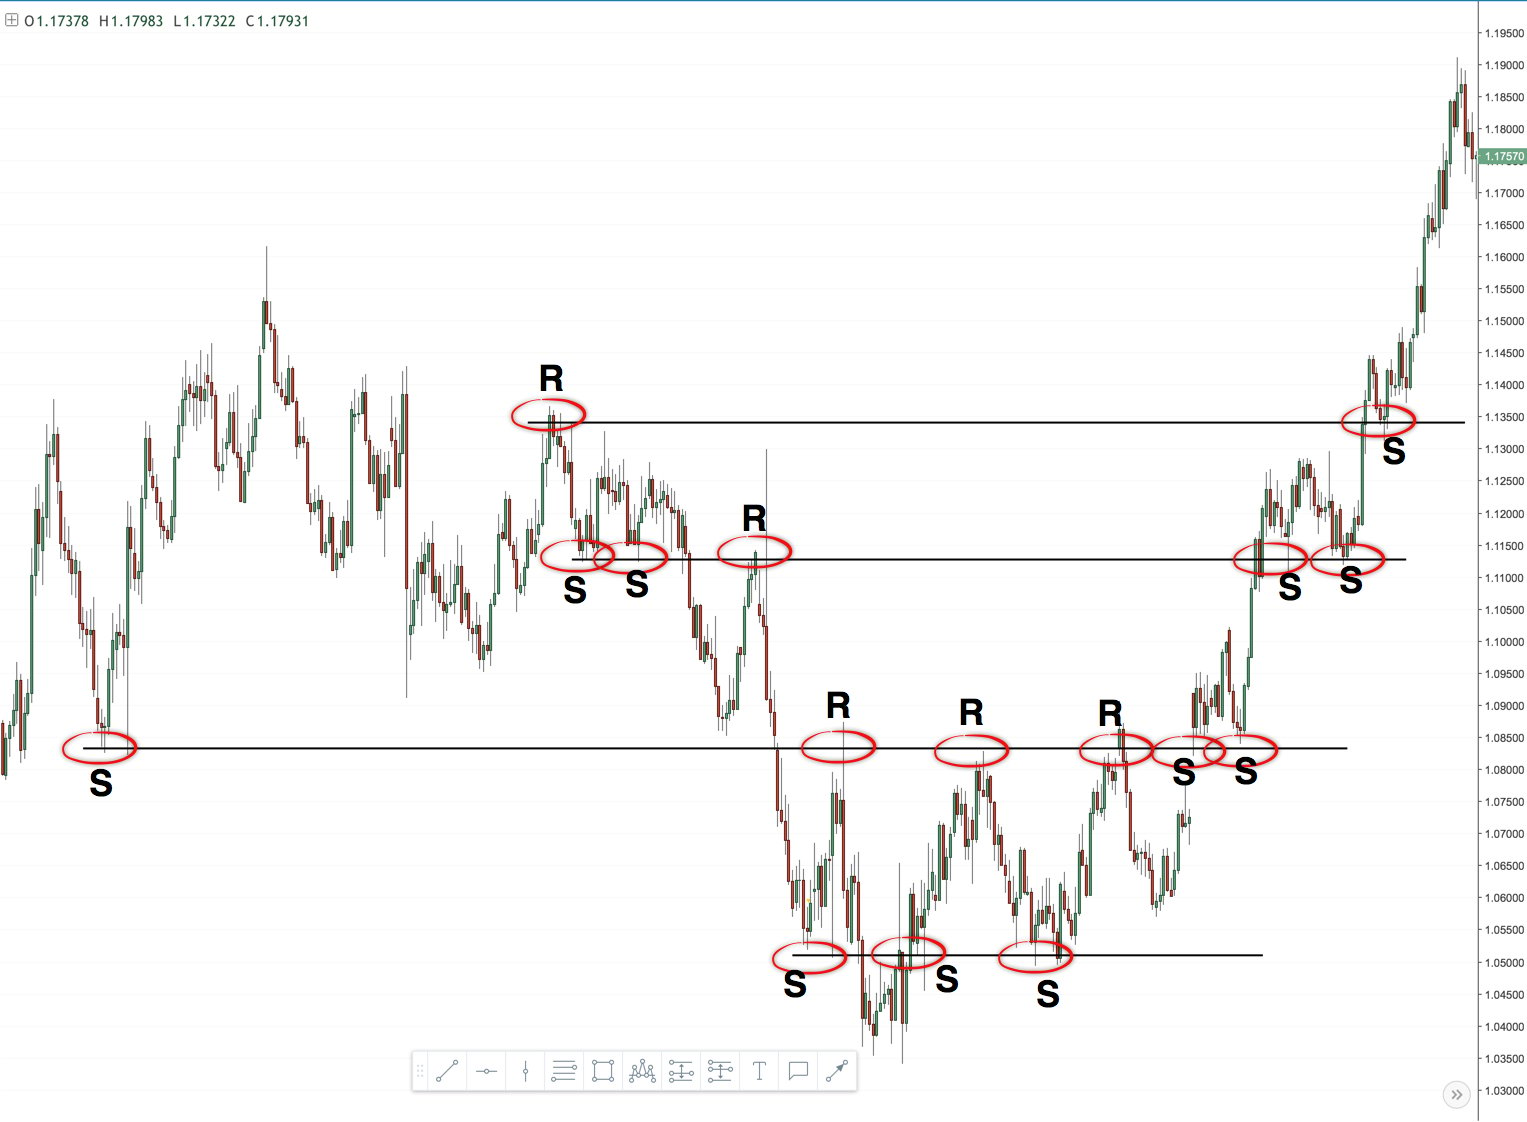
In the past weeks we have analyzed different indicators and trading tools. Now it’s time to combine what we have learned and apply it to the charts. In the following article we explore how to use confluence analysis to detect price targets, how to stay in trades longer and how to identify possible reversals. For […]| tradeciety.com
A pullback is not just a pullback. There are different kinds of pullbacks. They can all be classified into channels – expanding, condensing, symmetrical, their angle either against the trend or with the trend. Inside those channels, we get different opportunities to re-enter in the direction of the trend. We can play breakouts, bounces from […]| tradeciety.com
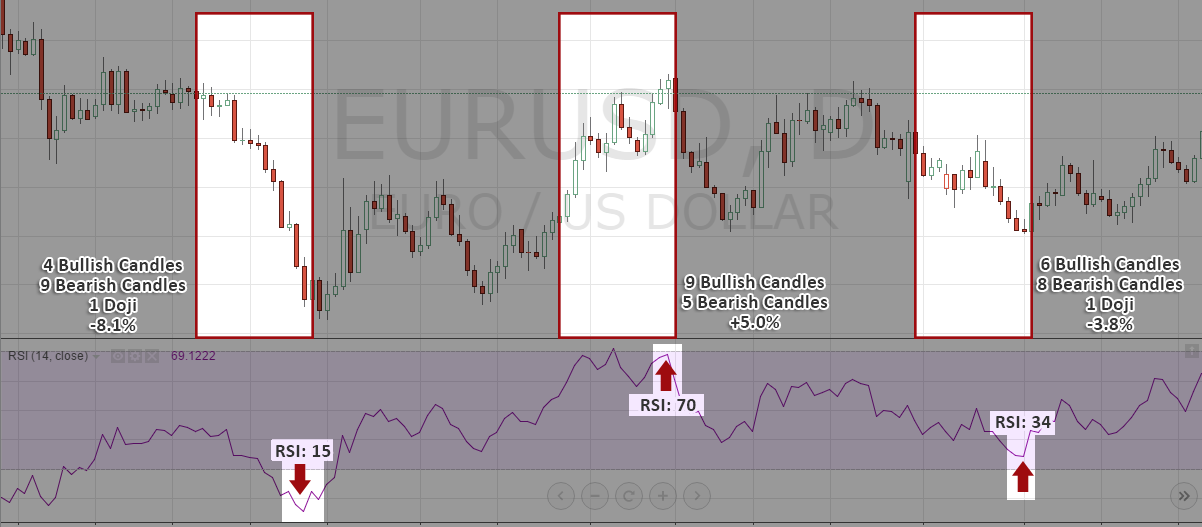
The RSI indicator is among the most popular indicators. We will learn what the RSI really does, how to understand the information it provides.| tradeciety.com