Ichimoku Cloud: I Tested 15,024 Trades, Shocking Results
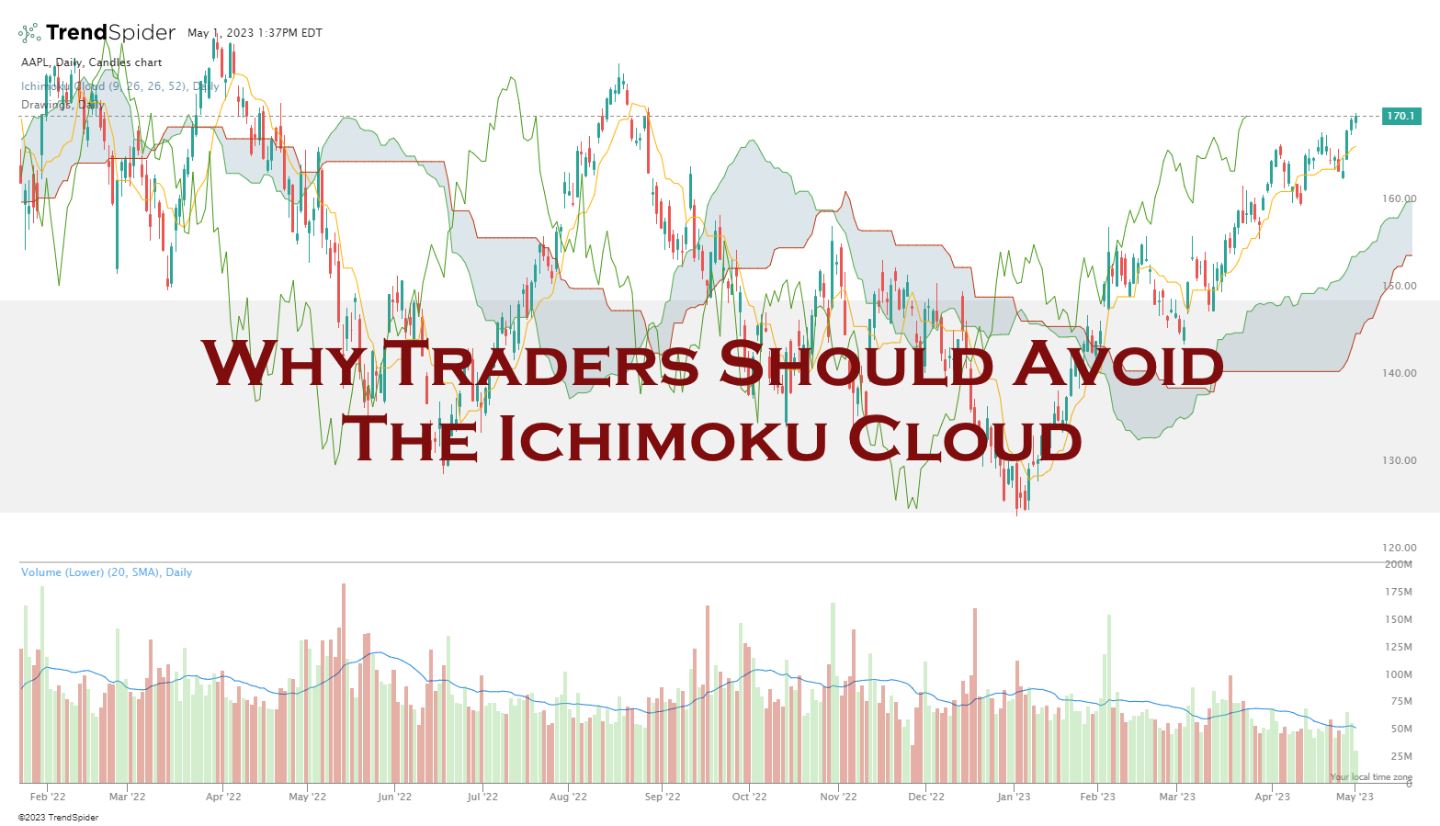
The Ichimoku test results are a dismal 10% win rate, underperforming a buy-and-hold strategy 90% of the time. The Ichimoku indicator is a poor choice for traders.| Liberated Stock Trader
The Ichimoku test results are a dismal 10% win rate, underperforming a buy-and-hold strategy 90% of the time. The Ichimoku indicator is a poor choice for traders.| Liberated Stock Trader

My testing shows the best TradingView indicators for advanced analysis are Volume Profile HD, VWAP, Supertrend, ATR, Relative Volatility, and RSI. TradingView's candlestick and chart pattern recognition algorithms are game changers for improving trading outcomes.| Liberated Stock Trader
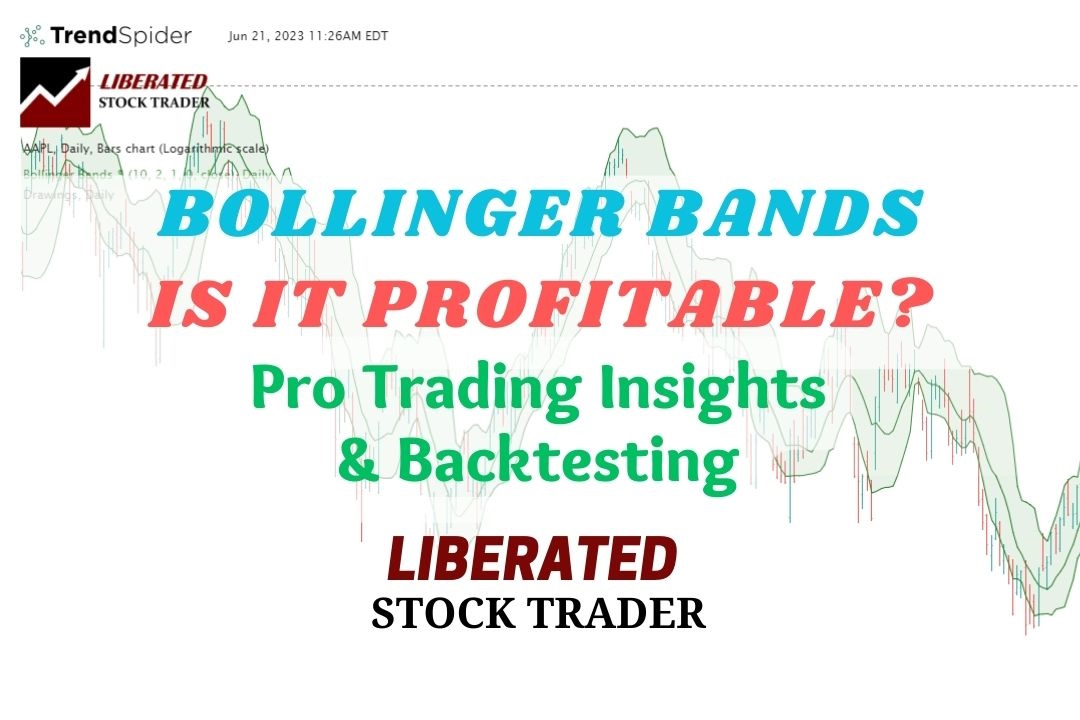
My reliability testing of Bollinger Bands on the S&P 500, using 13,360 years of data, suggests it is an unprofitable indicator for traders. However, Bollinger Bands can be highly profitable, with the optimal settings.| Liberated Stock Trader
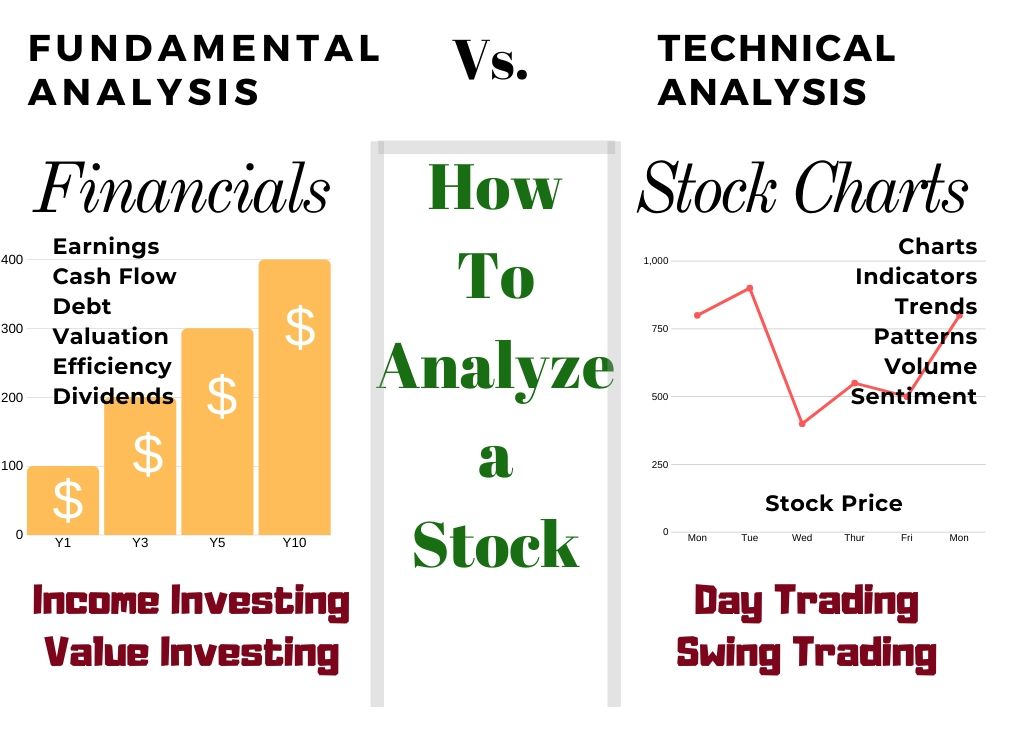
There are two ways to analyze stocks. Fundamental analysis, which evaluates criteria such as PE ratio, earnings, and cash flow. Technical analysis, which involves studying charts, stock prices, volume, and indicators.| Liberated Stock Trader
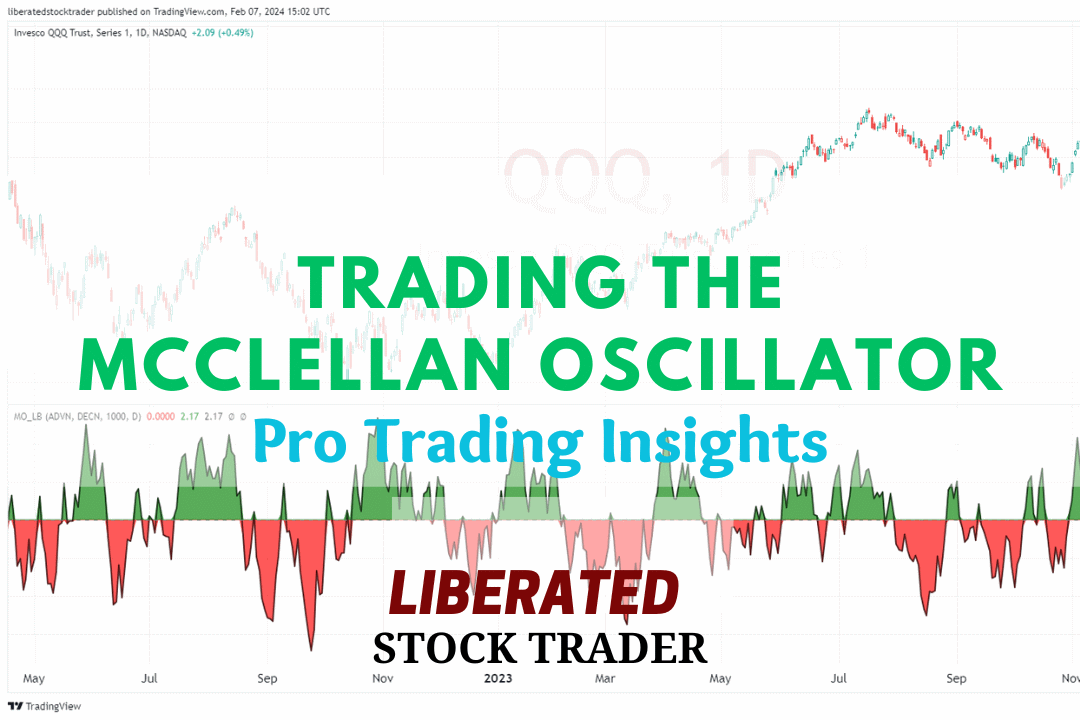
The McClellan Oscillator is a technical analysis tool designed to assess the market breadth of the New York Stock Exchange (NYSE). It is renowned for its effectiveness in revealing the underlying strength or weakness of the market by comparing the number of advancing to declining stocks.| Liberated Stock Trader
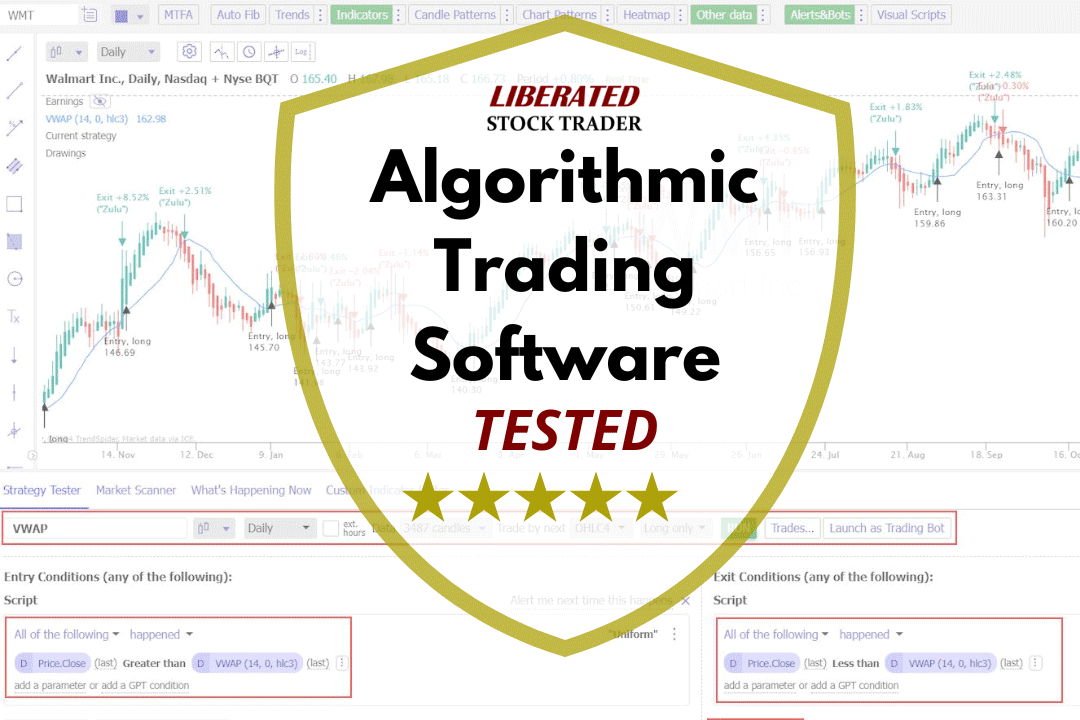
My testing shows that TrendSpider, Trade Ideas, TradingView, and Tickeron are the most effective software for creating, testing, and executing trading algorithms.| Liberated Stock Trader
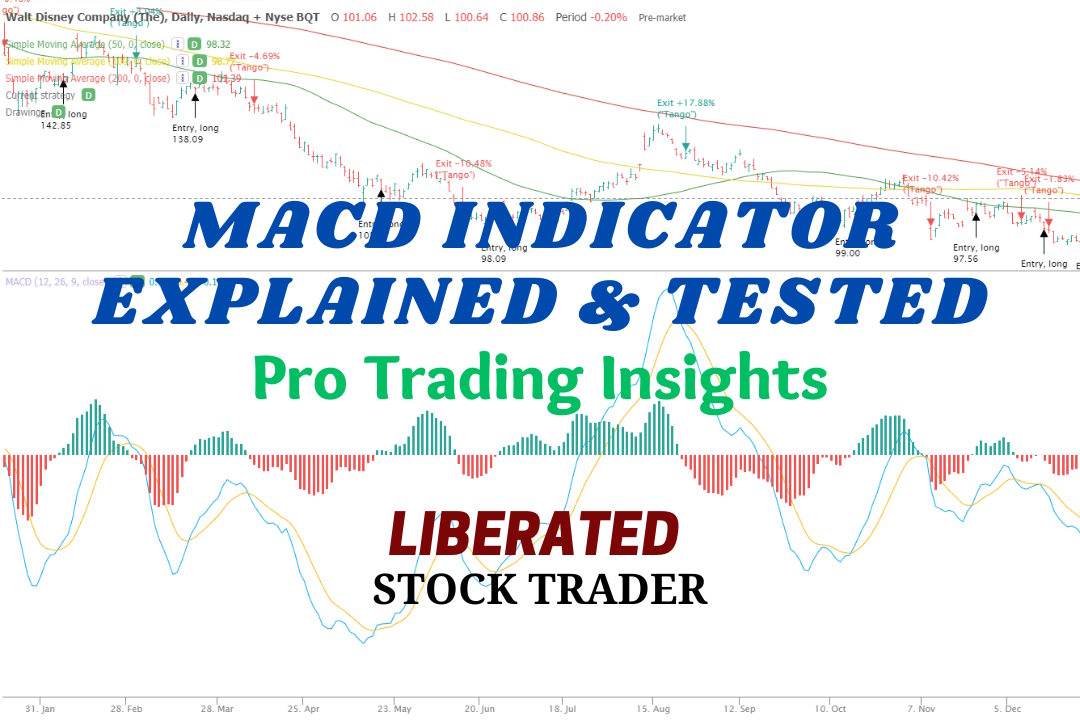
MACD is a trend-following momentum indicator used to identify price trends. We conducted 606,422 test trades to find the best settings and trading strategies.| Liberated Stock Trader
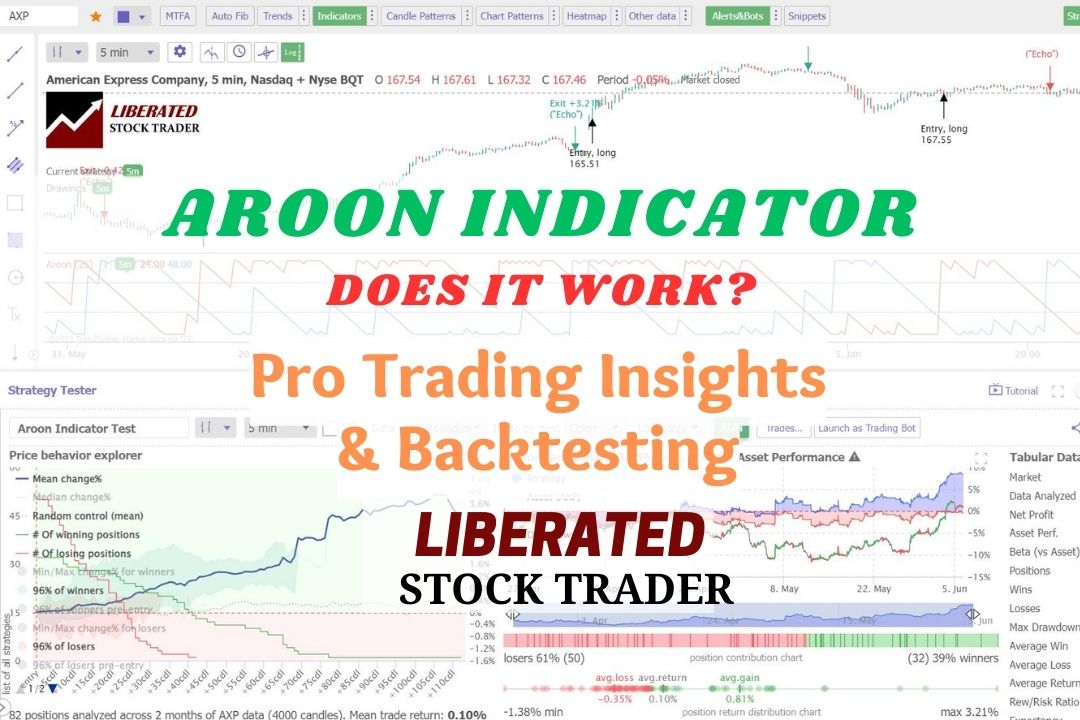
In technical analysis, the Aroon indicator identifies trend reversals and trend strength. This oscillating indicator has two parts: the "Aroon Up" line measures uptrend strength, and the "Aroon Down" line for downtrend strength.| Liberated Stock Trader
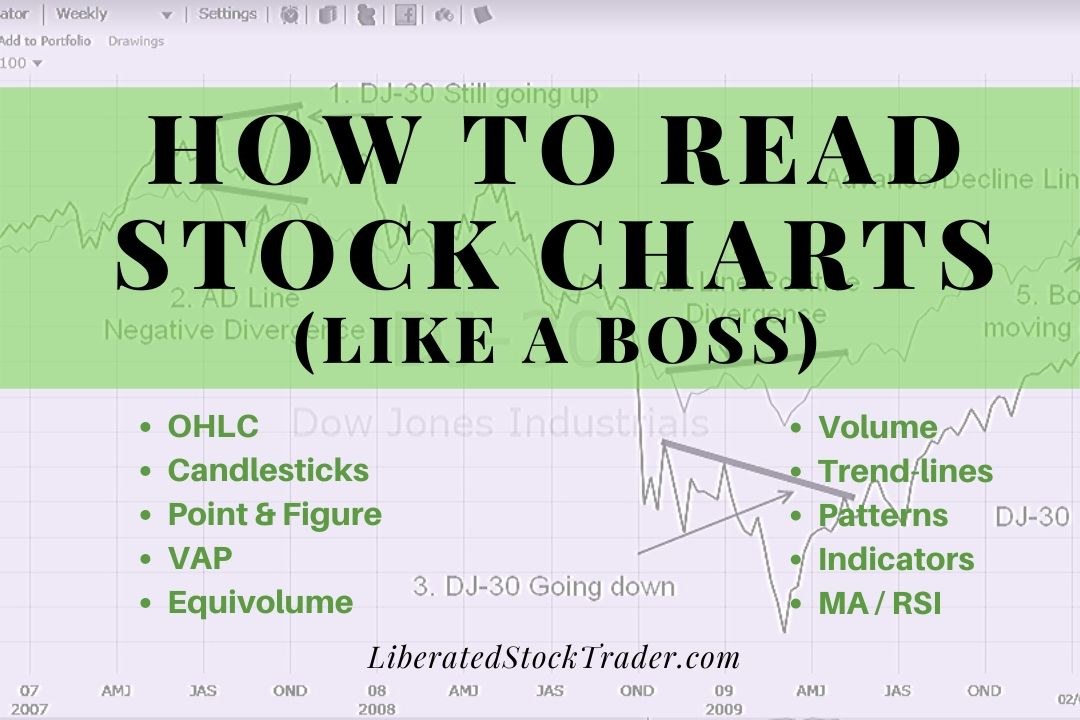
To read stock charts you need to use stock charting software, select your chart type, configure your timeframe, determine price direction using trendlines and use indicators to estimate future prices.| Liberated Stock Trader

The Relative Strength Index (RSI) is an oscillating momentum indicator that measures the speed and change of stock price movements. RSI uses a scale from 0 to 100 to indicate overbought or oversold conditions.| Liberated Stock Trader
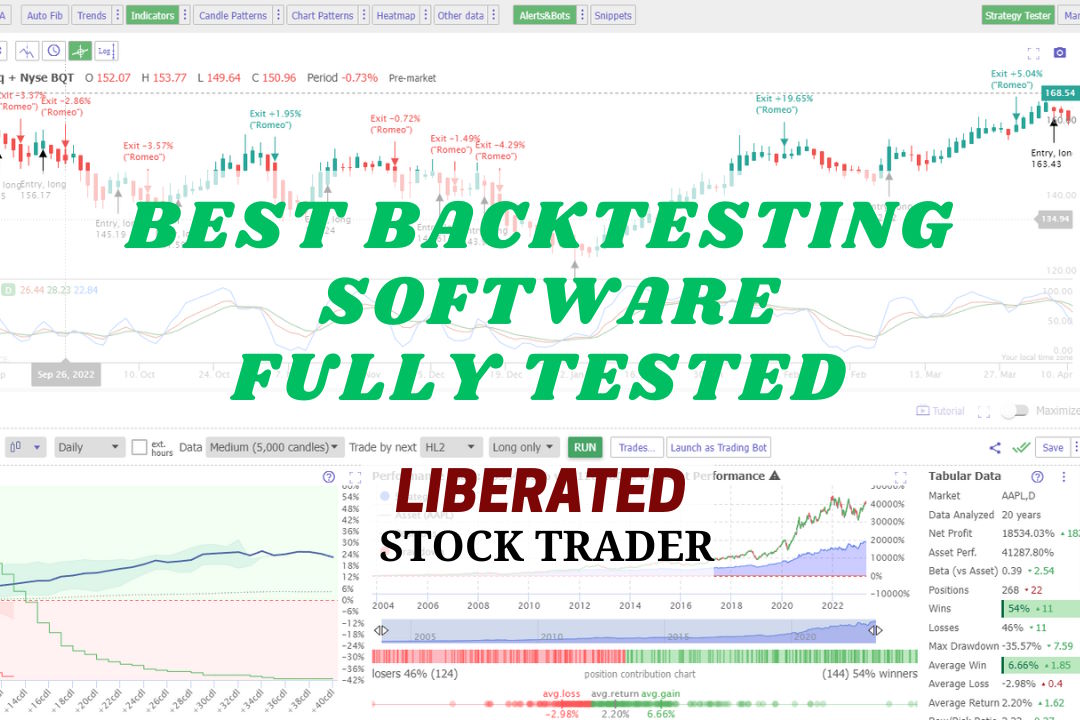
My research shows the best stock backtesting and auto-trade software are TrendSpider, Trade Ideas, and Tradingview. My testing process selected TrendSpider as the overall winner because it offers the most flexible, code-free, multilayer backtesting.| Liberated Stock Trader
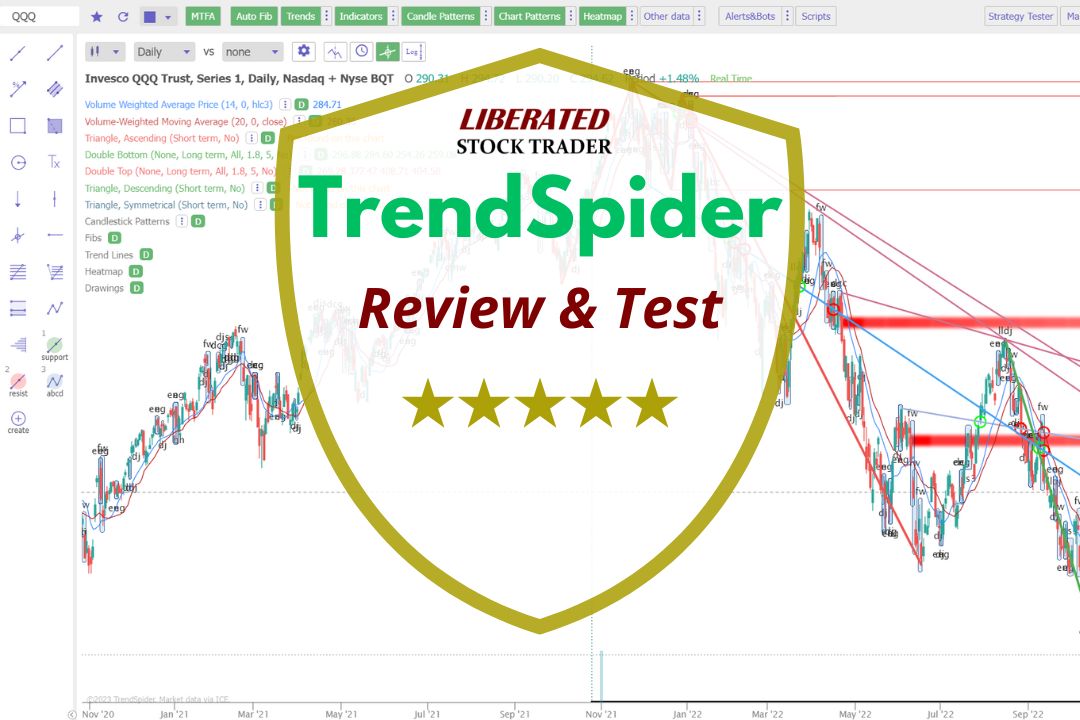
My testing awards Trendspider 4.8/5 stars due to its innovation. Its powerful algorithms recognize trendlines, chart patterns, and candlesticks automatically. It also has automated trading bots, real AI LLMs, and powerful point-and-click back- testing.| Liberated Stock Trader

Our research on 10,400 years of exchange data shows the best day trading indicators are the Price Rate of Change, VWAP, Weighted Moving Average, Hull Moving Average, Simple Moving Average, and RSI.| Liberated Stock Trader
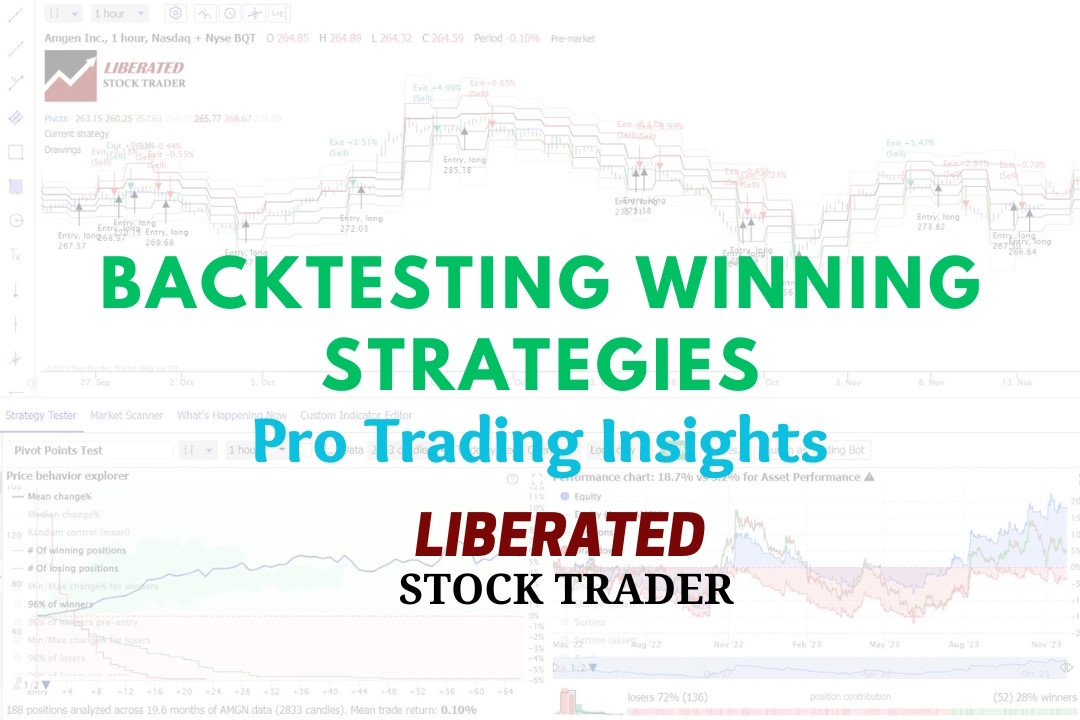
Experienced investors backtest their trading strategies to optimize their portfolios. Backtesting is a critical step that enables traders to assess the potential viability of a trading strategy by applying it to historical data.| Liberated Stock Trader
