Free Timeline Infographic Templates - Venngage
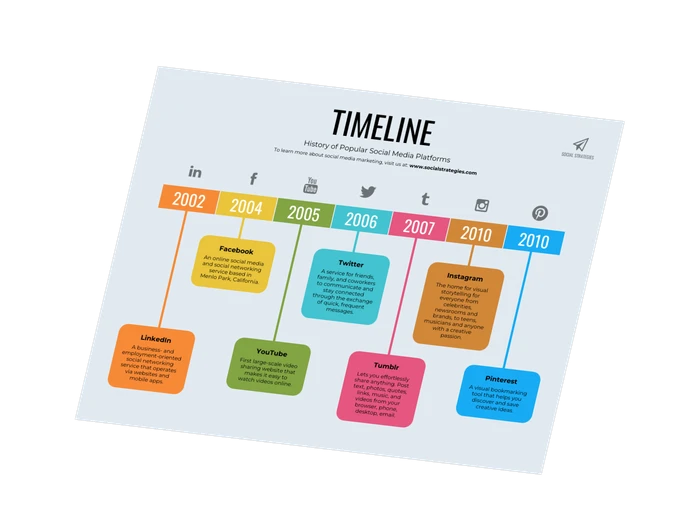
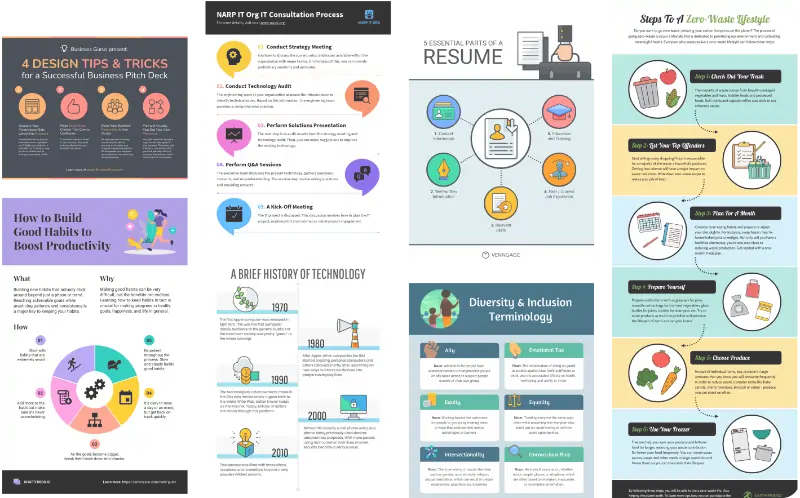
Design professional-looking timeline infographics in a matter of minutes. Start with one of our templates and edit it in our infographic maker. It's easy!| Venngage
Design professional-looking timeline infographics in a matter of minutes. Start with one of our templates and edit it in our infographic maker. It's easy!| Venngage

Visual symbolism is core to graphic design. This guide to common symbols and meanings will cover universal symbols, how to use symbols, and more.| Venngage

See how your design looks to an audience with color blindness or visual impairment using Venngage’s color blind simulator. Try now for free!| Venngage
Free PDF Accessibility Checker. Ensure your PDFs are accessible to everyone with Venngage's accessibility tools.| Venngage

Know how to apply the ADA Standards for Accessible Design to your visuals? Learn all you need to create ADA-compliant designs here.| Venngage

This guide will teach you everything you need to know about how to pick colors for your infographics, charts, reports, social media graphics, and more.| Venngage
Check our free accessibility color contrast checker and find out if the contrast ratio of text/image and background colors follow WCAG accessibility standards.| Venngage
Filter through our newest accessible infographic templates and start creating your own visuals in minutes.| Venngage

Inclusive design isn't just the latest buzzword. Learn all about this mindset and why it's important for your business here.| Venngage

Discover how to use image alt text to improve design accessibility & better serve your audience. Plus, best practices and helpful tips.| Venngage
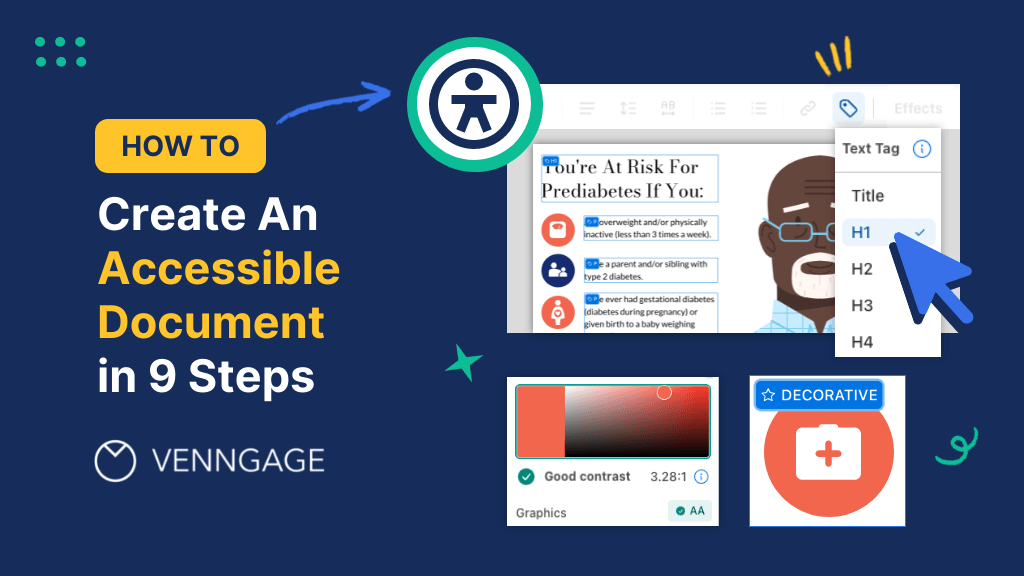
Create inclusive and accessible digital documents easily with Venngage's WCAG-compliant design tool. Reach a wider audience today!| Venngage

How many people do you think are colorblind on the planet? What country has the most colorblind population? Here Is The Population of Colorblind People in 22 Countries.What Percentage of the Population Is Color Blindness?There is general agreement that 1 in 12 men (8%) and 1 in 200 women are colorblind (approximately 4.5% of the world population), as a result, there are more than 350 million colorblind people in the world. This number increases every year according to the world's population grow| COLORBLIND GUIDE

Convert text to speech in 20+ languages, capturing every nuance & subtlety of human speech. Customize tone, prosody, and intensity for realistic voiceovers.| murf.ai
Sign in to Venngage to create free infographics.| infograph.venngage.com

70-80% of people with poor reading skills, are likely dyslexic. Here are the most up-to-date statistics and facts about Dyslexia.| www.crossrivertherapy.com

If you’re new to the world of design, the term infographic might be foreign to you. You might wonder: What is an infographic? Why use infographics?| Venngage
Discover beautiful color combinations your whole audience can appreciate with the click of a button. Try our free accessible color palette generator today.| Venngage
