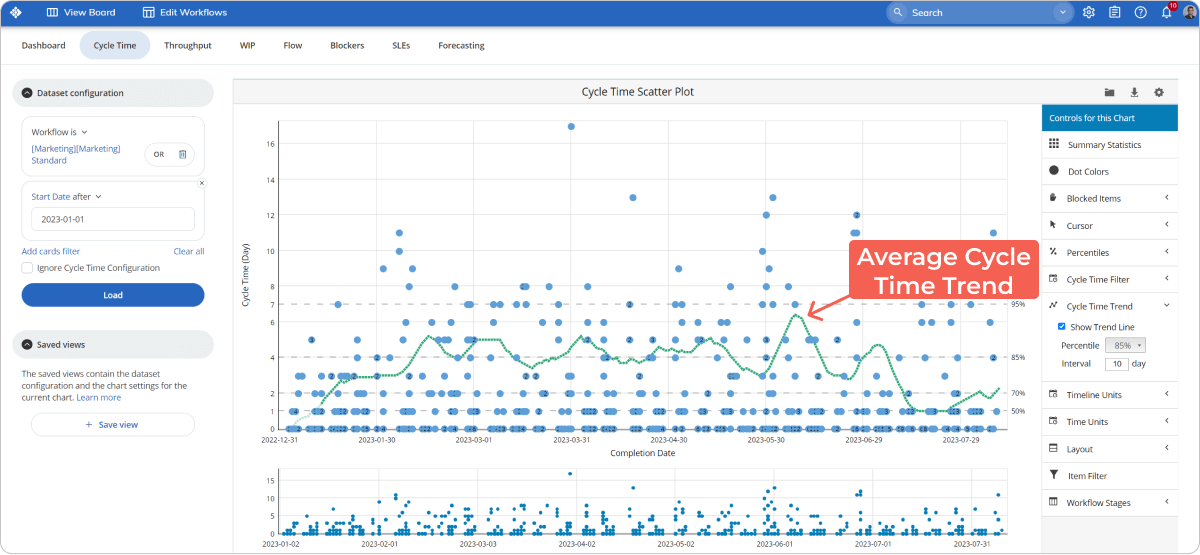
The scatter diagram is a two-dimensional graphical representation of a set of data widely used to show the correlation between two variables. Learn the basics and benefits that define the importance of a scatter diagram in our practical guide.| Kanban Software for Agile Project Management
The fishbone diagram is a causal diagram that visually represents the different factors that caused a problem to occur. The tool is designed to help both identify the causes of a problem and propose actions.| Kanban Software for Agile Project Management
Businessmap is an enterprise-ready platform for agile project, product, and portfolio management. Start your 14-day free trial!| Kanban Software for Agile Project Management
Delve into the 5 Whys methodology, a simple yet powerful tool for uncovering the root causes of problems and implementing effective solutions. Learn how to apply this technique to various scenarios, from product defects to process inefficiencies.| Kanban Software for Agile Project Management