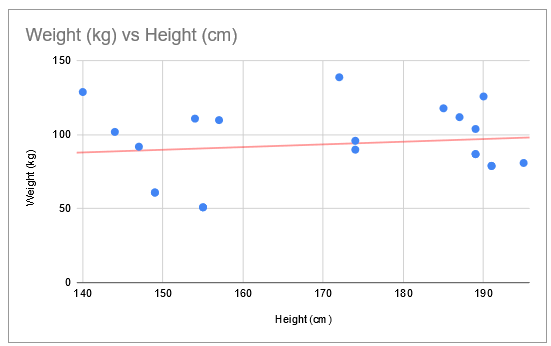
How to Make a Scatter Plot in Google Sheets: Easy 2024 Guide
Find out how to make a scatter plot in Google Sheets here with this simple to follow step-by-step guide with screenshots.| Spreadsheet Point
Find out how to make a scatter plot in Google Sheets here with this simple to follow step-by-step guide with screenshots.| Spreadsheet Point

Learn how to make a line graph in Google Sheets with a few clicks. This tutorial will also show you how to set up and customize the line chart easily| Spreadsheet Point

Learn how to make a bar graph in Google Sheets. We cover every type of bar chart you can make and you can go through the entire guide in under 10 minutes!| Spreadsheet Point
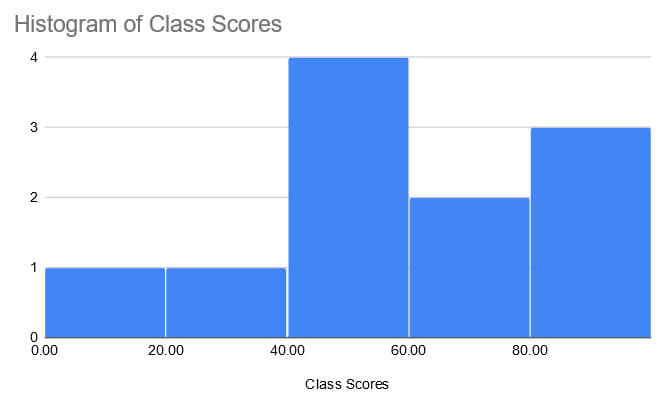
A Histogram will help you to visualize your data and make itmore digestible. This guide breaks down how to make a histogram in Google Sheets into an easy steps.| Spreadsheet Point
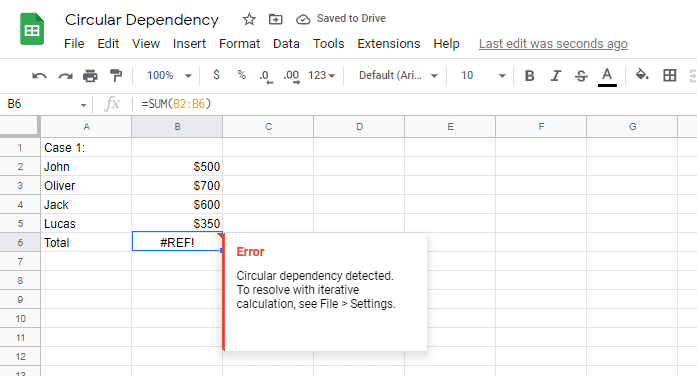
Learn step-by-step how to quickly and easily fix the circular dependency detected error that can occur in Google Sheets.| Spreadsheet Point

Learn how to use Google Sheets copy conditional formatting using three easy methods, including the Paint Format and the Special Paint method.| Spreadsheet Point

Colors provide a great way to make values stand out. In this tutorial, we show how to visualize data by applying a color scale in Google Sheets.| Spreadsheet Point

Summing in spreadsheets is simple. But, what if you only want to use specific numbers in a range? That's when you'd use the SUMIF Google Sheets function.| Spreadsheet Point

Scatter plots are hard to interpret without a trend line. Find out how to add a line of best fit in Google Sheets to make your data more readable.| Spreadsheet Point

We evaluated Google Sheets project management templates. Learn where to find them, how to access add-ons, and where to improve productivity.| Spreadsheet Point
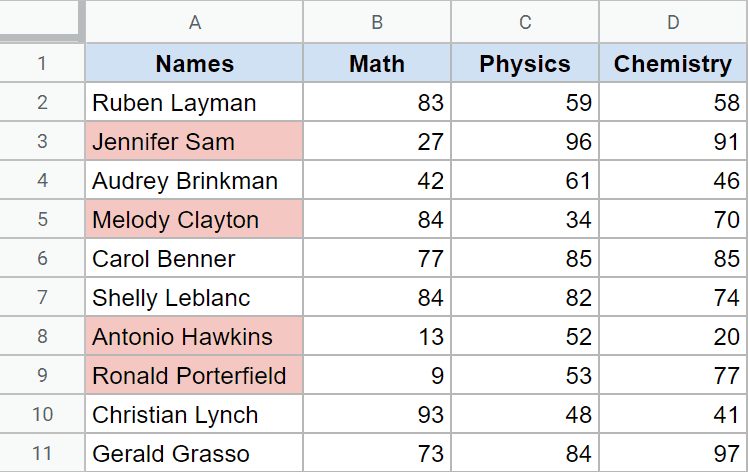
There are many reasons you'd need to use Google Sheets conditional formatting based on another cell. Follow this simple guide to learn how to do it.| Spreadsheet Point

Learn to assign a task in Google Sheets with a comment or via drop-down menu. This guide covers both methods for effective project management.| Spreadsheet Point
