
Detailed Gantt Chart Google Sheets Guide + 2 Free Templates
In this Gantt Chart Google Sheets tutorial, you'll learn to effectively manage teams and keep your projects on track or just use our Gantt chart template.| Spreadsheet Point
In this Gantt Chart Google Sheets tutorial, you'll learn to effectively manage teams and keep your projects on track or just use our Gantt chart template.| Spreadsheet Point

Learn how to make a single-color, multi-color, and Geo Google Sheets heat map in a few clicks with this comprehensive step-by-step guide.| Spreadsheet Point

This guide teaches you how to make Google Docs Dark Mode. We’ll show you how to do it on PC, third-party extensions, and more!| Spreadsheet Point

Learning to use pivot tables is a game changer for data analysis. This pivot table Google Sheets guide will show you step-by-step how to make them.| Spreadsheet Point
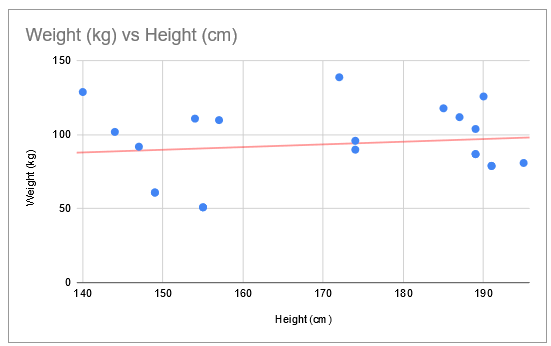
Find out how to make a scatter plot in Google Sheets here with this simple to follow step-by-step guide with screenshots.| Spreadsheet Point

Learn how to make a line graph in Google Sheets with a few clicks. This tutorial will also show you how to set up and customize the line chart easily| Spreadsheet Point

Learn how to make a bar graph in Google Sheets. We cover every type of bar chart you can make and you can go through the entire guide in under 10 minutes!| Spreadsheet Point

Want to make your data reporting more intelligible? Here’s a comprehensive Google Data Studio tutorial you should read in 2024.| Spreadsheet Point

Google Sheets can chart multiple ranges of data with a few simple tricks. Learn how to do it with this guide.| Spreadsheet Point

All the best Google Sheets courses and tutorials. We evaluated dozens and highlighted those that provide real-world value.| Spreadsheet Point

The GOOGLEFINANCE function is a great tool that helps you work with financial data. In this tutorial we show you how to use it with stock, crypto and currency.| Spreadsheet Point
