Trendlines are a visual representation of the trend direction in the stock market. They are formed by connecting two or more significant highs or lows on a stock chart, creating a diagonal line that indicates the general trend of the asset's price movement.| Liberated Stock Trader
A sell signal gives traders a heads-up on when to consider closing positions, helping them lock in gains or cut losses using actual triggers, not just hunches.| Liberated Stock Trader
A buy signal is essentially an indicator or event that suggests it may be a good time to purchase a particular stock, whether based on technical data, chart patterns, or intrinsic value.| Liberated Stock Trader
Learn technical analysis and how to read stock charts. This helps you understand the movement of stock prices, stock trends, and the supply-demand equation. Stock chart indicators and market sentiment are all important factors.| Liberated Stock Trader
My test trades yielded a 1.77 reward-to-risk ratio, with an average winning trade of 8.5%. Across a large sample, an ATR-based strategy yielded a small gain per trade, but it lost more often than it won and experienced significant drawdowns.| Liberated Stock Trader
Kagi charts provide traders with a unique perspective on price action, filtering out much of the noise and highlighting genuine trends. Getting a handle on how to use Kagi charts, dialing in the right settings, and understanding how they compare to other chart types can really sharpen your technical analysis and trading decisions.| Liberated Stock Trader
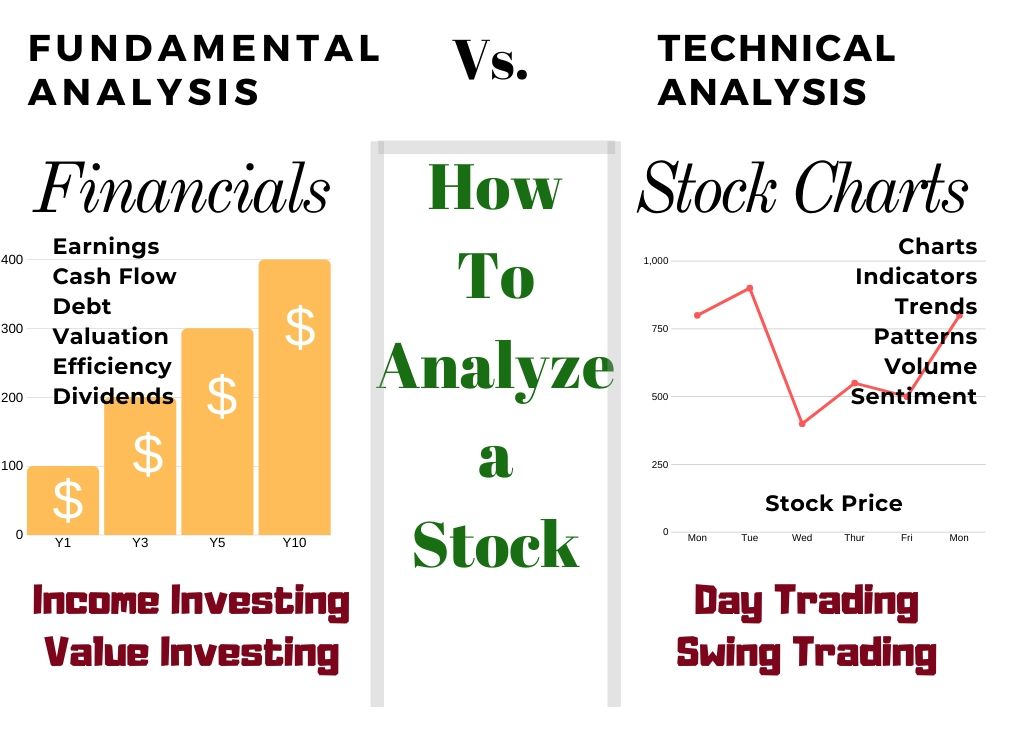
There are two ways to analyze stocks. Fundamental analysis, which evaluates criteria such as PE ratio, earnings, and cash flow. Technical analysis, which involves studying charts, stock prices, volume, and indicators.| Liberated Stock Trader
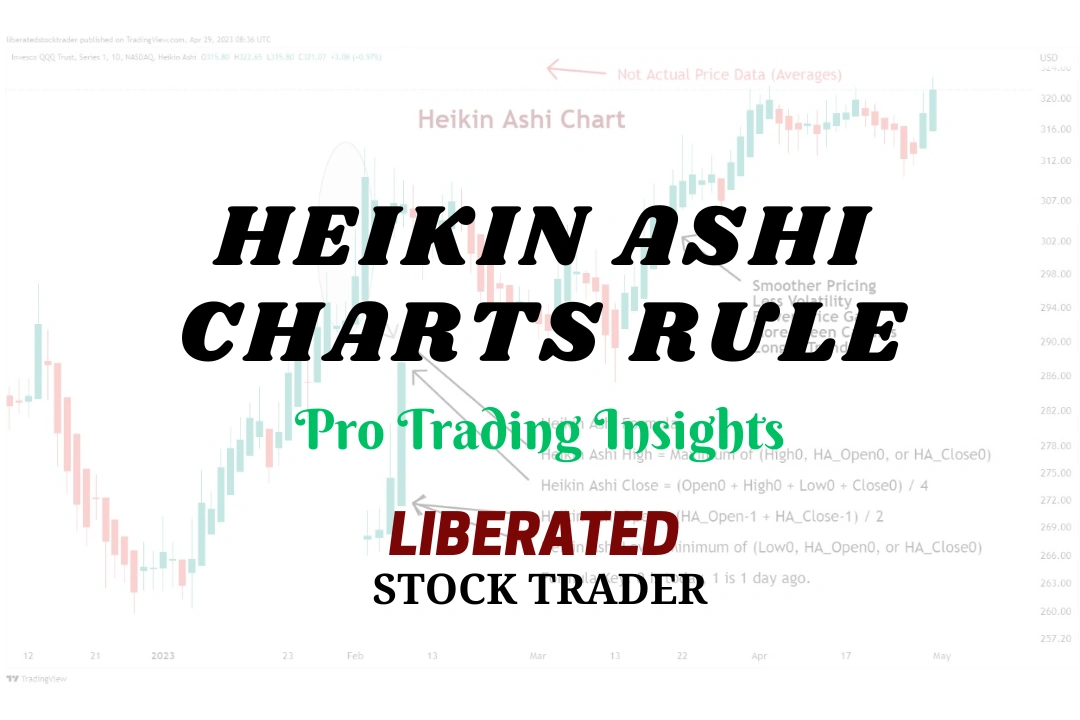
Using VWAP with a 14 setting on a daily Heikin Ashi chart is vastly superior to conventional OHLC charts. Using an OHLC chart, the strategy barely breaks even with a low-profit expectancy of 0.15. In contrast with a Heikin Ashi chart, the strategy is incredibly profitable, with a profit expectance of 0.83 and a reward-to-risk ratio of 3.03.| Liberated Stock Trader
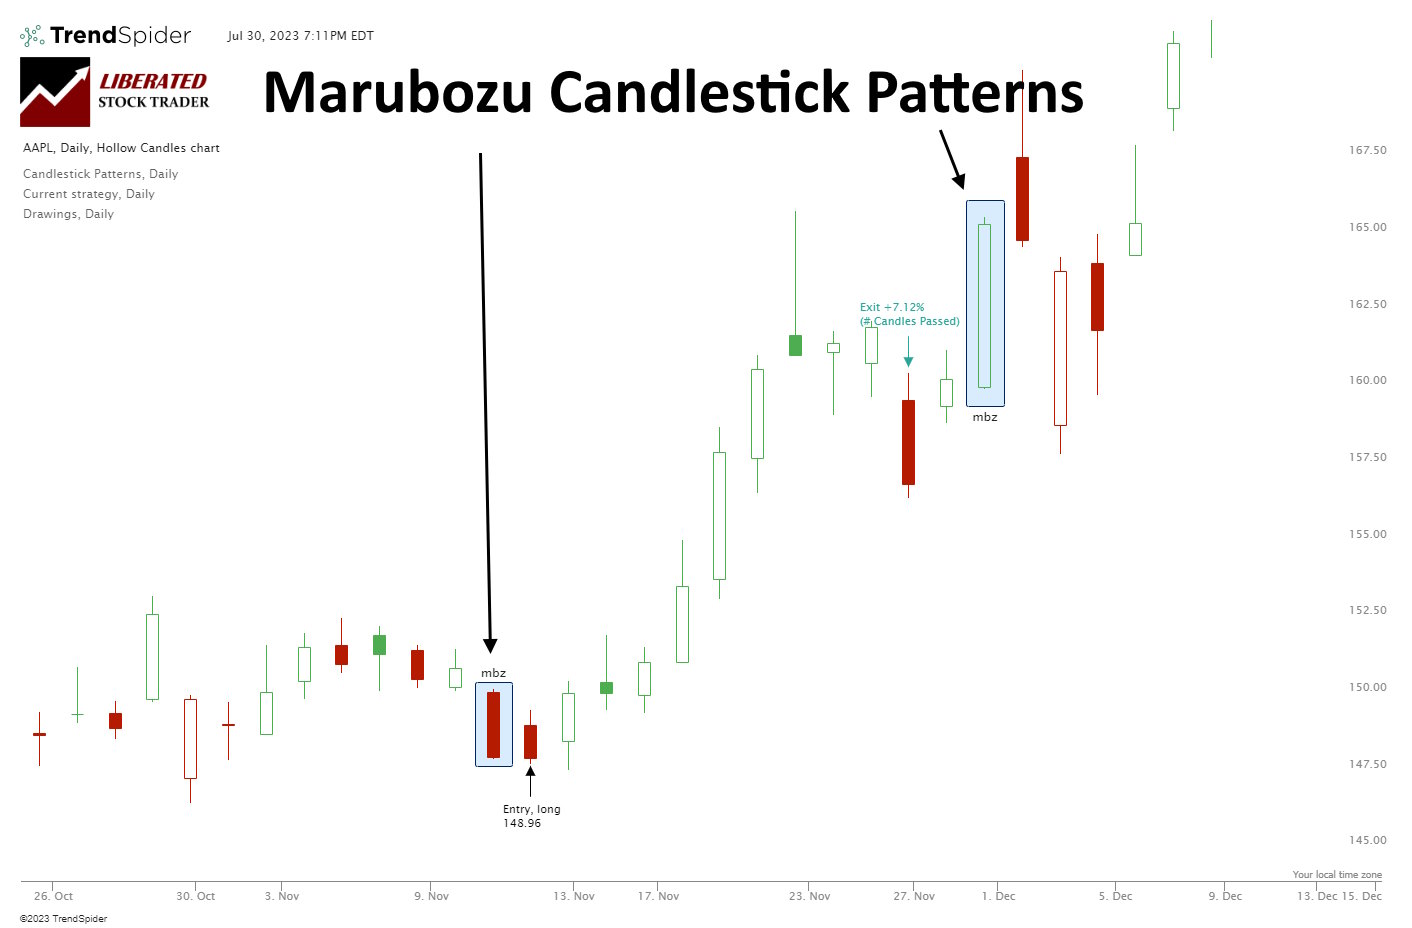
Our research shows Bearish Marubozu candles are among the most profitable patterns. Based on 568 years of data, it has a 56.1% success rate and an average win of 4.1%. Conversely, the Bullish Marubozu is one of the worst.| Liberated Stock Trader
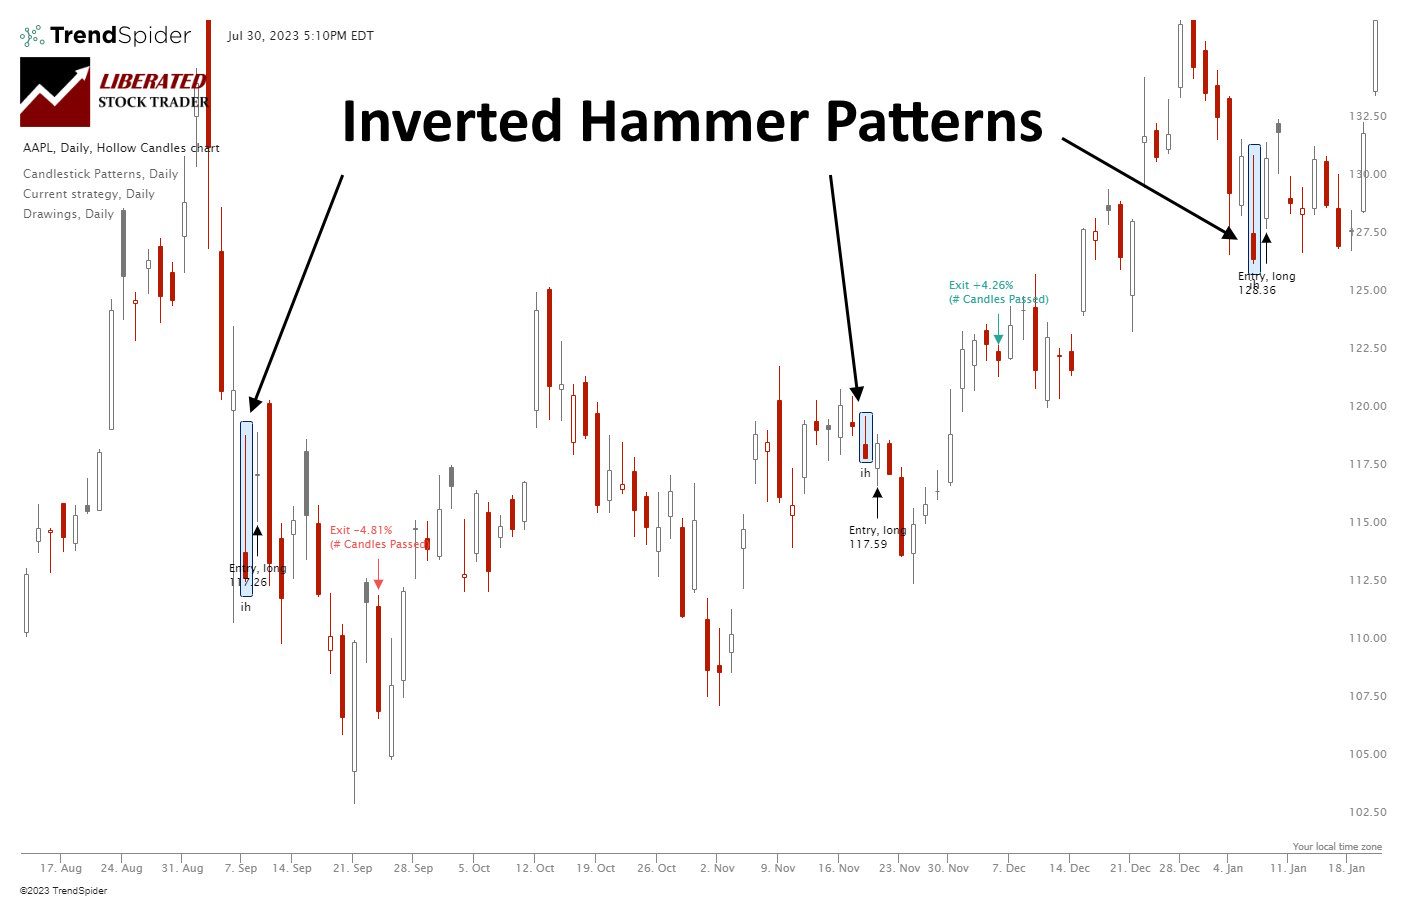
Our research shows the Inverted Hammer is the most accurate and profitable candlestick pattern. Used as a bullish signal, it has a 60% success rate and an average win of 4.2%, based on 588 years of data.| Liberated Stock Trader
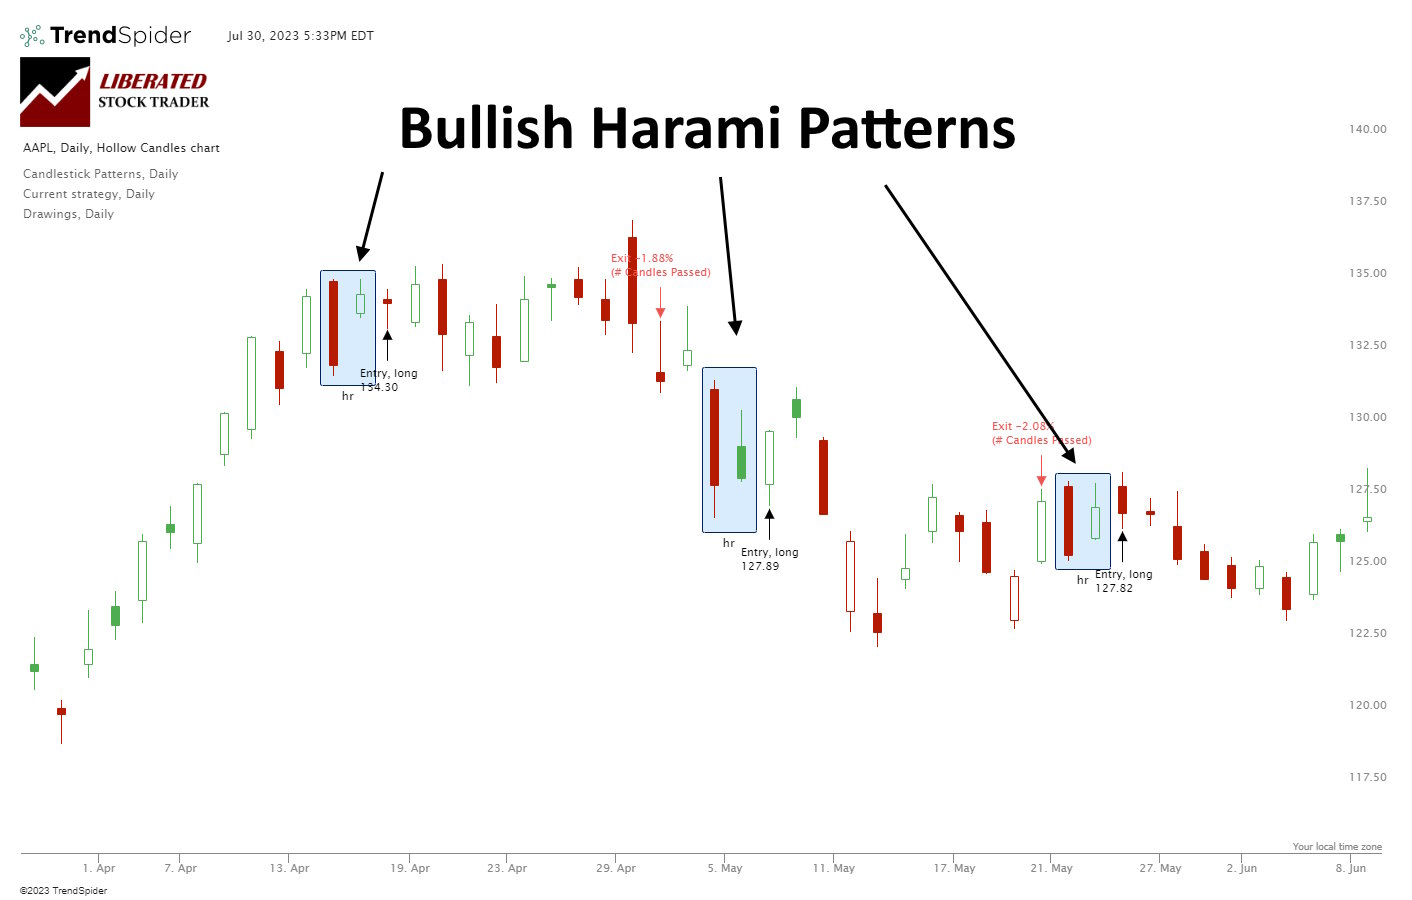
Our research shows Bullish Harami and Bullish Harami Cross are profitable patterns. Based on 1,112 years of data, the bullish Harami has an average profit per trade of 0.5% and the Harami Cross 0.58%.| Liberated Stock Trader
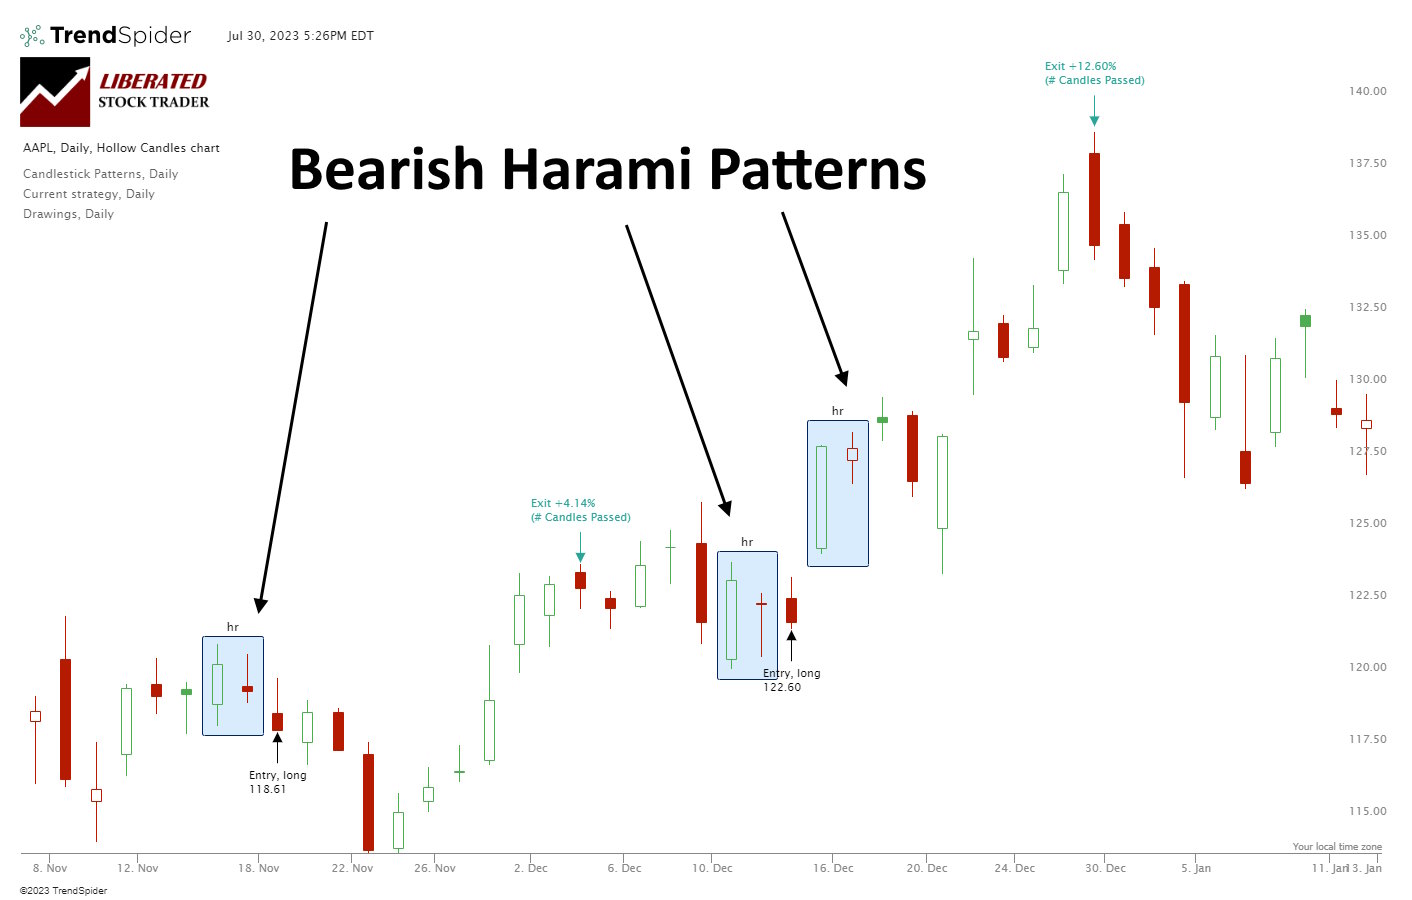
Our research shows Bearish Harami and Bearish Harami Cross are profitable patterns. Based on 1,136 years of data, the Bullish Harami has an average profit per trade of 0.48% and the Harami Cross 0.57%.| Liberated Stock Trader
Renko charts filter out unnecessary price fluctuations to provide a clear stock price trend that traders can use in their investing strategies. Unlike a traditional bar or candlestick chart, Renko charts are based on price changes rather than time.| Liberated Stock Trader
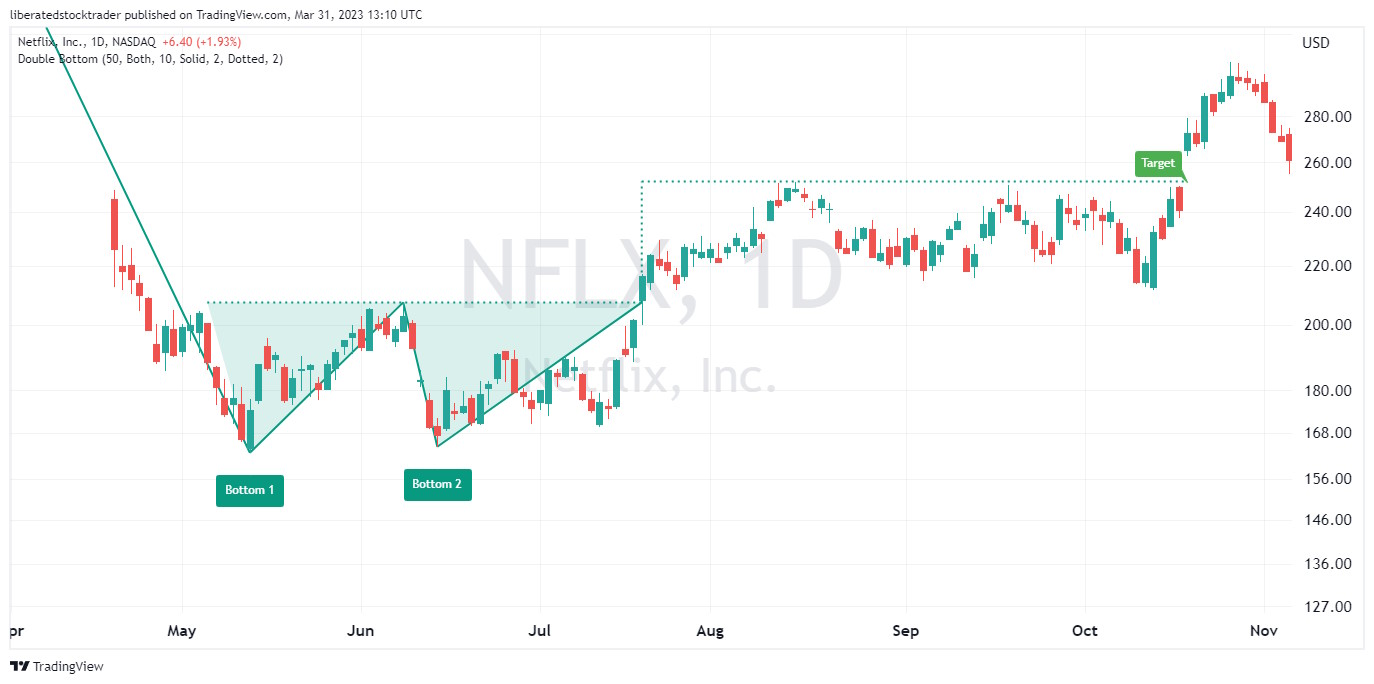
Decades of research reveal the double bottom pattern has an 88% success rate in bull markets and an average profit potential of +50%. The double-bottom chart pattern is one of the most reliable and accurate chart indicators in technical analysis.| Liberated Stock Trader
I backtested 360 years of data on the 30 most important US stocks, and our findings prove that Heikin-Ashi chart strategies outperform 66% of equities vs. a buy-and-hold strategy.| Liberated Stock Trader
You can read candlestick charts using pattern recognition software to identify five reliable patterns, the Inverted Hammer, Bearish Marubozu, Gravestone Doji, Bearish Engulfing, and Bullish Harami Cross.| Liberated Stock Trader
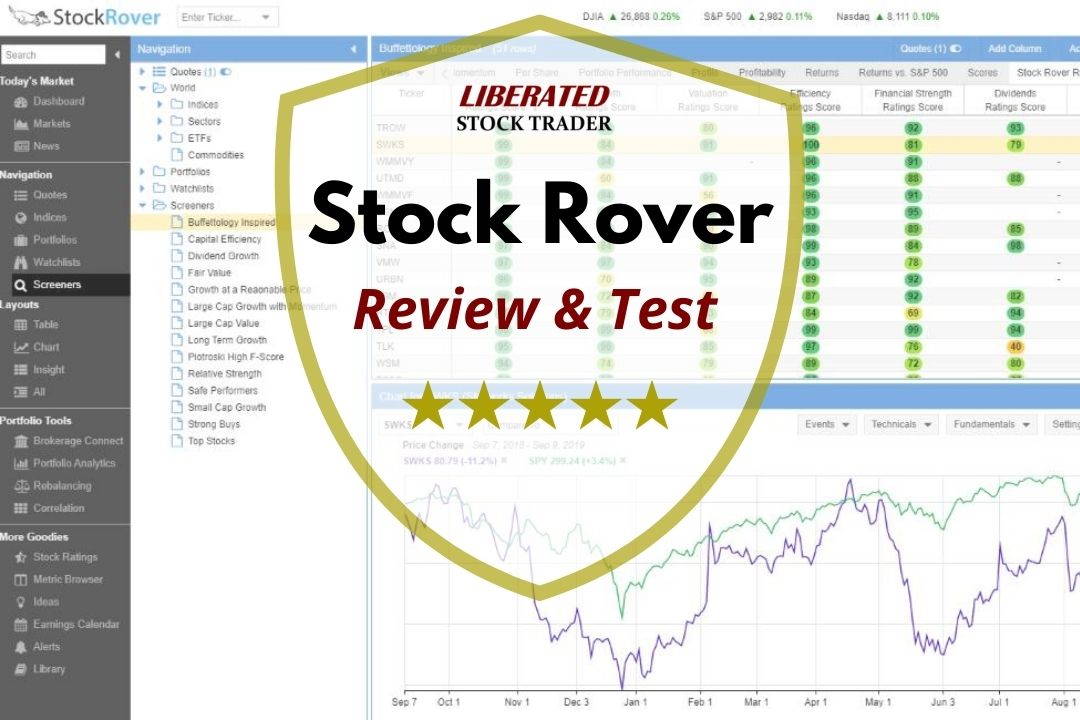
LiberatedStockTrader's review testing awards Stock Rover 4.7 stars. Its advanced screening, research, and portfolio tools are ideal for US value, income, and growth investors. With 650 financial metrics on 10,000 stocks and 44,000 ETFs, we rate Stock Rover the number one stock screener.| Liberated Stock Trader
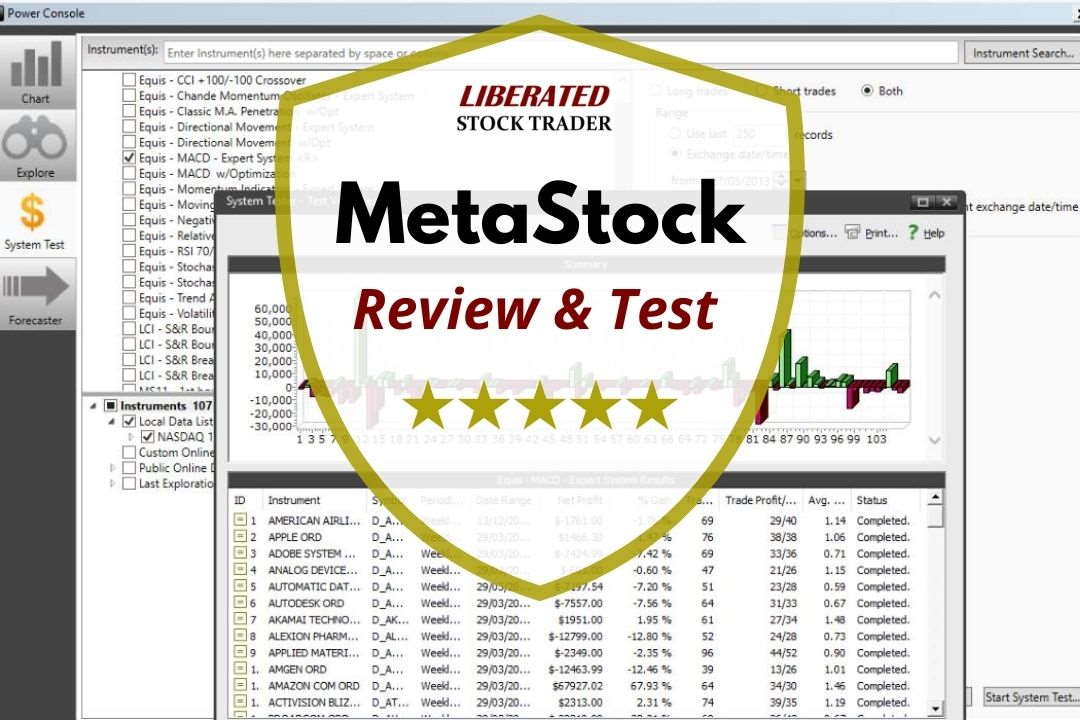
Our MetaStock review and test reveal an excellent platform for traders, with 300+ charts and indicators for stocks, ETFs, bonds & forex globally. Metastock has solid backtesting and forecasting, and Refinitiv/Xenith provides powerful real-time news and screening.| Liberated Stock Trader
From my experience in trading real-time news events, you should seek to gather and interpret the financial newsfeed as quickly as possible to initiate short-term trades to take advantage of profitable situations.| Liberated Stock Trader
Research shows that the most reliable chart patterns are the Head and Shoulders, with an 89% success rate, the Double Bottom (88%), and the Triple Bottom and Descending Triangle (87%). The Rectangle Top is the most profitable, with an average win of 51%, followed by the Rectangle Bottom with 48%.| Liberated Stock Trader
My 2025 testing awards TradingView 4.8 stars due to its continued innovation in chart analysis, pattern recognition, screening, and backtesting. TradingView is my top recommendation for US and international traders.| Liberated Stock Trader
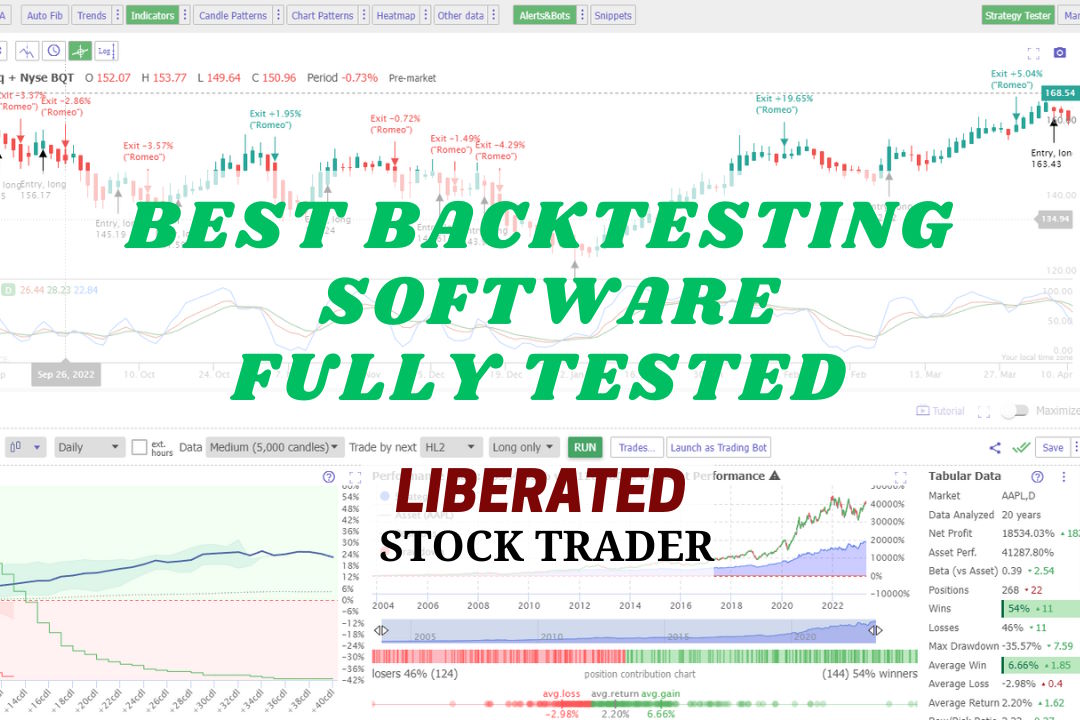
My research shows the best stock backtesting and auto-trade software are TrendSpider, Trade Ideas, and Tradingview. My testing process selected TrendSpider as the overall winner because it offers the most flexible, code-free, multilayer backtesting.| Liberated Stock Trader
My testing awards Trendspider 4.8/5 stars due to its innovation. Its powerful algorithms recognize trendlines, chart patterns, and candlesticks automatically. It also has automated trading bots, real AI LLMs, and powerful point-and-click back- testing.| Liberated Stock Trader
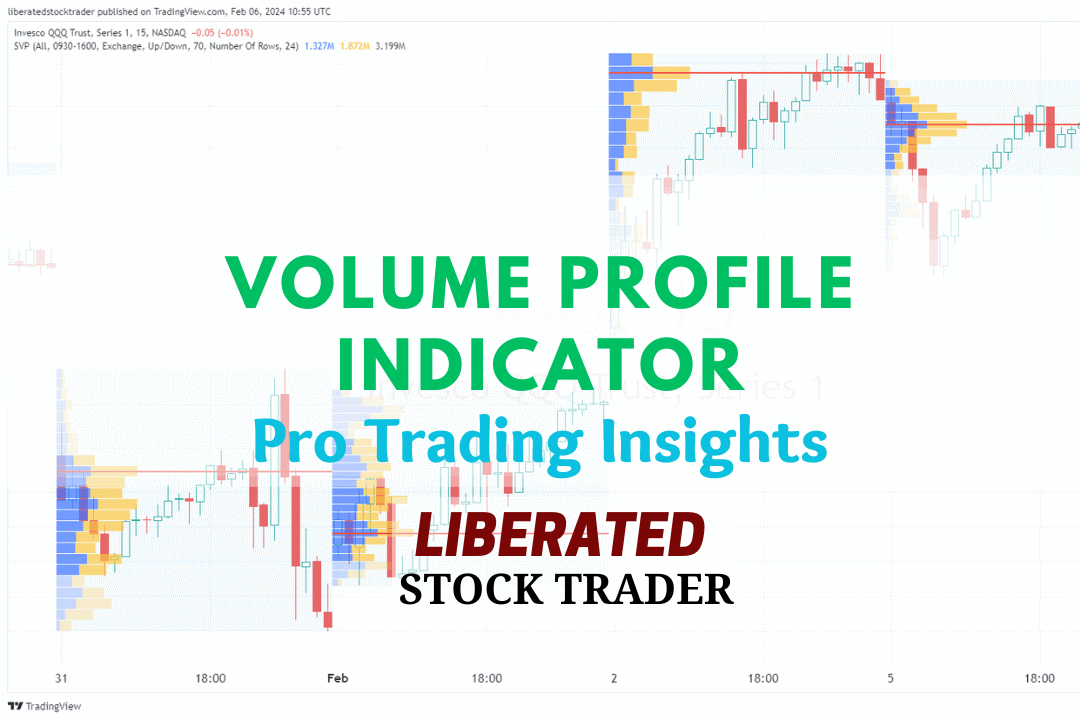
Volume profile technical analysis indicators provide a uniquely detailed overview of volume distribution across price levels, offering traders insights into market structure and supply and demand zones.| Liberated Stock Trader
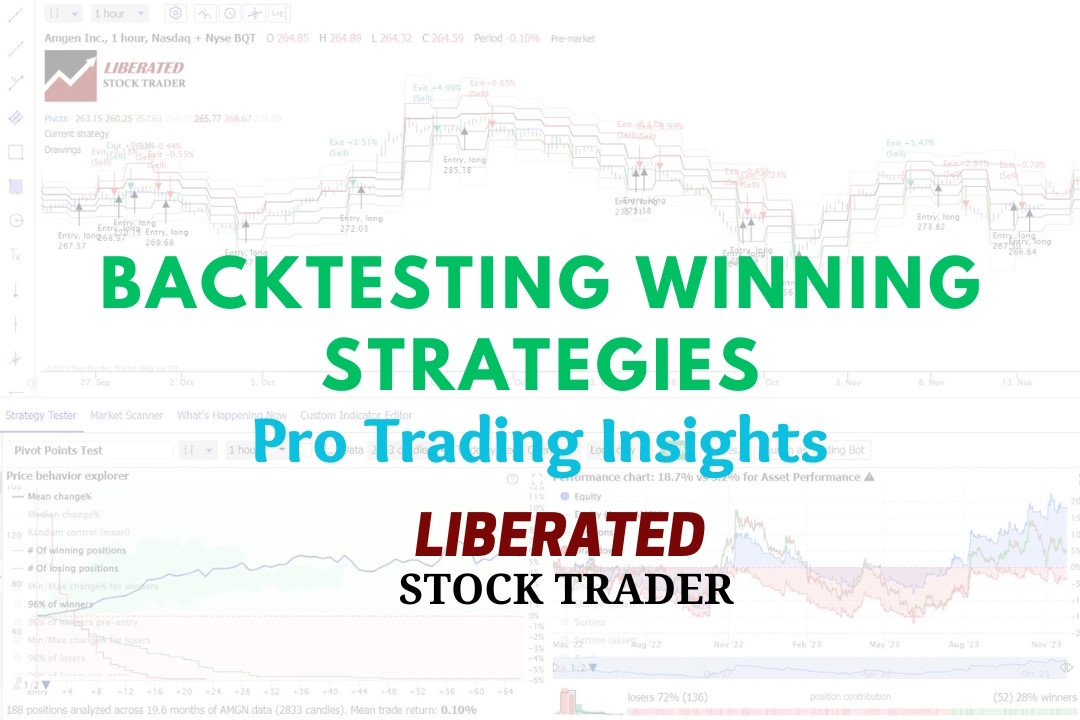
Experienced investors backtest their trading strategies to optimize their portfolios. Backtesting is a critical step that enables traders to assess the potential viability of a trading strategy by applying it to historical data.| Liberated Stock Trader
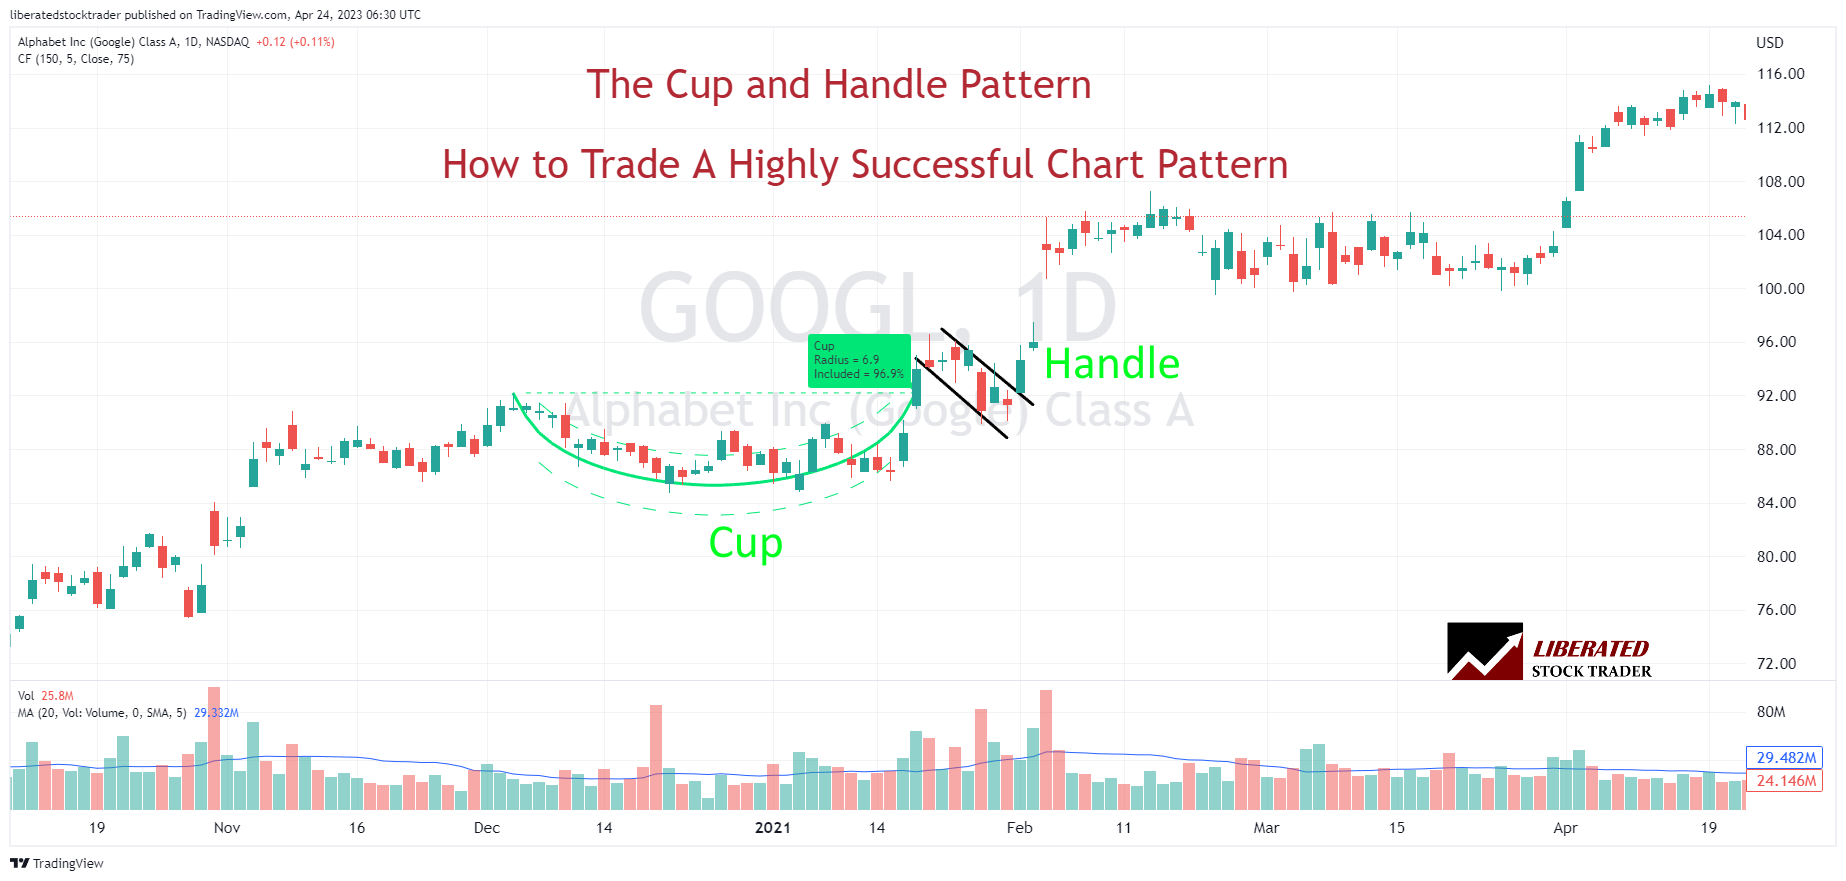
Twenty years of trading research show that the cup and handle pattern has a 95% success rate in bull markets and returns an average profit of +54%.| Liberated Stock Trader