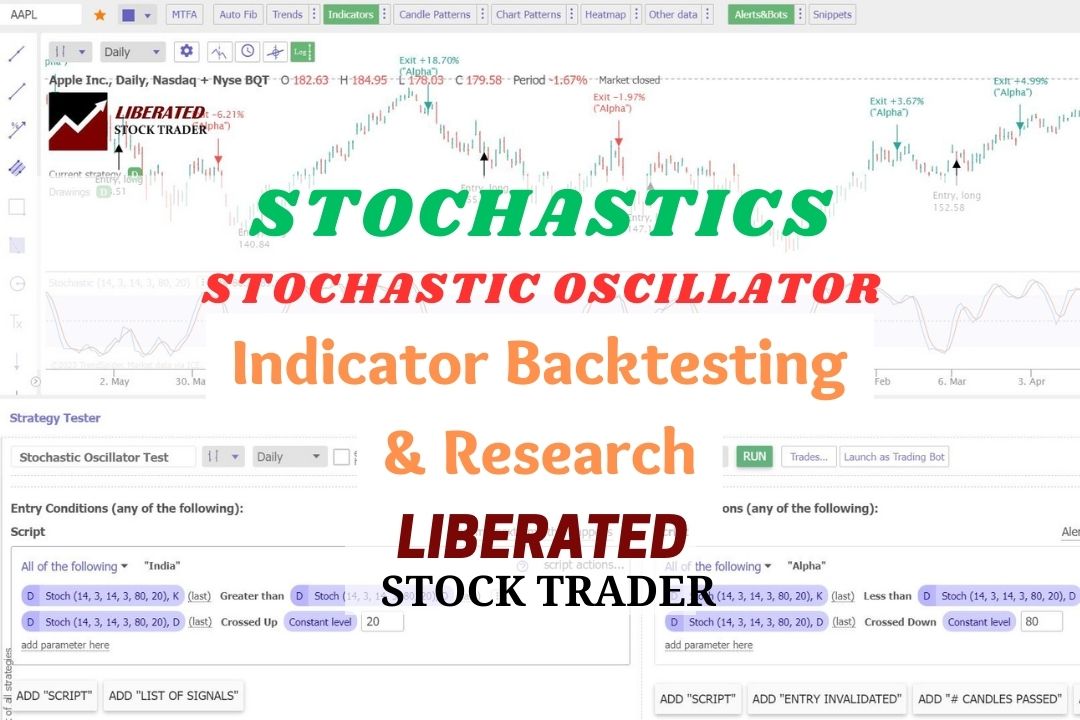
The Stochastic Oscillator momentum indicator compares an asset's closing price to a range of its previous prices. It oscillates between 0 and 100; below 20 indicates oversold, and above 80 suggests an overbought market.| Liberated Stock Trader
The mean reversion trading strategy suggests prices and returns eventually move back toward the mean or average. Reliable indicators like Stochastics, RSI, and Bollinger bands are based on mean reversion to identify overbought and oversold conditions.| Liberated Stock Trader
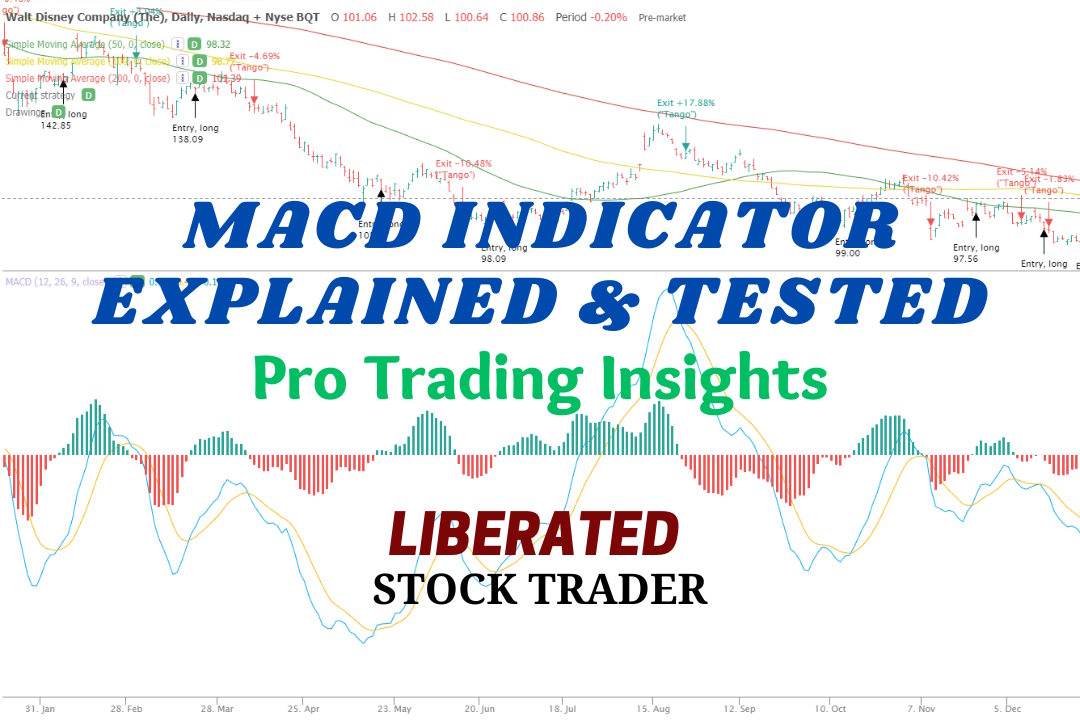
MACD is a trend-following momentum indicator used to identify price trends. We conducted 606,422 test trades to find the best settings and trading strategies.| Liberated Stock Trader
The Relative Strength Index (RSI) is an oscillating momentum indicator that measures the speed and change of stock price movements. RSI uses a scale from 0 to 100 to indicate overbought or oversold conditions.| Liberated Stock Trader
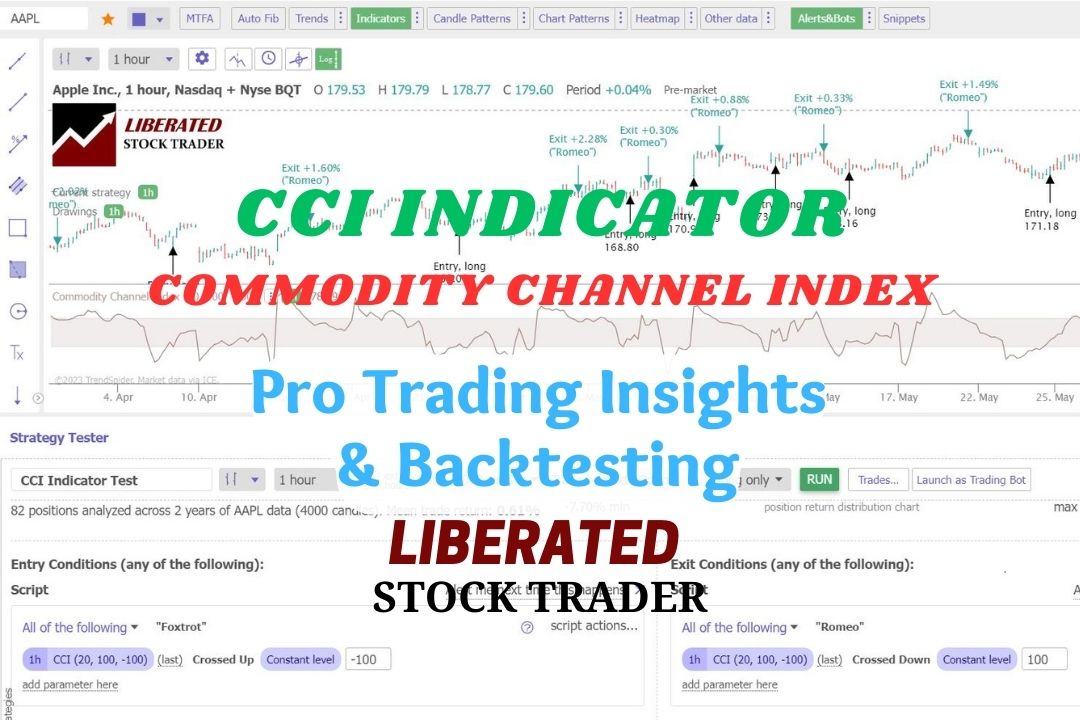
Our test data shows that using the CCI indicator with a 50 setting on the S&P 500 index stocks over 20 years was incredibly profitable, returning a 1,108% profit compared to the market, which returned 555%.| Liberated Stock Trader
Our research on 10,400 years of exchange data shows the best day trading indicators are the Price Rate of Change, VWAP, Weighted Moving Average, Hull Moving Average, Simple Moving Average, and RSI.| Liberated Stock Trader