Learn stock market investing with the complete online stock trading course by Barry D. Moore, a certified financial analyst from the International Federation of Technical Analysts (IFTA).| Liberated Stock Trader
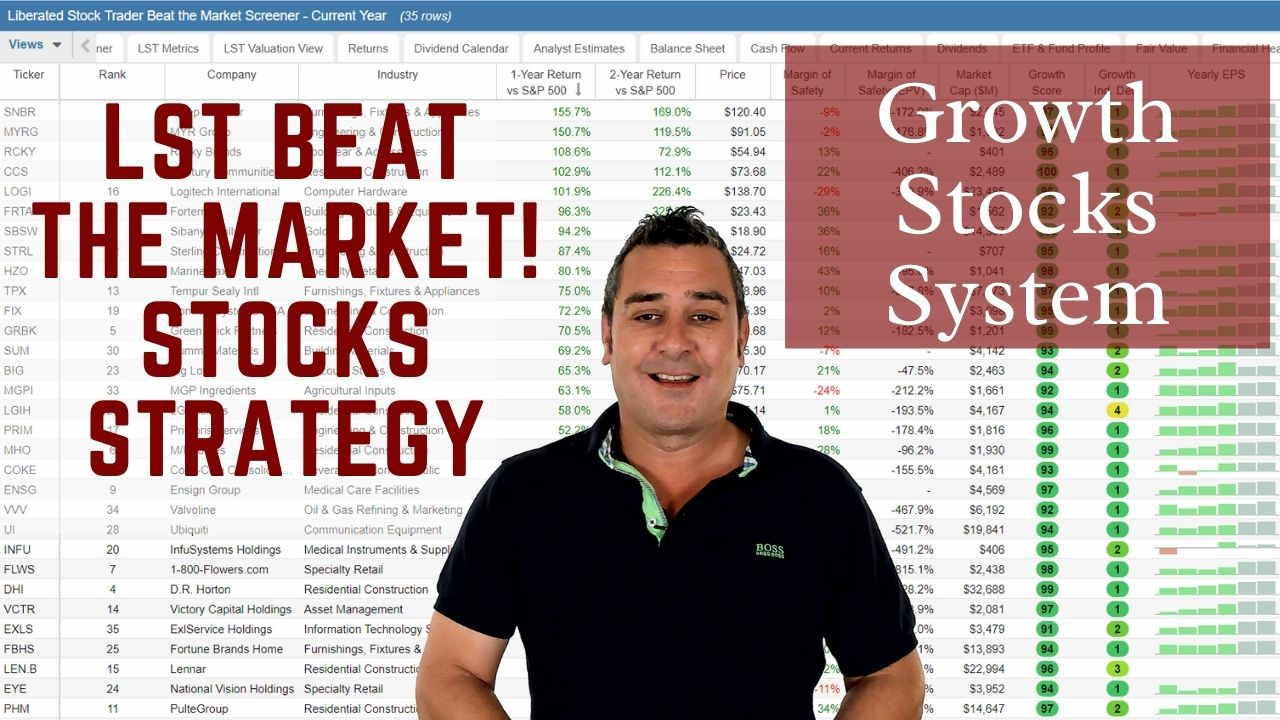
Decades of research and testing unveiled the Liberated Stock Trader Beat the Market System. Our 9-year, backtested, and proven strategy targets 35 financially| Liberated Stock Trader
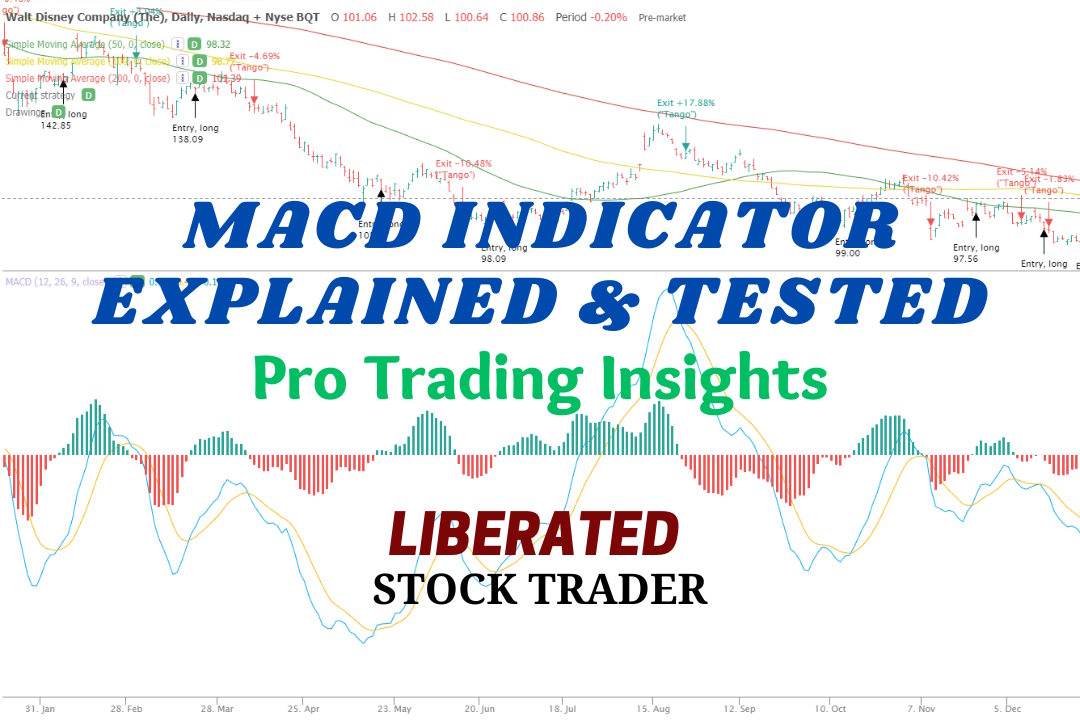
MACD is a trend-following momentum indicator used to identify price trends. We conducted 606,422 test trades to find the best settings and trading strategies.| Liberated Stock Trader
My research shows the most reliable and accurate bullish patterns are the cup-and-handle, with a 95% bullish success rate, head-and-shoulders (89%), double-bottom (88%), and triple-bottom (87%).| Liberated Stock Trader
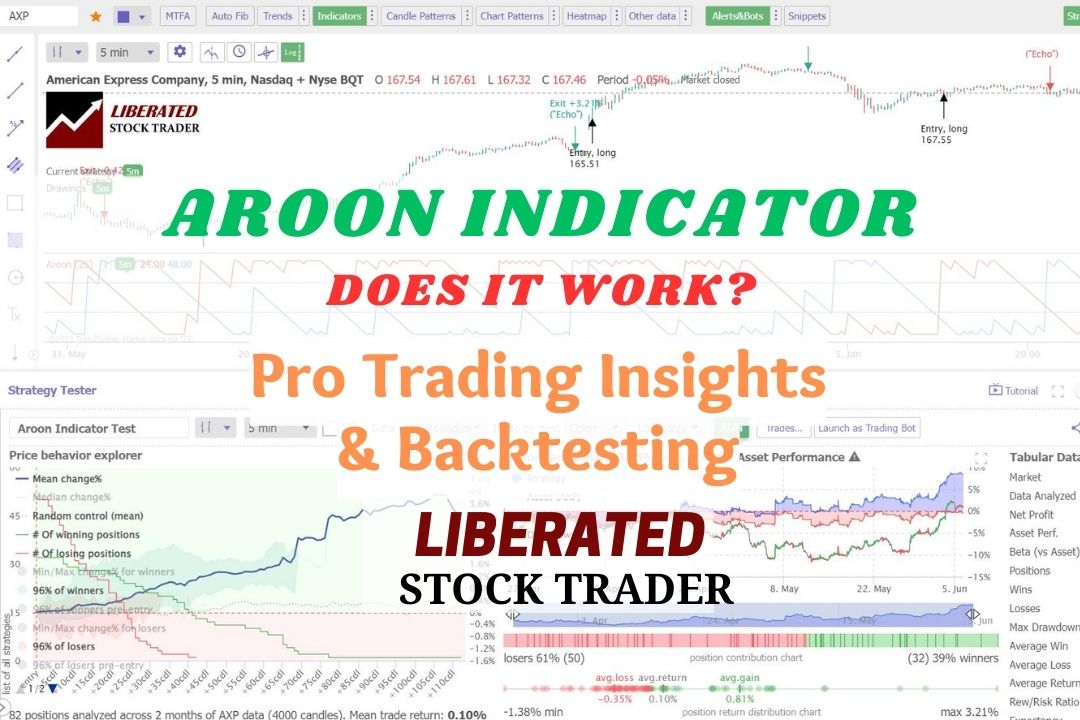
In technical analysis, the Aroon indicator identifies trend reversals and trend strength. This oscillating indicator has two parts: the "Aroon Up" line measures uptrend strength, and the "Aroon Down" line for downtrend strength.| Liberated Stock Trader
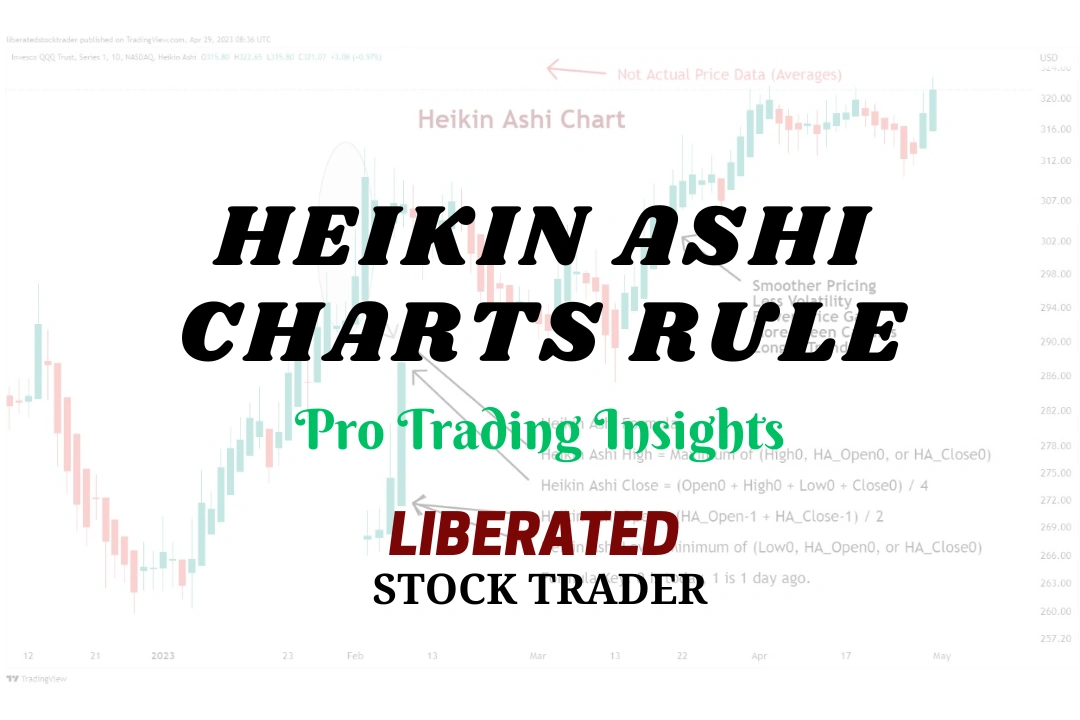
I backtested 360 years of data on the 30 most important US stocks, and our findings prove that Heikin-Ashi chart strategies outperform 66% of equities vs. a buy-and-hold strategy.| Liberated Stock Trader
Professional analysts define all stock market trends using timeframe and direction: Timeframes are short-term, medium-term, and long-term. Direction is described using uptrend, downtrend, or consolidation.| Liberated Stock Trader
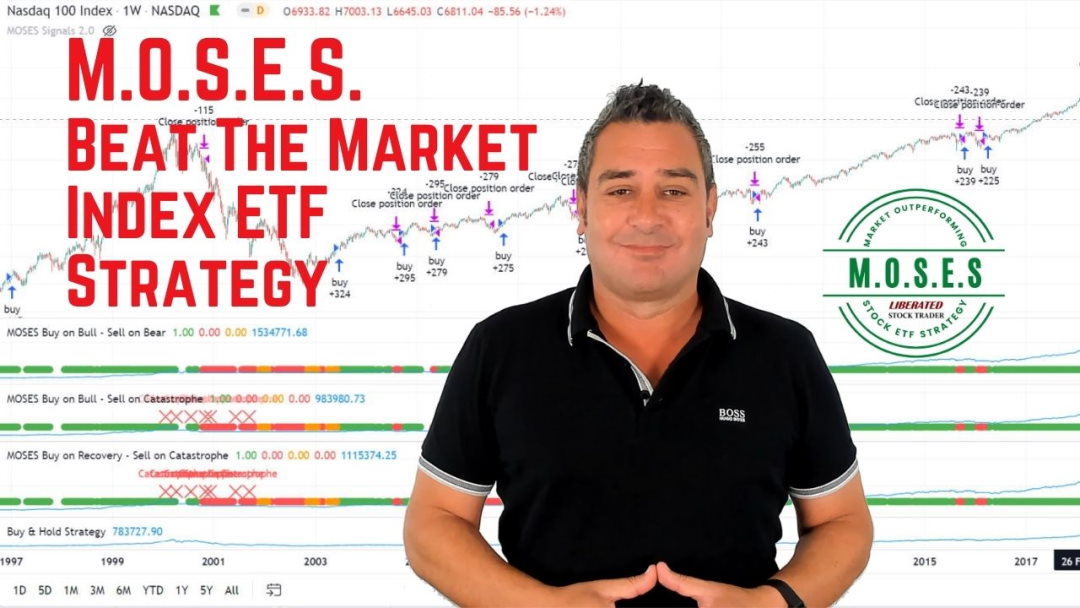
The MOSES ETF investing strategy is a powerful suite of indicators meticulously backtested over 100 years. Designed to empower you to outperform the market, it equips you with the tools to navigate major stock market crashes and unlock greater investing performance.| Liberated Stock Trader
The simple moving average (SMA) technical analysis indicator helps identify stock price trends. It calculates an arithmetic average of prices, offering a smooth line that eliminates short-term price volatility.| Liberated Stock Trader
I tested 23,487 RSI trades on 820 years of exchange data. When configured correctly, RSI can be highly profitable, with a 53% success rate and an average of 65% winning trades. The RSI setting of 14 on a 1-hour chart is the most reliable configuration for identifying profitable buy and sell signals.| Liberated Stock Trader
In my 40-day, 5-minute day trading test, pairing ROC with a Heikin Ashi chart outperformed the market 93% of the time, compared to 43% with classic candles, while increasing the win rate (55% vs. 45%) and reward-to-risk ratio (2.7 vs. 1.84).| Liberated Stock Trader
The best moving average settings are SMA or EMA 20 on a daily chart, which achieves a 23% win rate. At settings 50, 100, and 200, it is better to use the Hull moving average, which has win rates of 27%, 10%, and 17%, respectively.| Liberated Stock Trader
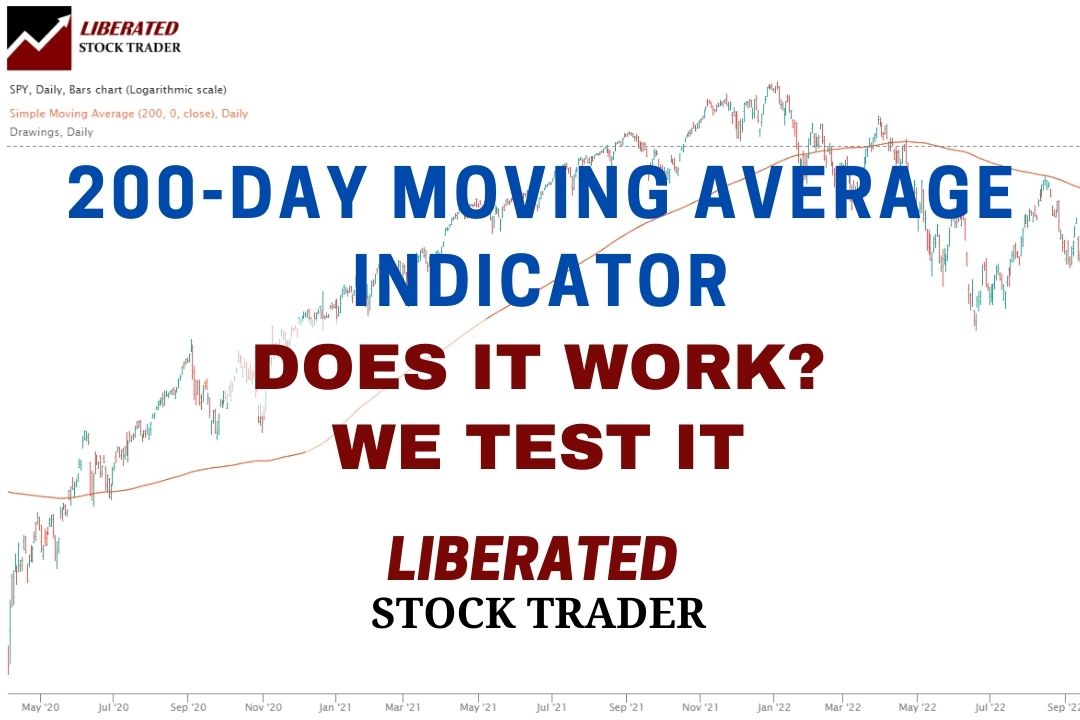
Our testing of the 200-day MA on the S&P500 over 16 years revealed that using this indicator is a losing proposition. A buy-and-hold strategy made a profit of 192% vs. the 200-day MA, which made only 152%.| Liberated Stock Trader
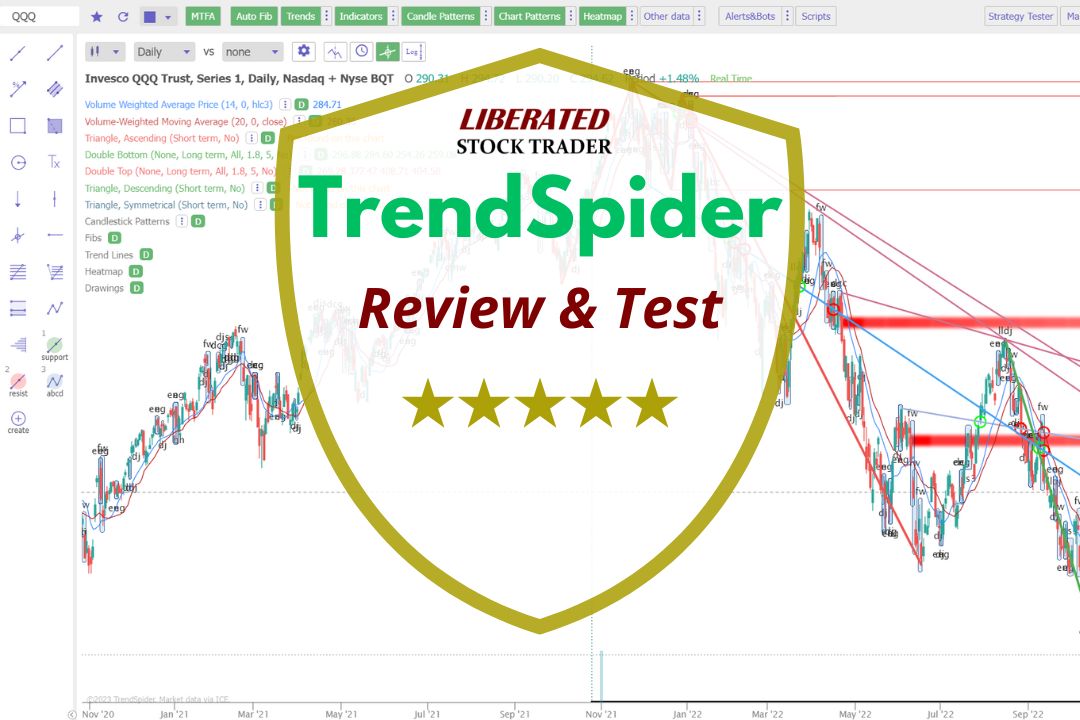
My in-depth testing shows that TradingView, TrendSpider, and Trade Ideas are the best tools for traders, and Stock Rover is superior for investors. Each provides unique benefits, features, and price points.| Liberated Stock Trader
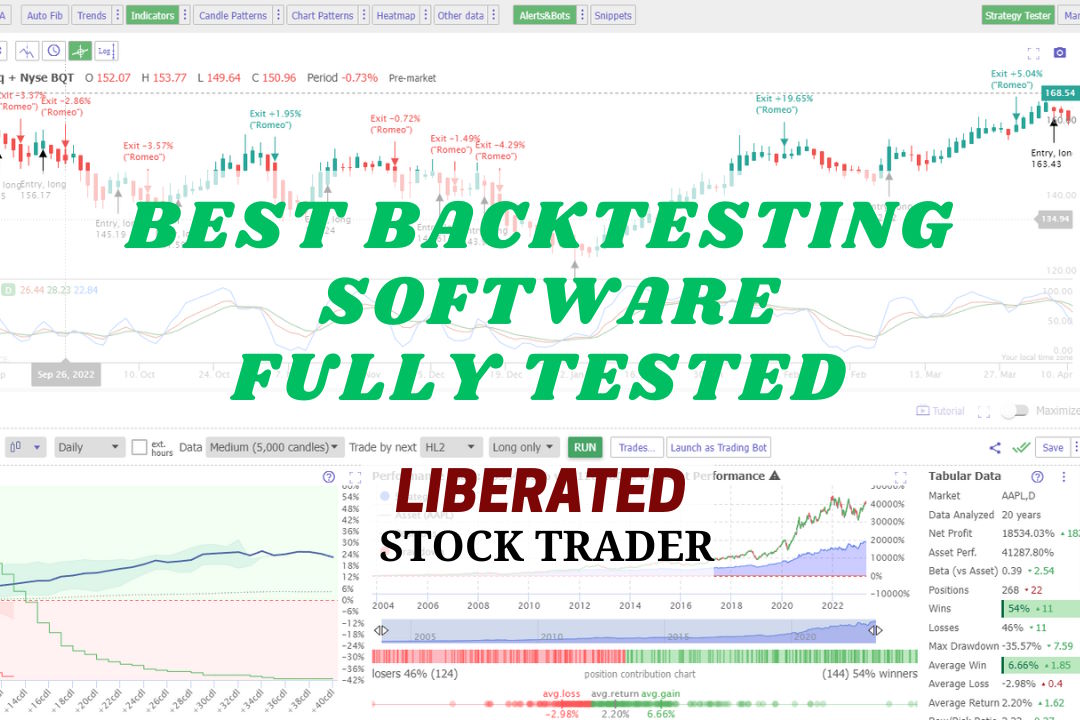
My research shows the best stock backtesting and auto-trade software are TrendSpider, Trade Ideas, and Tradingview. My testing process selected TrendSpider as the overall winner because it offers the most flexible, code-free, multilayer backtesting.| Liberated Stock Trader
My testing awards Trendspider 4.8/5 stars due to its innovation. Its powerful algorithms recognize trendlines, chart patterns, and candlesticks automatically. It also has automated trading bots, real AI LLMs, and powerful point-and-click back- testing.| Liberated Stock Trader