
CPU performance optimization guide - part 3 - AMD GPUOpen
We look at optimizing CPU performance by reducing the number of instructions, and highlights methods to enhance instruction efficiency and algorithm throughput.| gpuopen.com
We look at optimizing CPU performance by reducing the number of instructions, and highlights methods to enhance instruction efficiency and algorithm throughput.| gpuopen.com
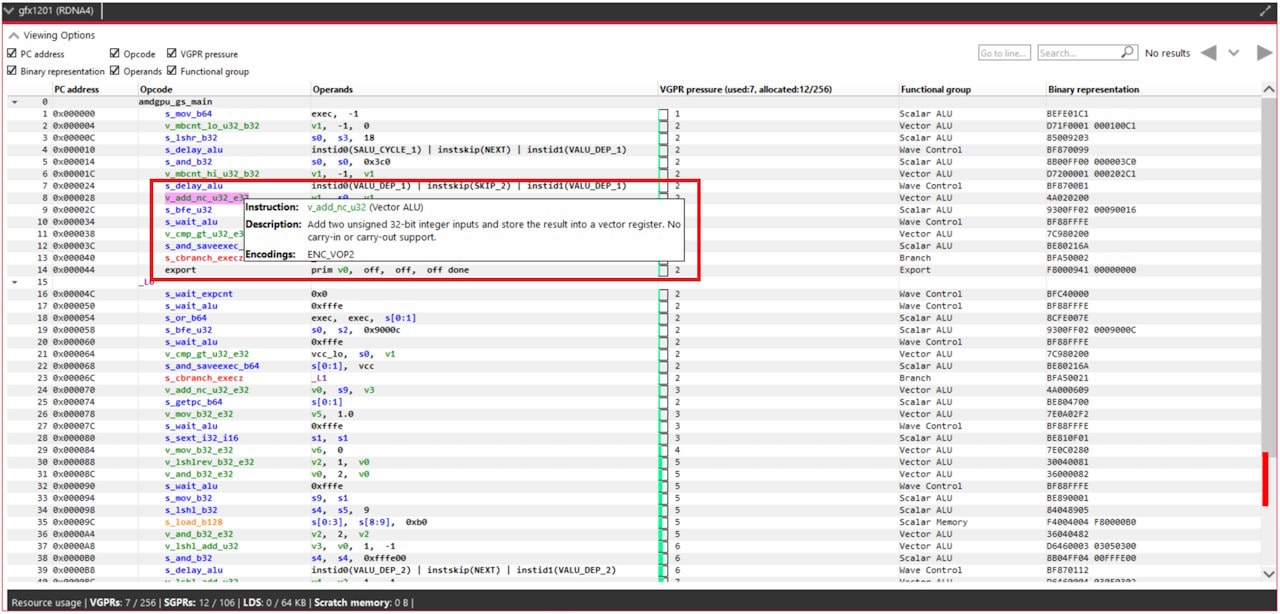
Explore Radeon GPU Analyzer v2.12's enhanced ISA disassembly view, making shader and kernel analysis easier with new tooltips and automatic highlighting. Optimize your GPU workflows effortlessly!| gpuopen.com
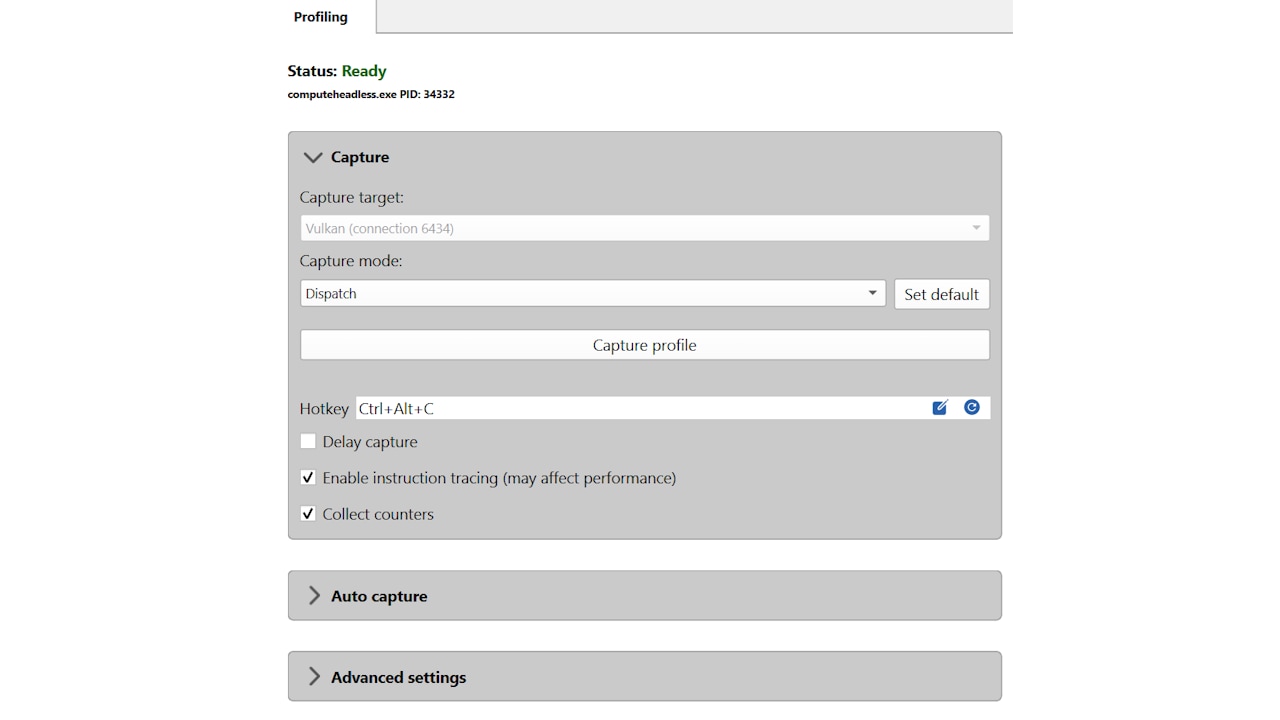
Discover the latest Radeon GPU Profiler v2.4, now supporting Radeon RX 9000 Series GPUs and profiling for pure compute and DirectML applications. Enhance your optimization with improved ISA views and Work Graphs support.| gpuopen.com
Unlock deeper insights into GPU crashes with Radeon GPU Detective v1.4's new Hardware Crash Analysis feature. Identify in-flight shaders and pinpoint crash culprits faster, streamlining your debugging process.| gpuopen.com
Explore Radeon Raytracing Analyzer v1.8, now supporting Radeon RX 9000 Series GPUs with enhanced BVH formats, including oriented bounding boxes and expanded node capacity.| gpuopen.com
Part 2 shares a real-world problem of cache invalidation in CPU performance optimization, explaining how different data structures, compilers, and CPUs affect caching behavior and performance, and provides benchmarking and analysis techniques to address these issues.| AMD GPUOpen
A simple C++ program demonstrating how easy it is to decode instructions using the IsaDecoder API.| AMD GPUOpen
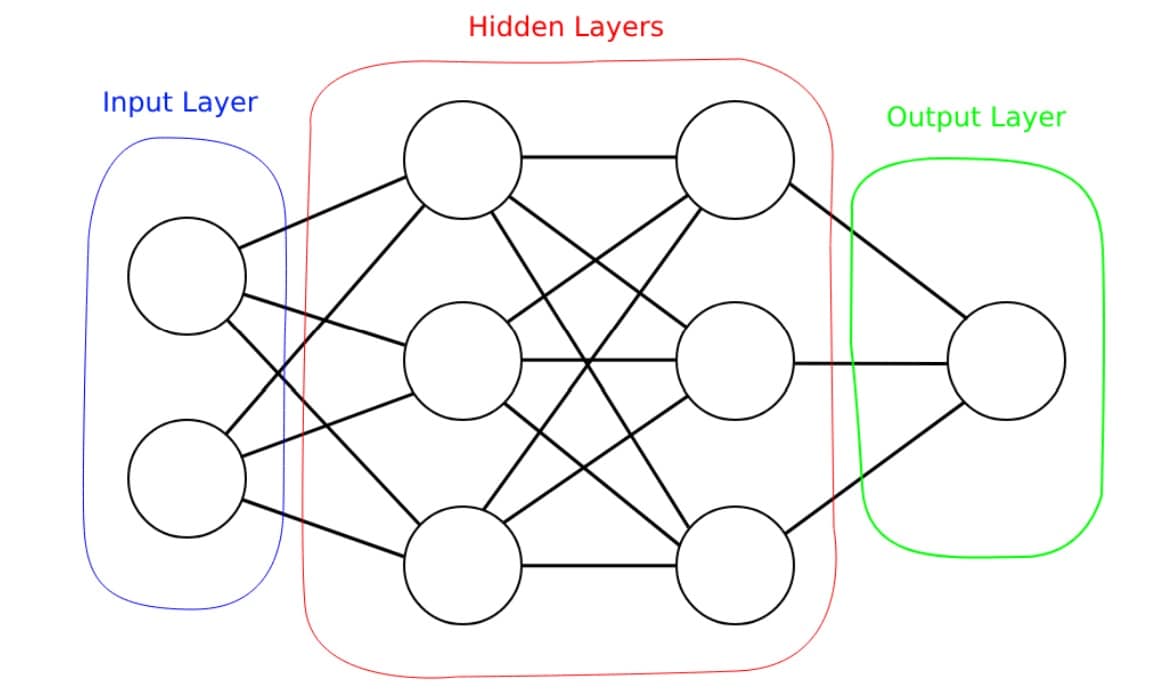
If you're a graphics dev looking to understand more about deep learning, this blog introduces the basic principles in a graphics dev context.| AMD GPUOpen
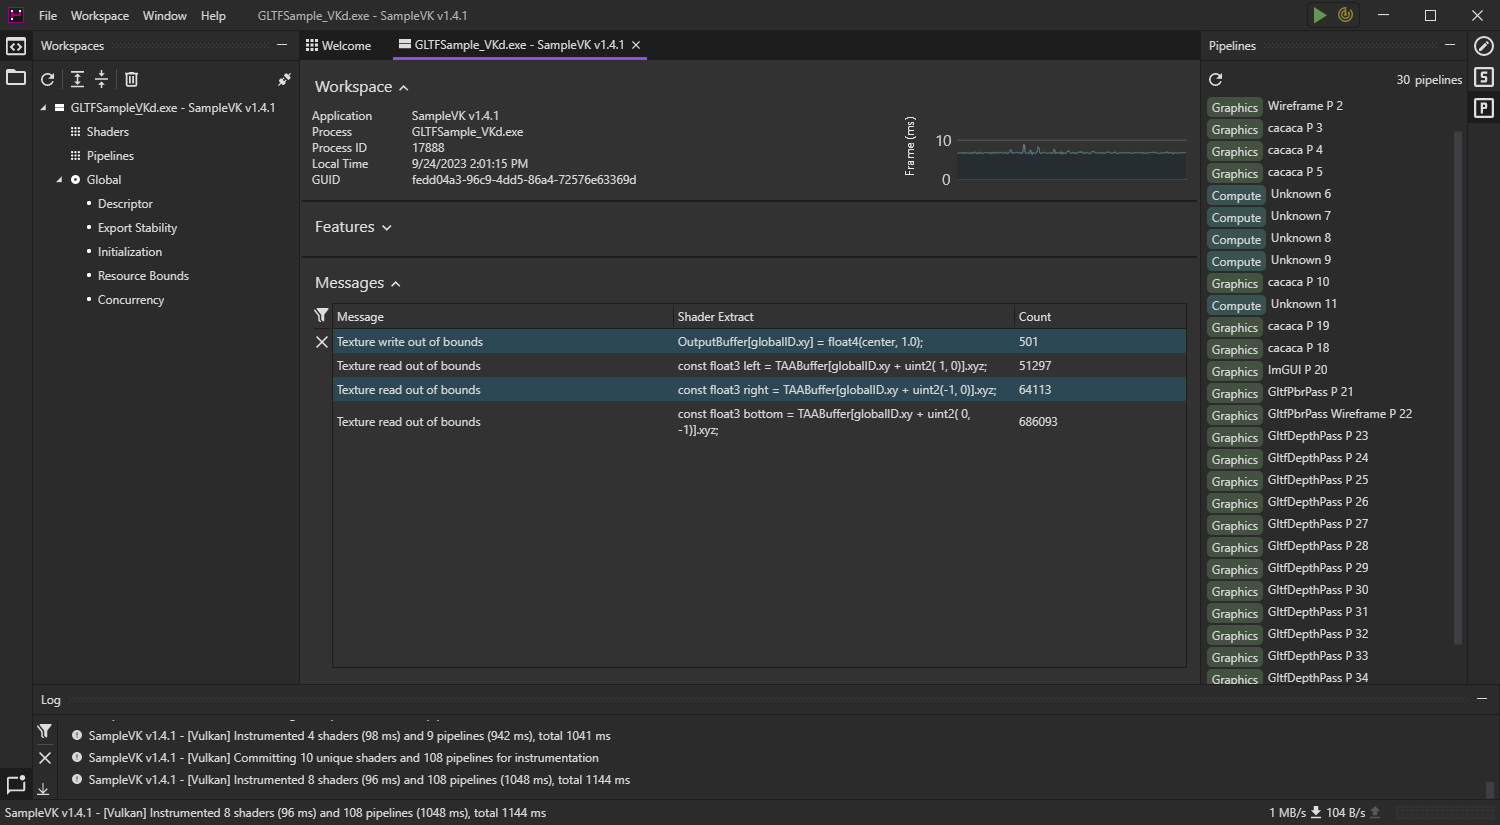
GPU Reshape brings powerful features typical of CPU tooling to the GPU, providing validation of dynamic behaviour. Read on for all of the details.| AMD GPUOpen
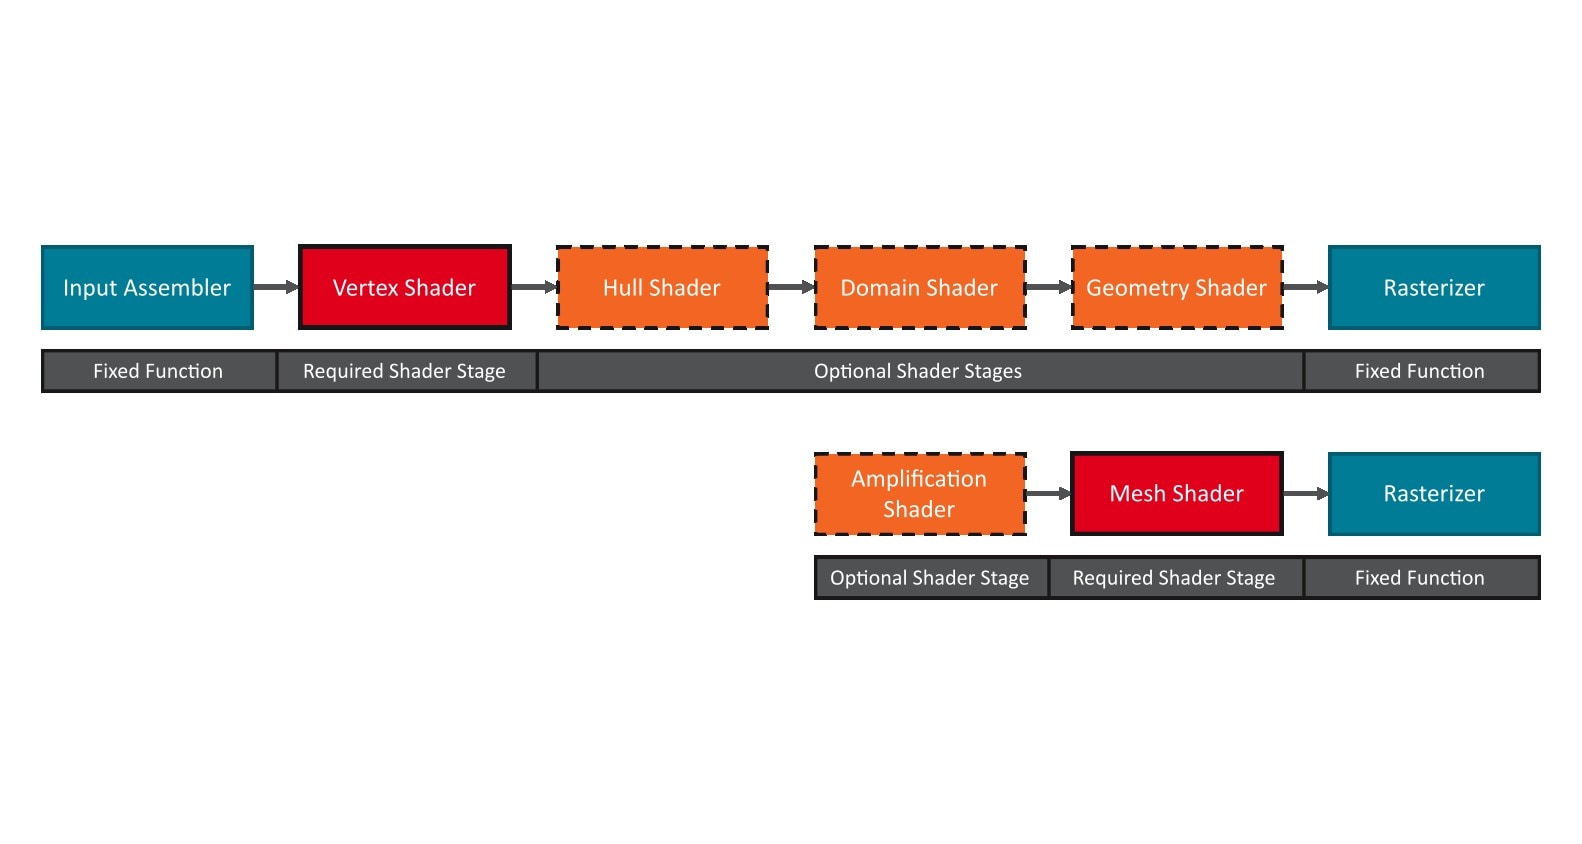
The second post in this series on mesh shaders covers best practices for writing mesh and amplification shaders, as well as how to use the AMD Radeon™ Developer Tool Suite to profile and optimize mesh shaders.| AMD GPUOpen
Radeon™ Memory Visualizer 1.8 is available now. v1.8 enhances the Resource usage size timeline to better visualize overlapped aliased resources.| AMD GPUOpen
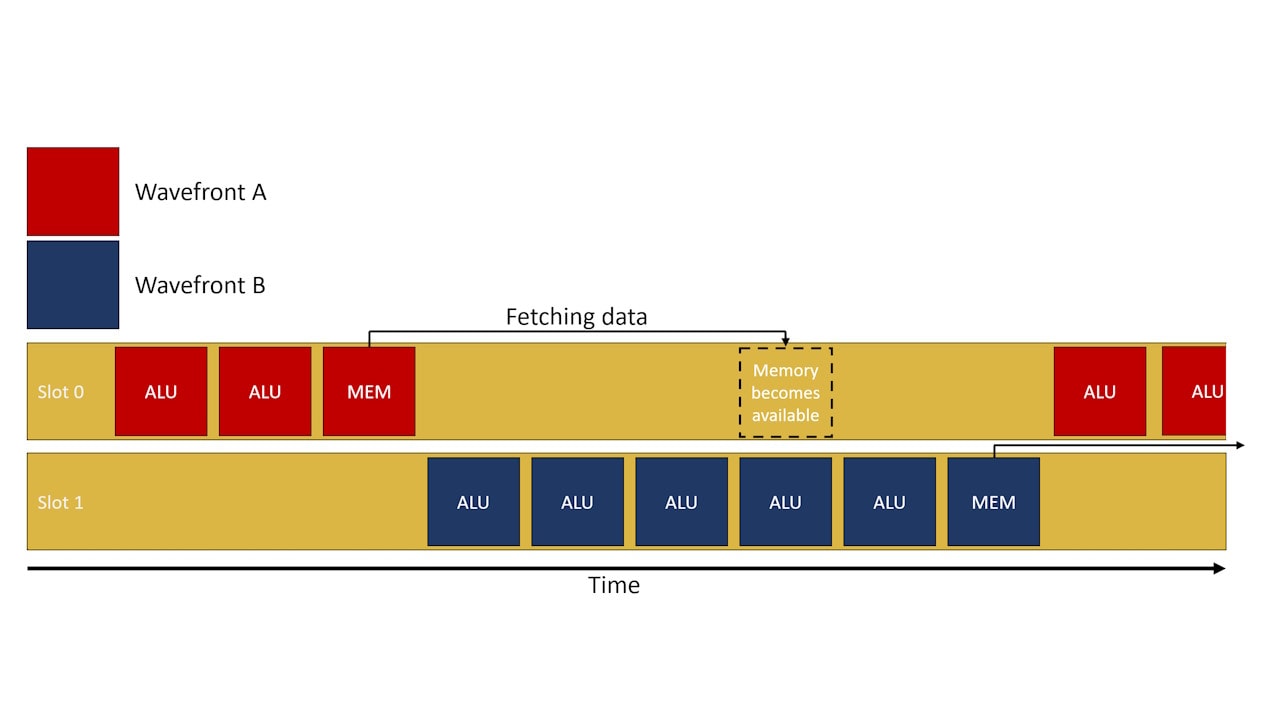
In this blog post we will try to demystify what exactly occupancy is, which factors limit occupancy, and how to use tools to identify occupancy-limited workloads.| AMD GPUOpen
