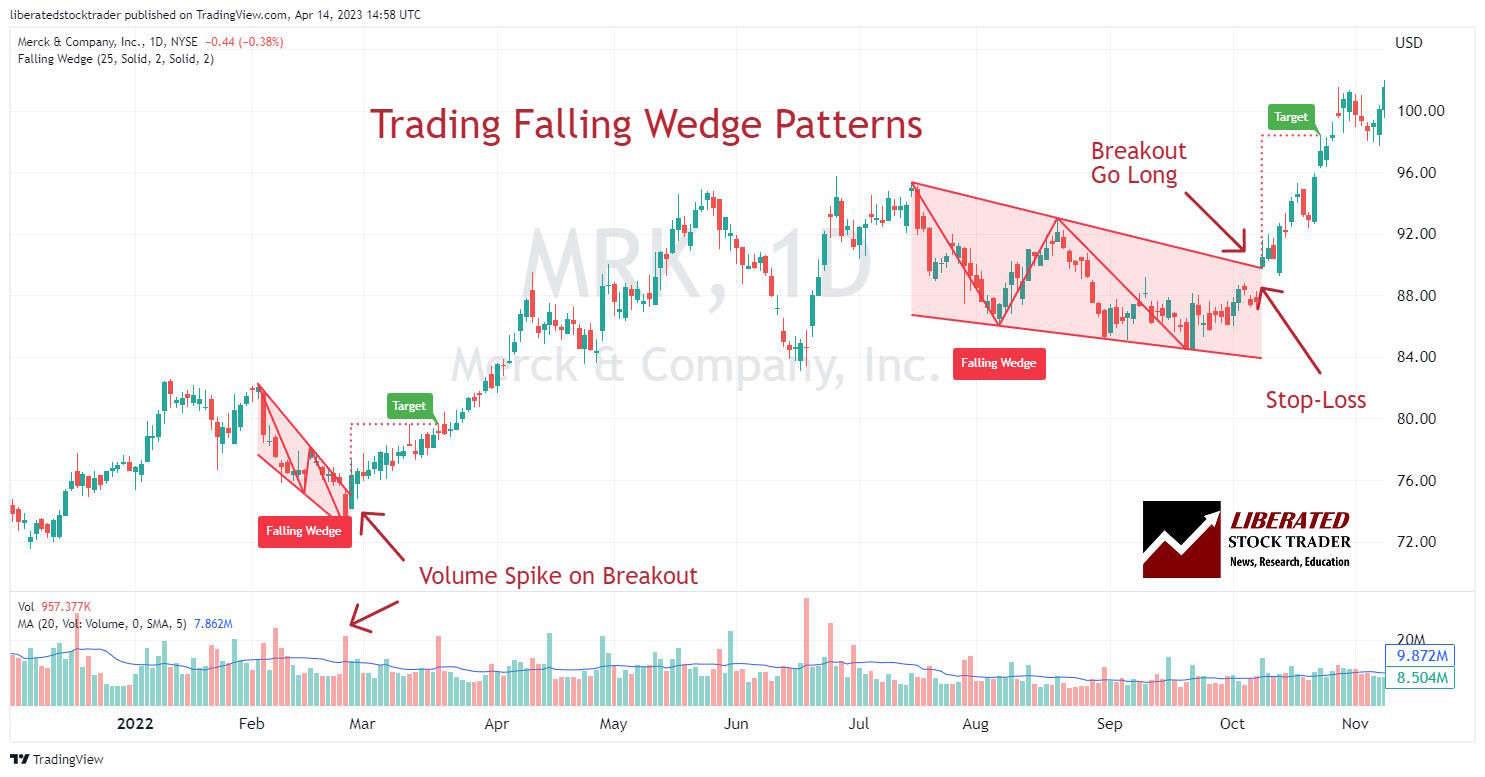
Trading a Falling Wedge for a 74% Success Rate and 38% Profit!
According to published research, the falling wedge pattern has a 74% success rate in bull markets with an average potential profit of +38%.| Liberated Stock Trader
According to published research, the falling wedge pattern has a 74% success rate in bull markets with an average potential profit of +38%.| Liberated Stock Trader

We explain the 101 most important stock market terms and decipher financial jargon with simple definitions and practical examples.| Liberated Stock Trader
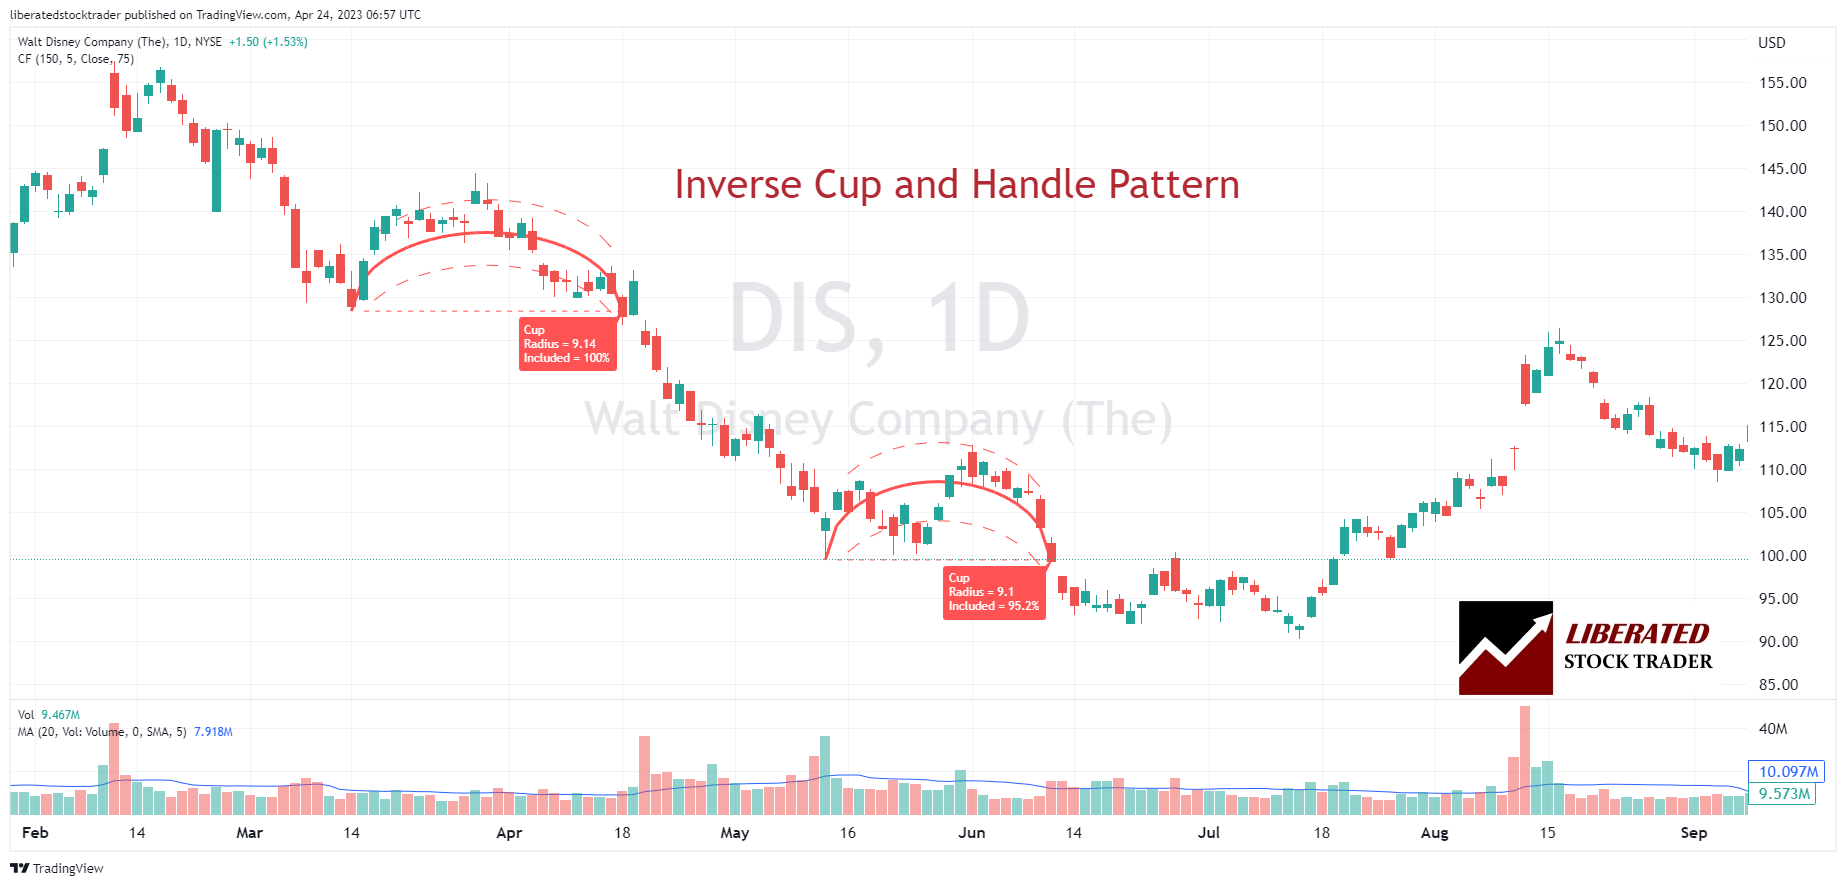
Two decades of trading research indicate that the inverse cup and handle pattern has an 82% success rate and average price drops of 17%. It is an ideal pattern for short-selling.| Liberated Stock Trader

Be careful when trading bearish flags. According to published research, the bear flag pattern has a low success rate of 45%. This means you are flipping a coin when trading this pattern, as the odds are not in your favor. The high-tight bear flag is the only flag pattern you should trade.| Liberated Stock Trader
Decades of research have proven the most predictable bearish chart patterns are the inverted cup-and-handle, with an average price decrease of 17%, the rectangle top (-16%), head-and-shoulders (-16%), and the descending triangle (-15%).| Liberated Stock Trader
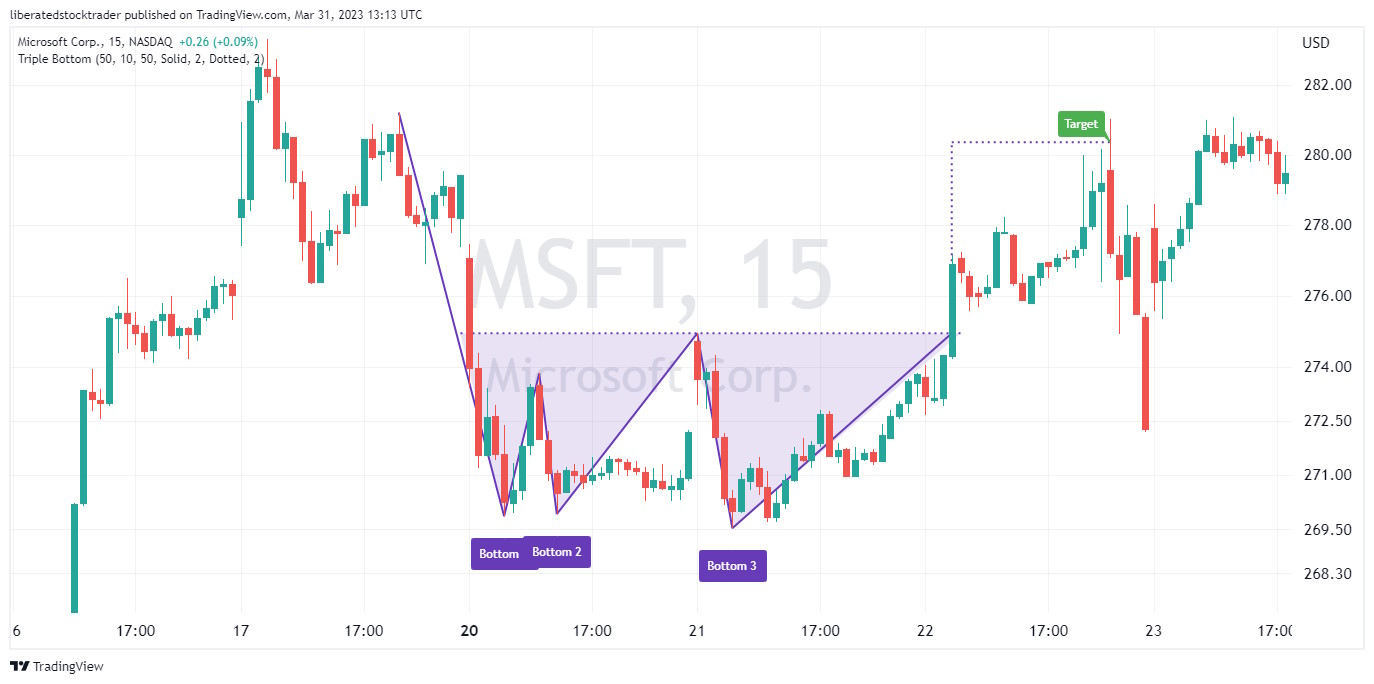
Decades of trading research show the triple-bottom pattern has an 87% success rate in bull markets and an average profit potential of +45%. The triple bottom chart pattern is popular because it is reliable and accurate and generates a good average profit for traders.| Liberated Stock Trader
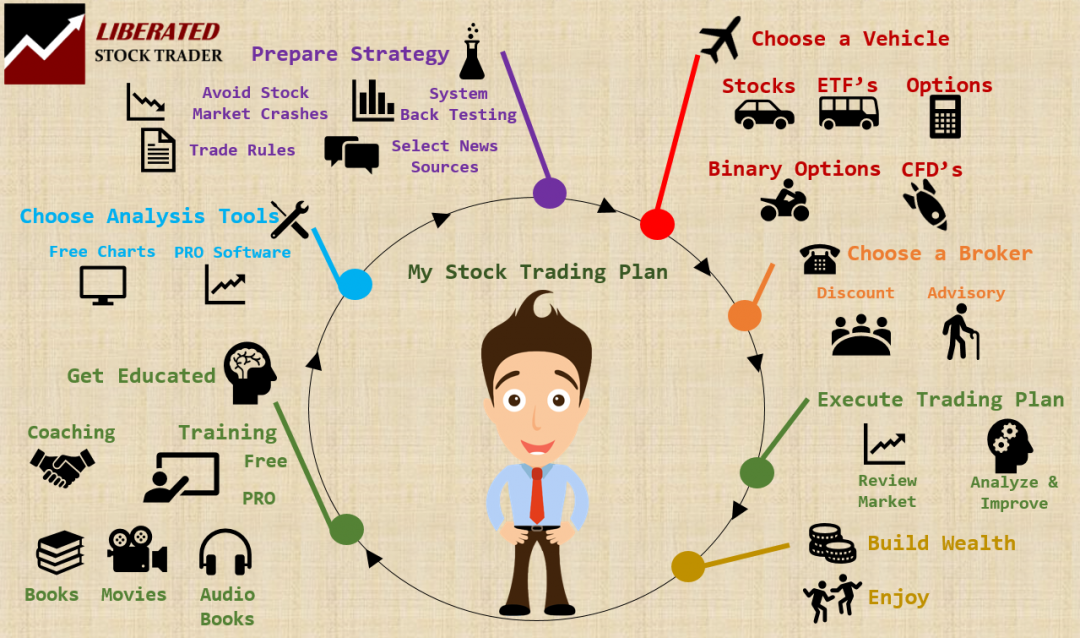
I believe the best ways to learn stock trading include books, audiobooks, data-backed analytical research, and reputable investing courses taught by industry-certified instructors.| Liberated Stock Trader
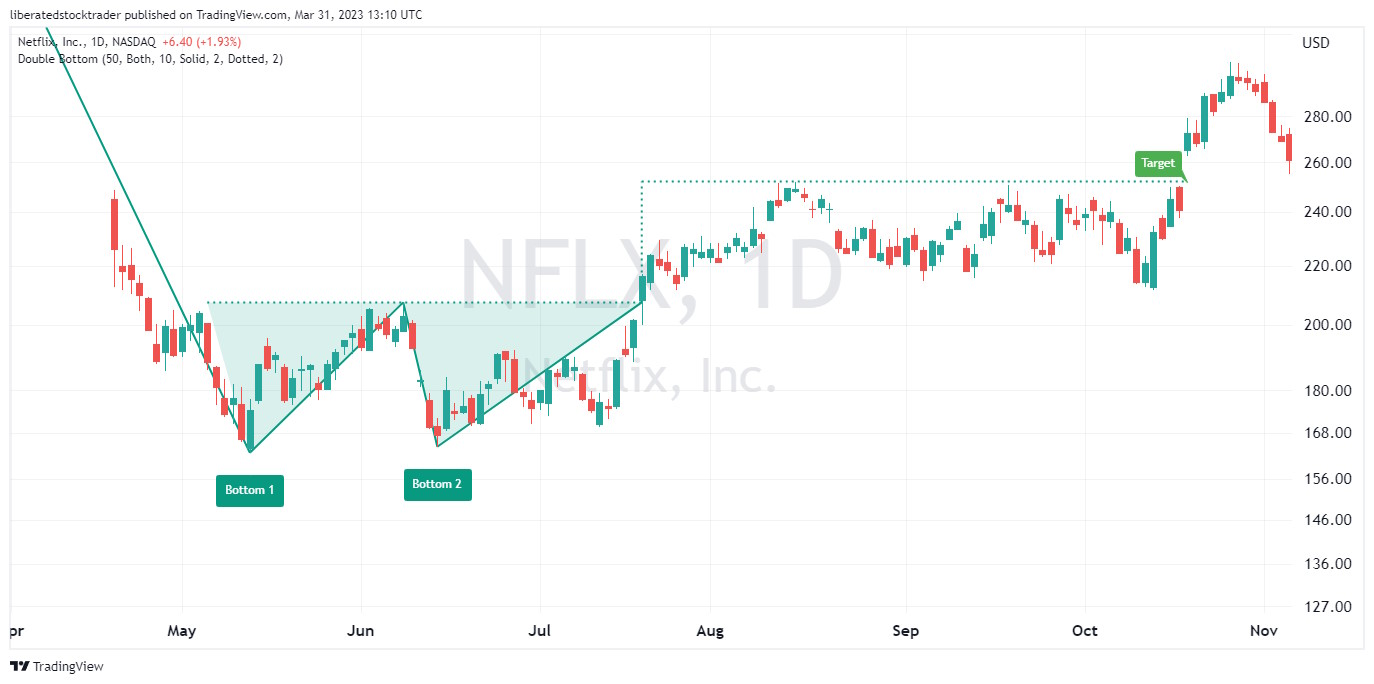
Decades of research reveal the double bottom pattern has an 88% success rate in bull markets and an average profit potential of +50%. The double-bottom chart pattern is one of the most reliable and accurate chart indicators in technical analysis.| Liberated Stock Trader
My research shows the most reliable and accurate bullish patterns are the cup-and-handle, with a 95% bullish success rate, head-and-shoulders (89%), double-bottom (88%), and triple-bottom (87%).| Liberated Stock Trader
Research shows that the most reliable chart patterns are the Head and Shoulders, with an 89% success rate, the Double Bottom (88%), and the Triple Bottom and Descending Triangle (87%). The Rectangle Top is the most profitable, with an average win of 51%, followed by the Rectangle Bottom with 48%.| Liberated Stock Trader
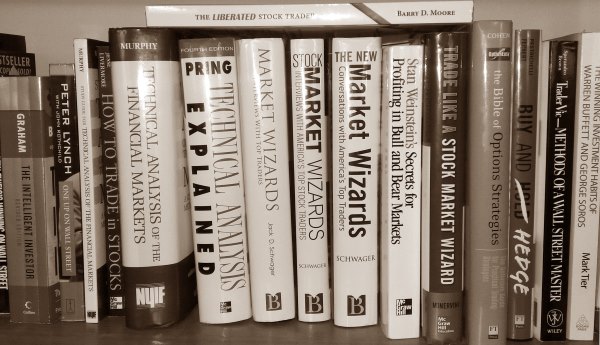
The best technical analysis books leading industry bodies recommend are Technical Analysis of the Financial Markets, Technical Analysis Explained, Cloud Charts, and Forecasting Financial Markets.| Liberated Stock Trader
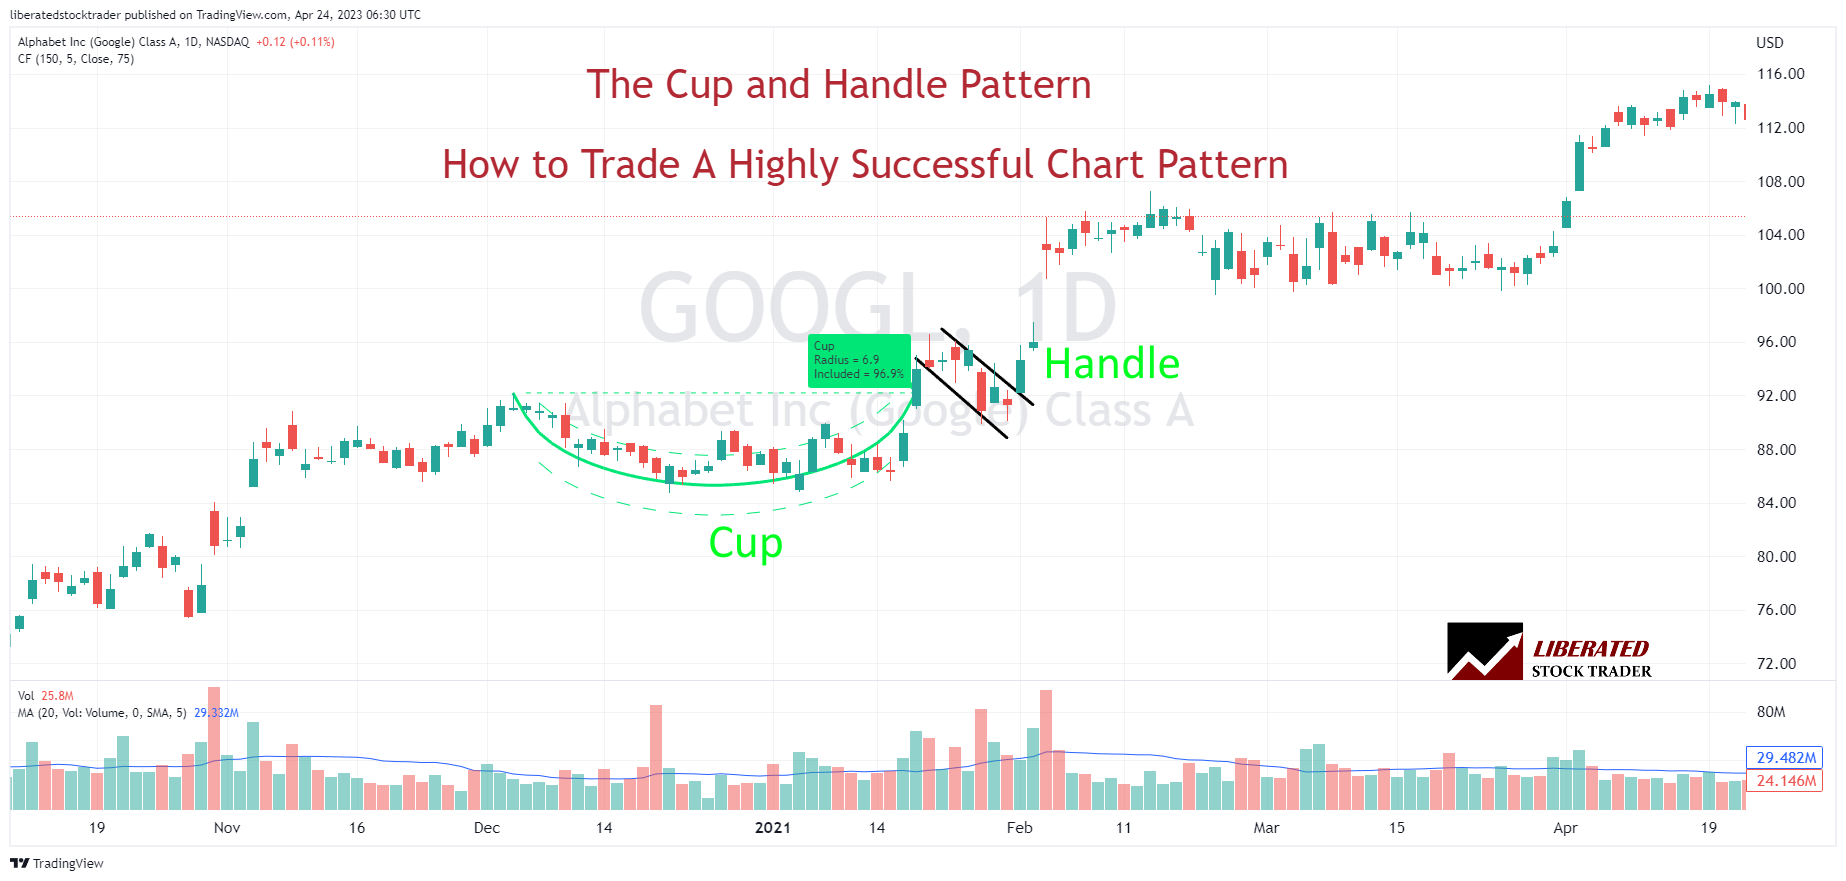
Twenty years of trading research show that the cup and handle pattern has a 95% success rate in bull markets and returns an average profit of +54%.| Liberated Stock Trader
