My research indicates that the most effective chart types for traders are Heikin-Ashi, Candlestick, OHLC, Raindrop, and Renko charts. These charts provide the optimal balance of price and trend reversal information to help investors develop effective trading strategies.| Liberated Stock Trader
Most AI trading tools do not use real AI machine learning and large language models. The majority of self-proclaimed AI trading tools are algorithmic and do not actually learn.| Liberated Stock Trader
As a Professional market analyst, I build effective trading strategies using techniques such as indicator divergences, multi-time frame analysis, indicator combinations, and rigorous backtesting.| Liberated Stock Trader
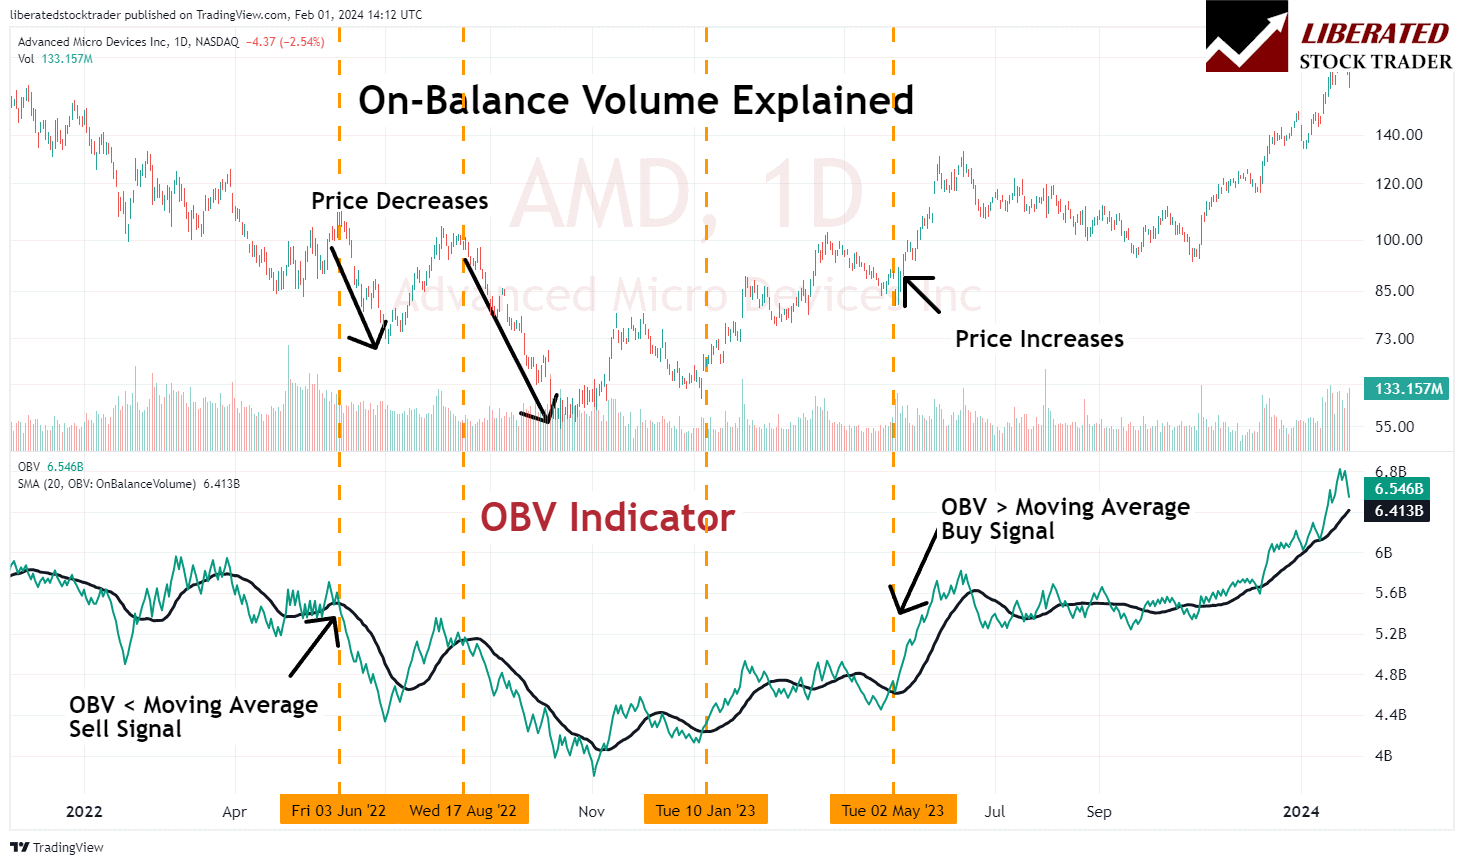
On-balance volume (OBV) is a cumulative indicator in technical analysis designed to show the volume flow relative to a security's price movements. The OBV reflects the collective buying and selling pressure crystallized through the volume trend.| Liberated Stock Trader
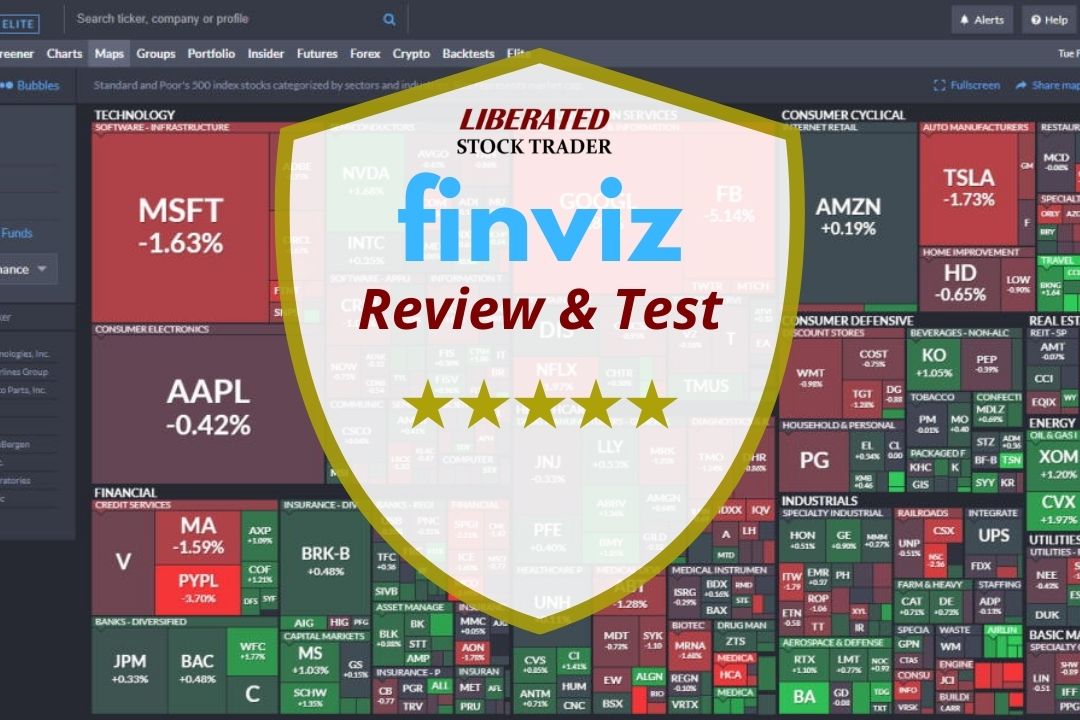
After hands-on testing, I found Finviz to be a powerful free stock screener, swift market heatmaps and impressive stock chart pattern recognition.| Liberated Stock Trader
The average true range (ATR) is a nondirectional momentum indicator that measures price volatility. Our 1,205 test trades showed a solid 1.77 reward-to-risk ratio with an average 8.5% winning trade.| Liberated Stock Trader
Data-driven research, education, and insights for independent investors. We test charts, patterns, indicators, and develop unique growth, dividend, and value investing strategies.| Liberated Stock Trader
TradingView scores 4.8/5.0 because it does everything well, and Finviz scores 4.3/5.0 because it lacks a community, live trading, and has inferior charts. However, Finviz excels at rapidly visualizing vast stock market data on a single screen.| Liberated Stock Trader
TradingView's depth of features is the key difference versus TC2000. TC2000 offers powerful charts, scanning, and stock and options trading in the USA. But TradingView enables charting, screening, backtesting, and trading stocks, forex, futures, and crypto globally.| Liberated Stock Trader
My testing of TradingView vs. TrendSpider reveals that TrendSpider is best for AI-automated pattern recognition, scanning, backtesting, and auto-trading.| Liberated Stock Trader
To consistently beat the market is difficult but not impossible. O'Neill, Greenblatt, Buffett, and Klarman are legendary investors who have beaten the market. I test the strategies and show you the best ways to implement them.| Liberated Stock Trader
Yes, options trading is similar to gambling if you are betting on the direction of a stock. Options are more like insurance if you use them to protect against losses in assets you own.| Liberated Stock Trader
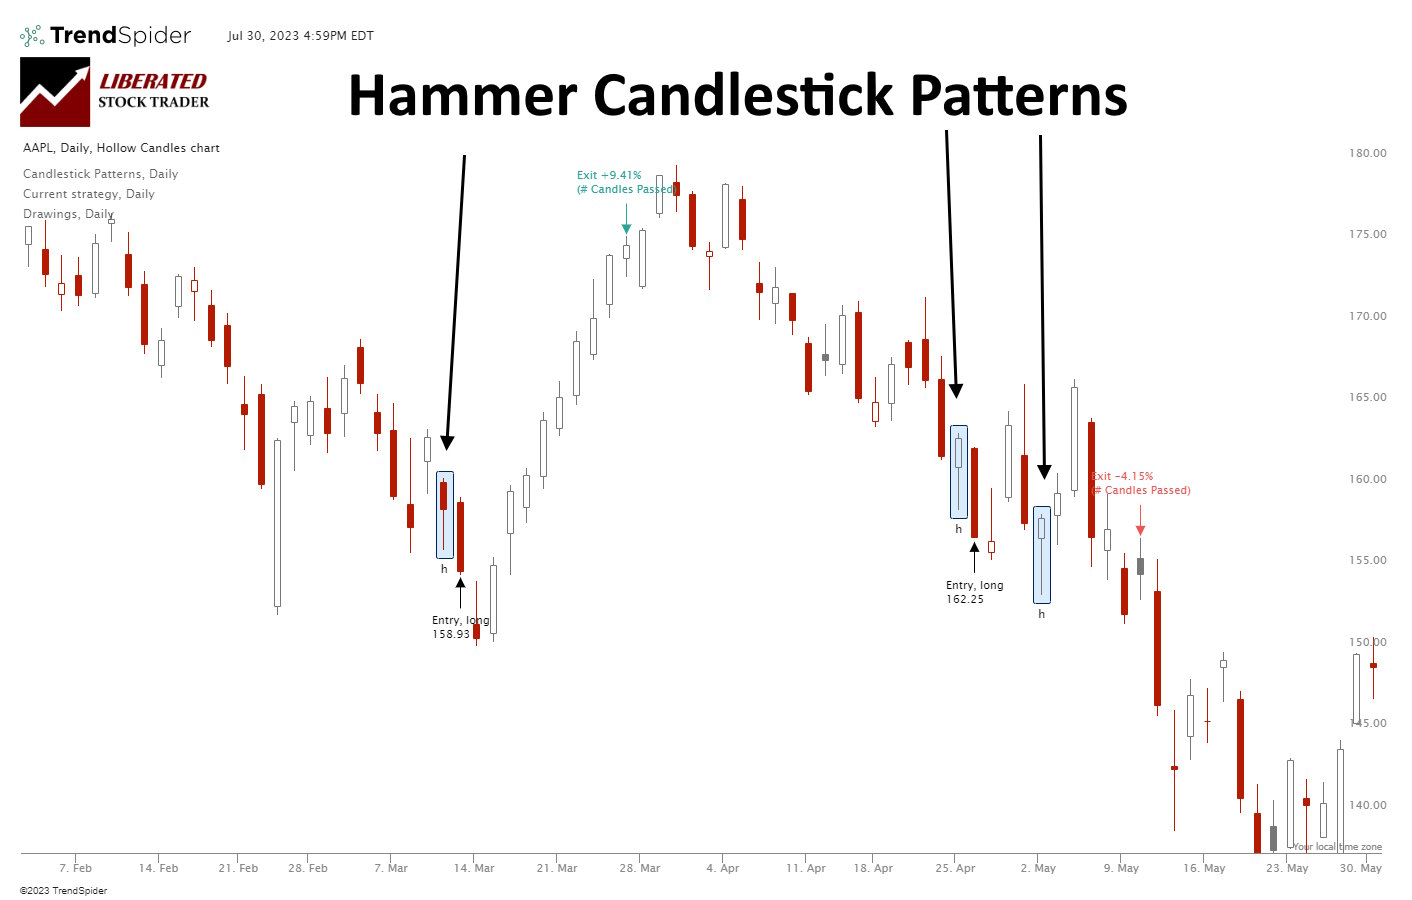
According to 2,219 tested trades, a Hammer is extremely unreliable and unprofitable. It has a low % accuracy rate of 52.1%, resulting in a razor-thin 0.18% profit per trade.| Liberated Stock Trader
In technical analysis, Fibonacci retracement is used by traders to predict levels of support and resistance by drawing horizontal lines according to the Fibonacci sequence. But Does It Work?| Liberated Stock Trader
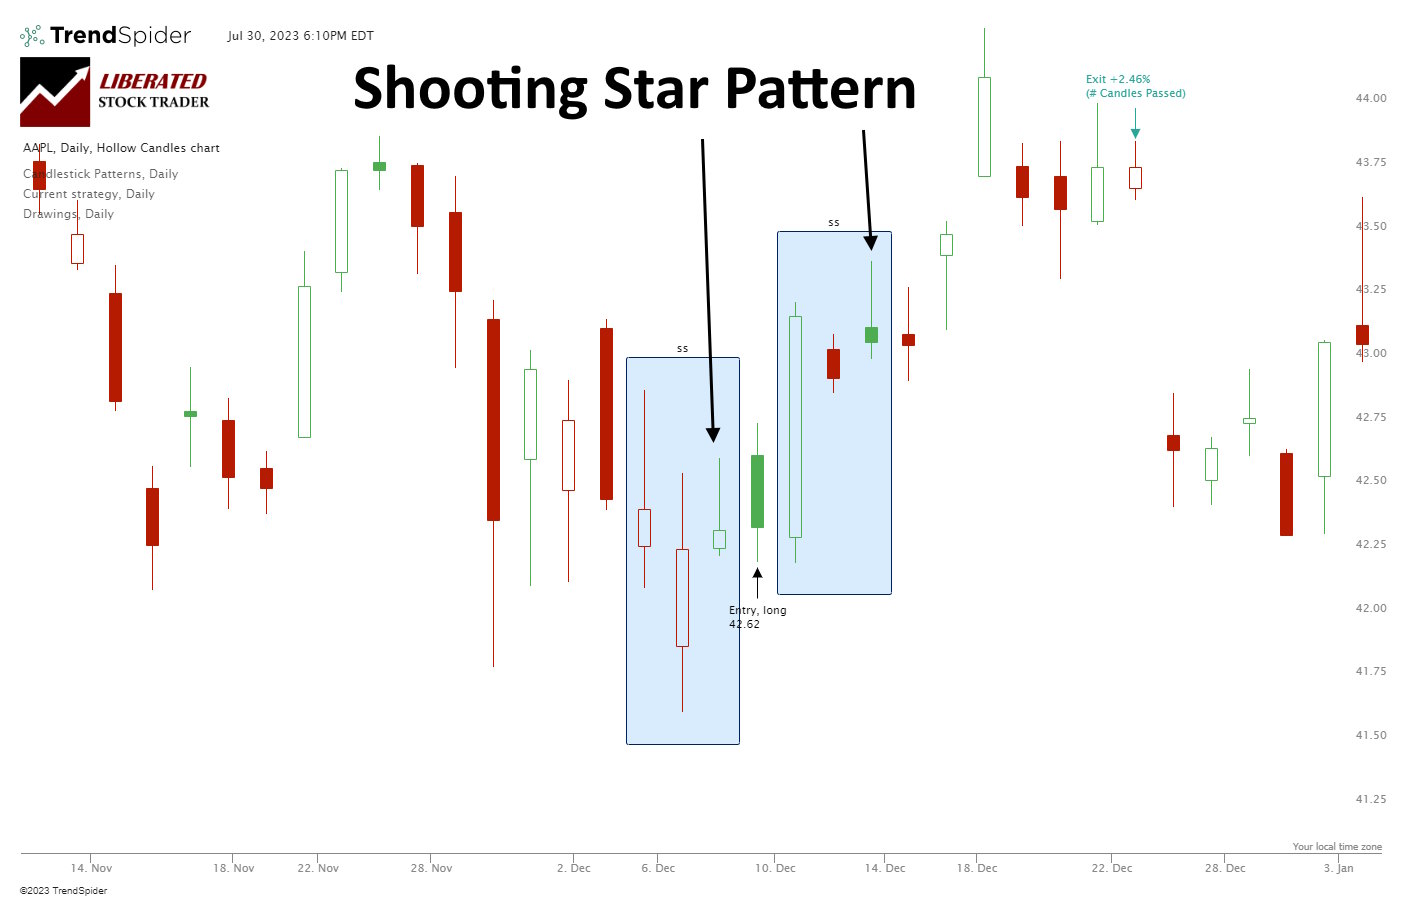
Based on our 568 years of backtested data, the Shooting Star candle is profitable. It has a 57.1% upside success rate and an average winning trade of 3.6%. Each trade made using a shooting star nets an average of 0.56% profit.| Liberated Stock Trader
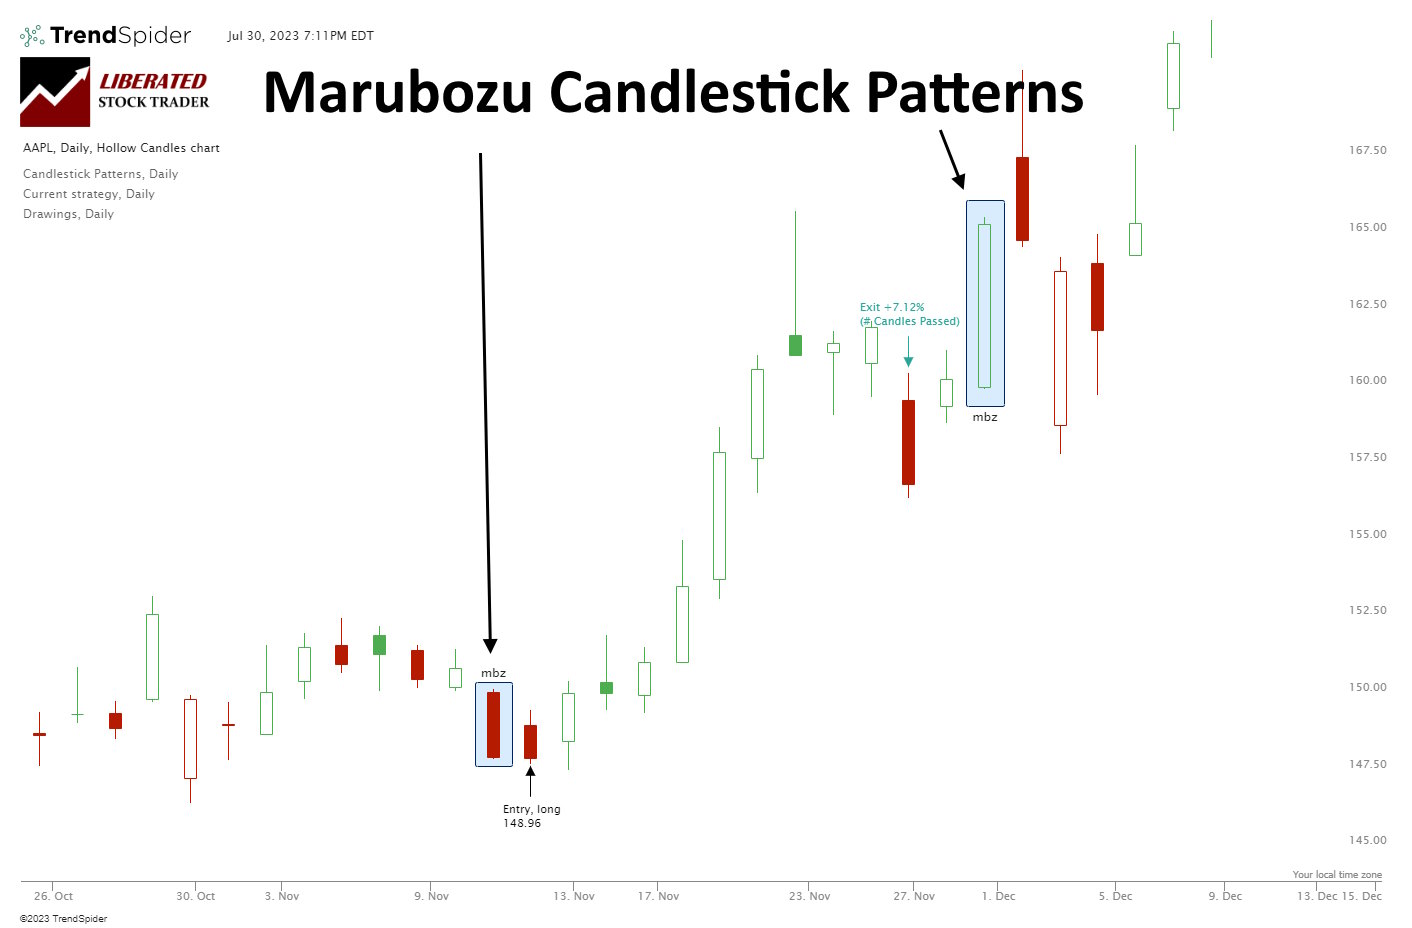
Our research shows Bearish Marubozu candles are among the most profitable patterns. Based on 568 years of data, it has a 56.1% success rate and an average win of 4.1%. Conversely, the Bullish Marubozu is one of the worst.| Liberated Stock Trader
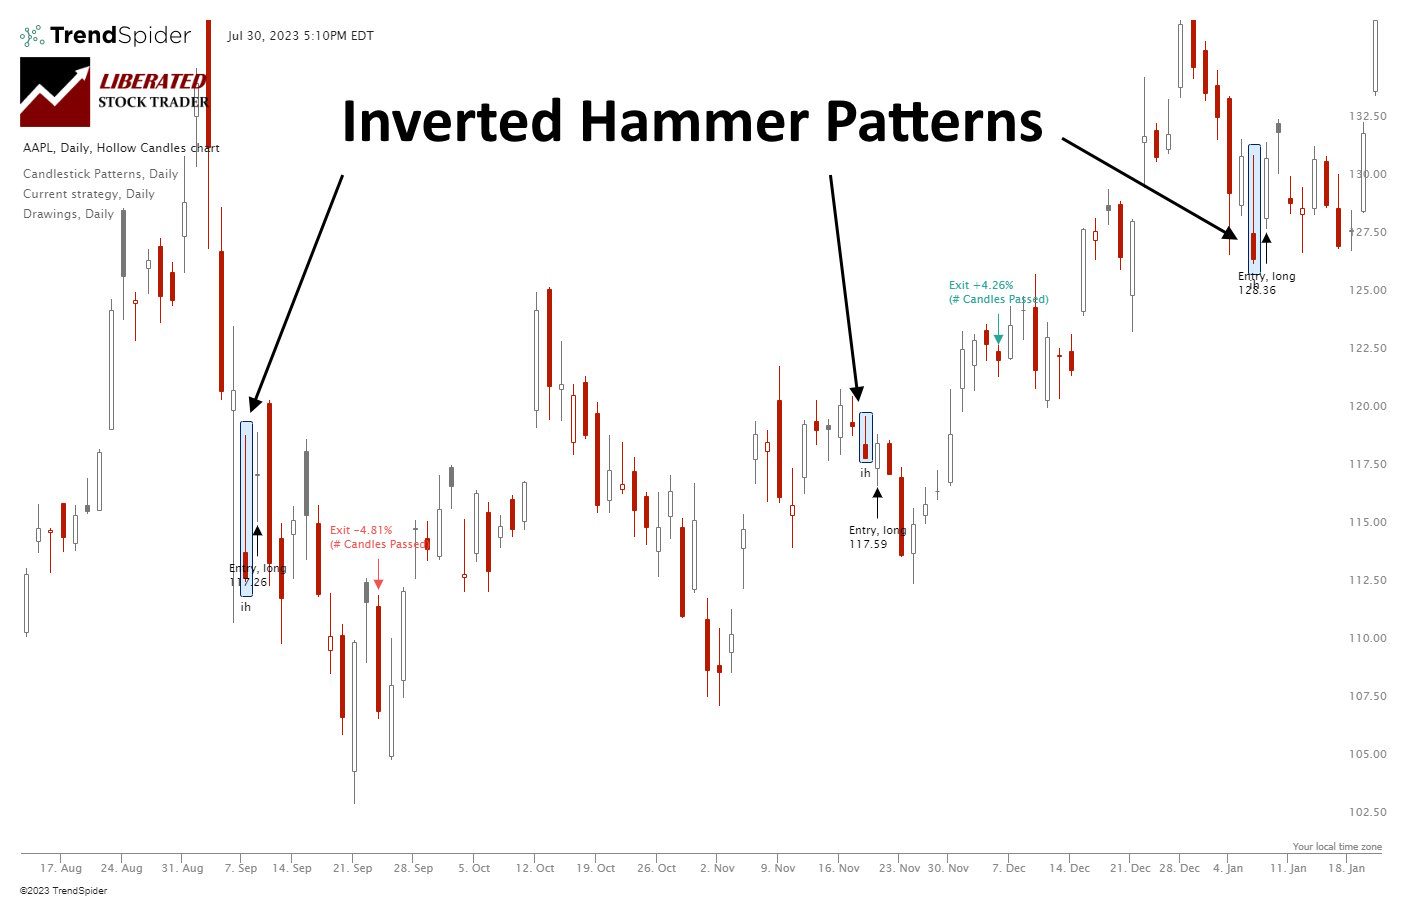
Our research shows the Inverted Hammer is the most accurate and profitable candlestick pattern. Used as a bullish signal, it has a 60% success rate and an average win of 4.2%, based on 588 years of data.| Liberated Stock Trader
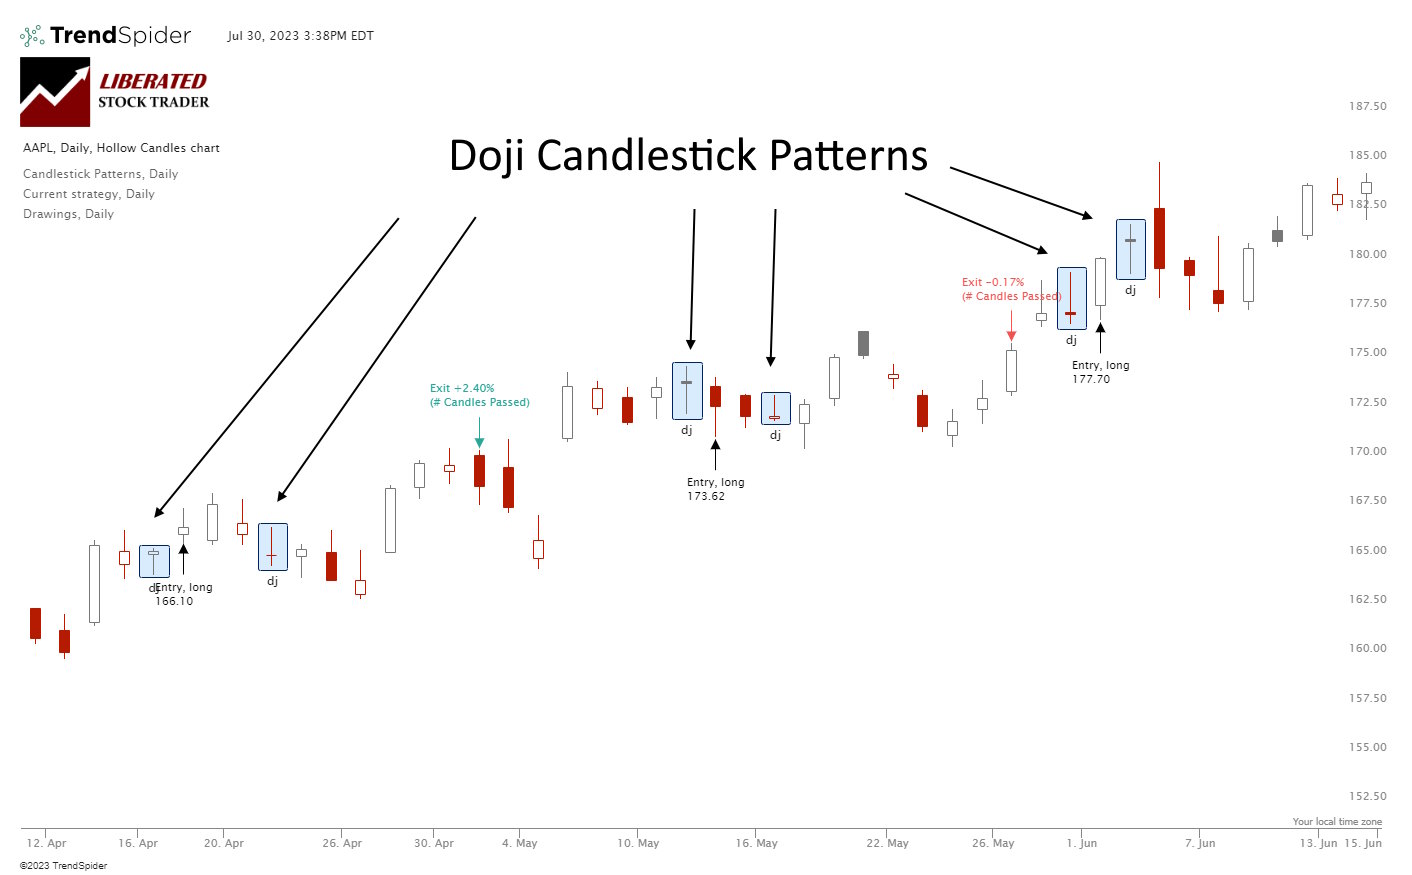
A Doji candlestick chart pattern indicates a battle between buyers and sellers, ending in equilibrium. The Doji marks a potential trend reversal. Is the Doji pattern profitable or accurate? Our evidence suggests its profitability is marginal.| Liberated Stock Trader
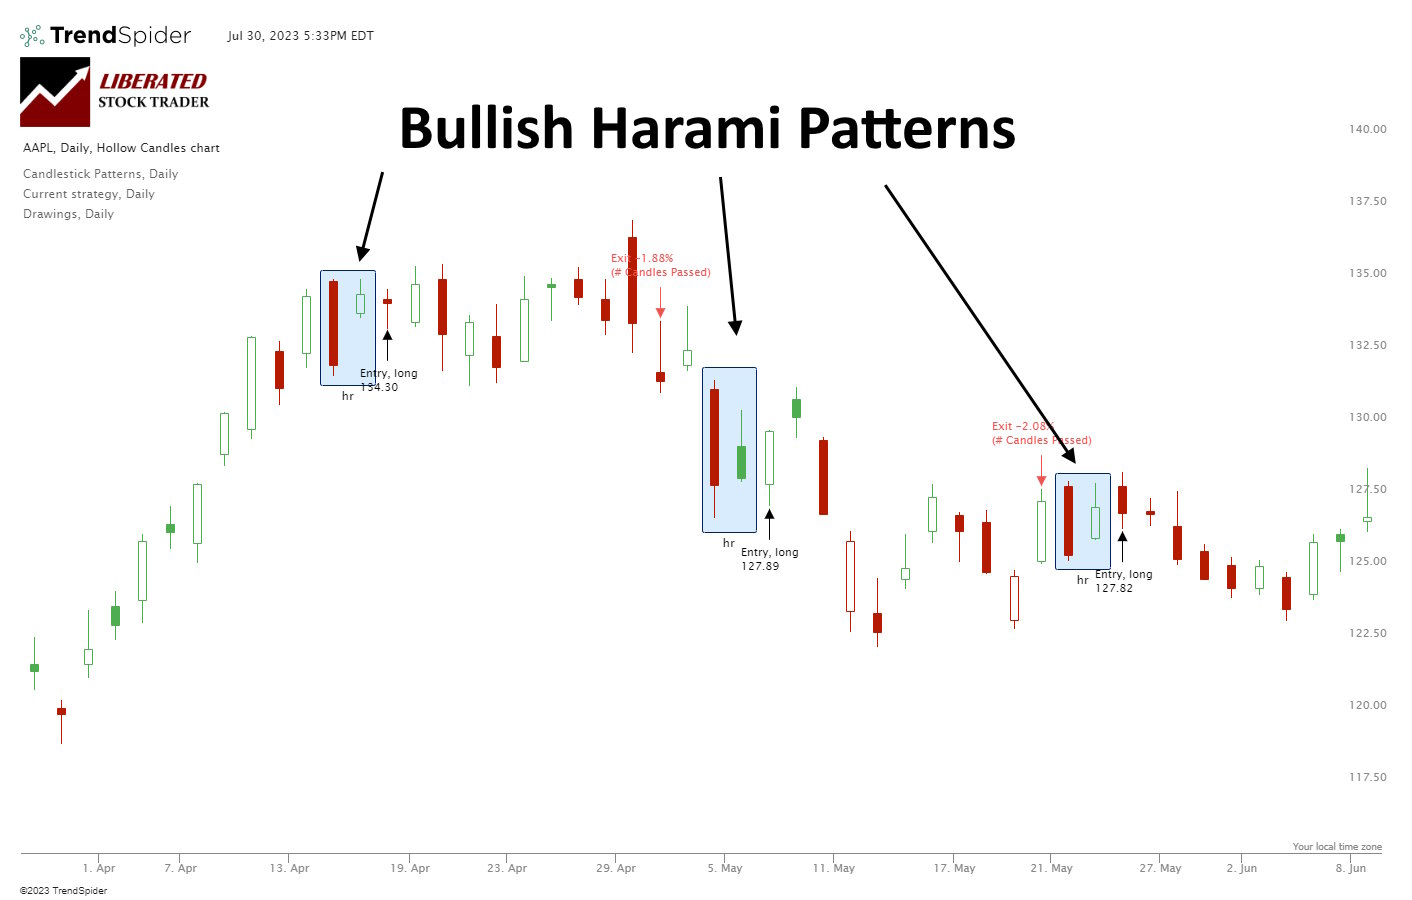
Our research shows Bullish Harami and Bullish Harami Cross are profitable patterns. Based on 1,112 years of data, the bullish Harami has an average profit per trade of 0.5% and the Harami Cross 0.58%.| Liberated Stock Trader
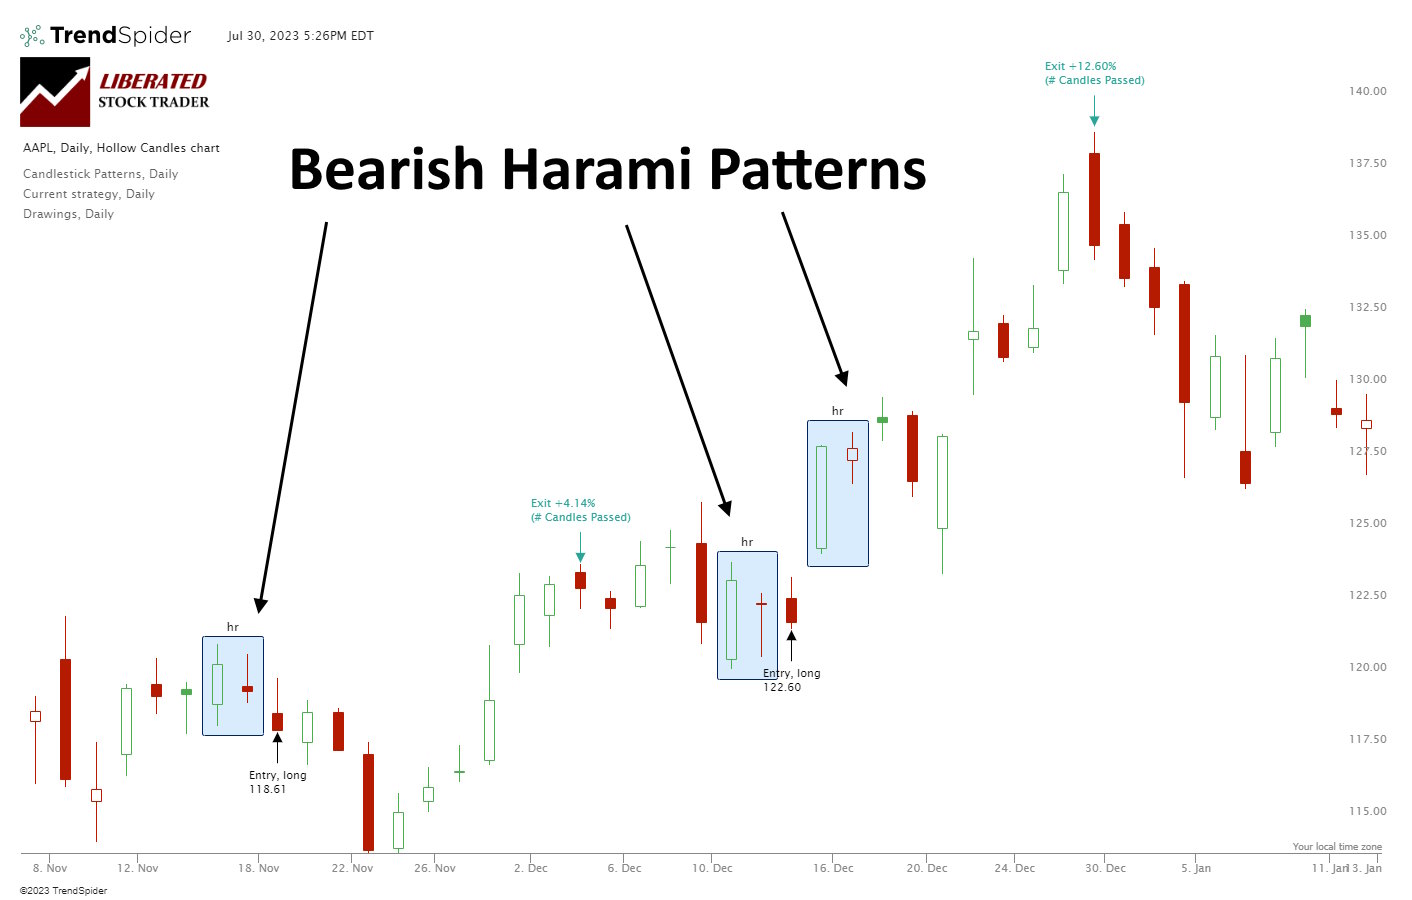
Our research shows Bearish Harami and Bearish Harami Cross are profitable patterns. Based on 1,136 years of data, the Bullish Harami has an average profit per trade of 0.48% and the Harami Cross 0.57%.| Liberated Stock Trader
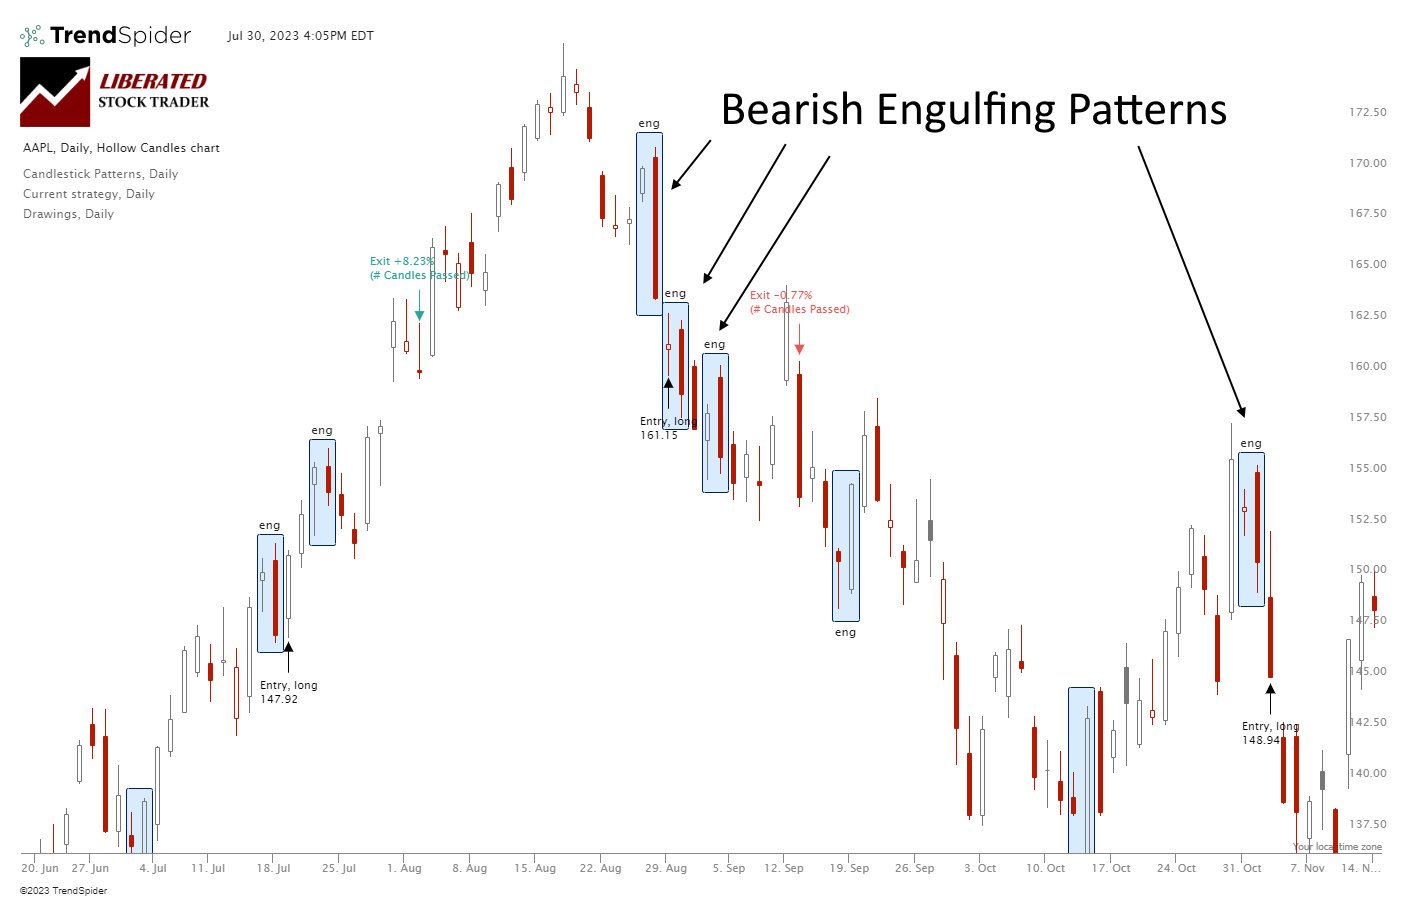
My research shows the Bearish Engulfing candle is an accurate and profitable pattern. Using 568 years of data, my testing revealed a 57% success rate and an average win of 3.7%.| Liberated Stock Trader
An exponential moving average (EMA) technical indicator reduces the lag associated with simple moving averages (SMA) by applying a multiplier to the most recent data. EMAs provide improved sensitivity, enhancing the accuracy of trend analysis.| Liberated Stock Trader
Renko charts filter out unnecessary price fluctuations to provide a clear stock price trend that traders can use in their investing strategies. Unlike a traditional bar or candlestick chart, Renko charts are based on price changes rather than time.| Liberated Stock Trader
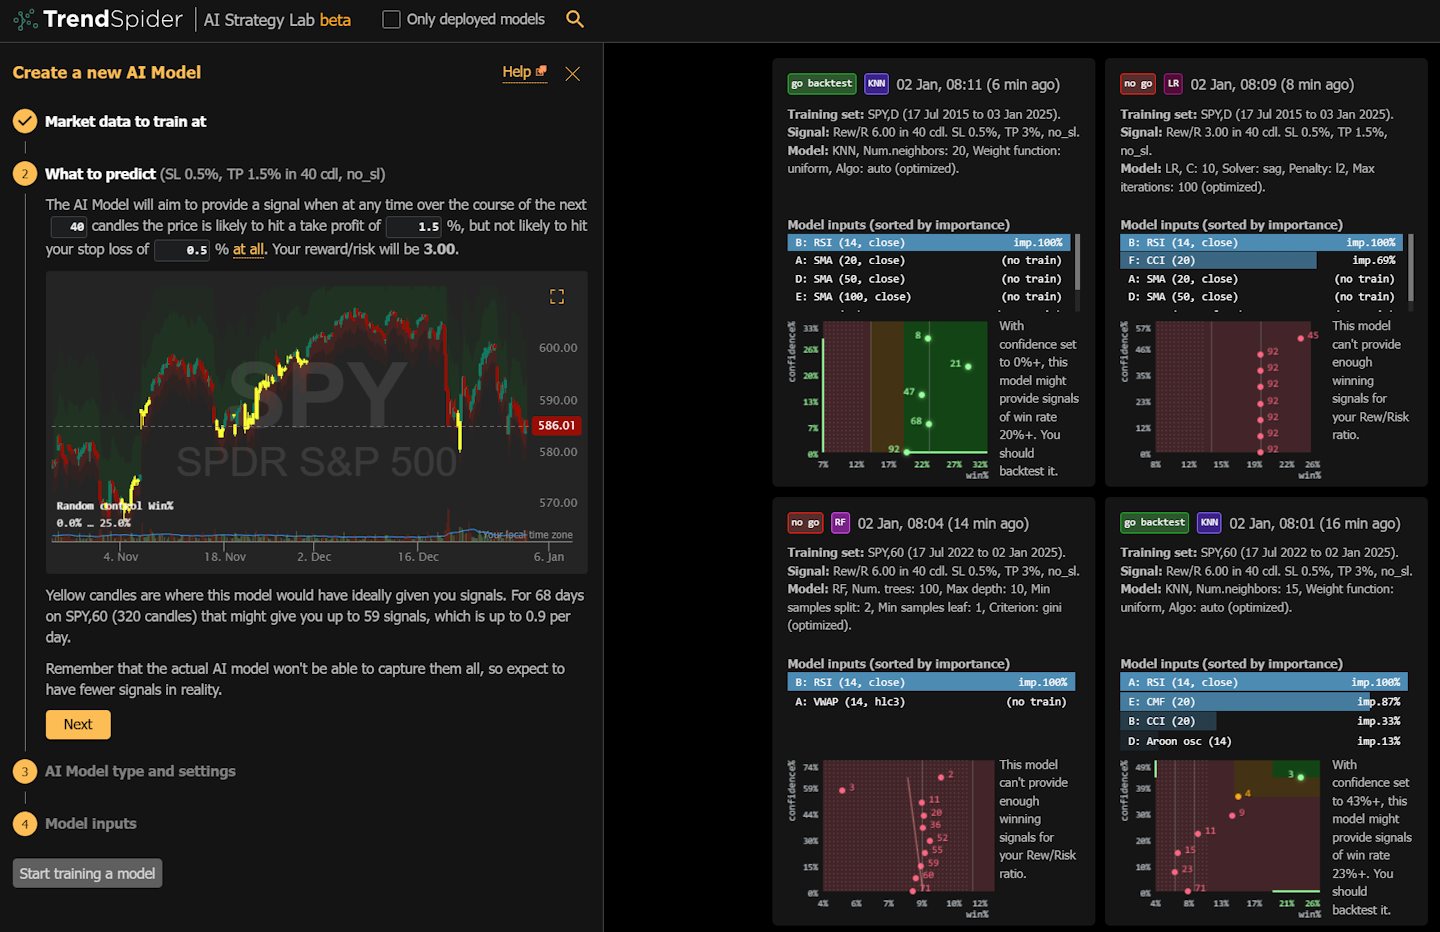
While platforms like TradingView and Trade Ideas offer many algorithms, only TrendSpider lets you fully train your own models. It’s a game-changer for traders looking to create unique strategies!| Liberated Stock Trader
I believe the best ways to learn stock trading include books, audiobooks, data-backed analytical research, and reputable investing courses taught by industry-certified instructors.| Liberated Stock Trader
My testing shows that TrendSpider, Trade Ideas, TradingView, and Tickeron are the most effective software for creating, testing, and executing trading algorithms.| Liberated Stock Trader
Our research shows that overconfidence and a lack of a robust trading plan are the biggest reasons traders lose when trading with margin or leverage.| Liberated Stock Trader
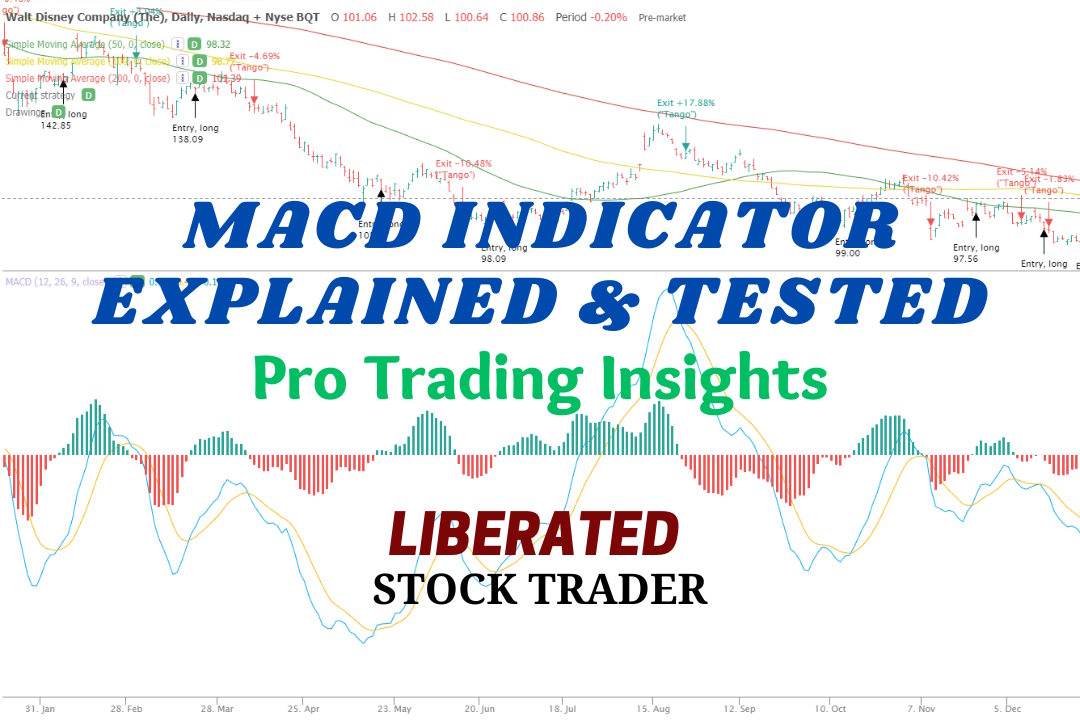
MACD is a trend-following momentum indicator used to identify price trends. We conducted 606,422 test trades to find the best settings and trading strategies.| Liberated Stock Trader
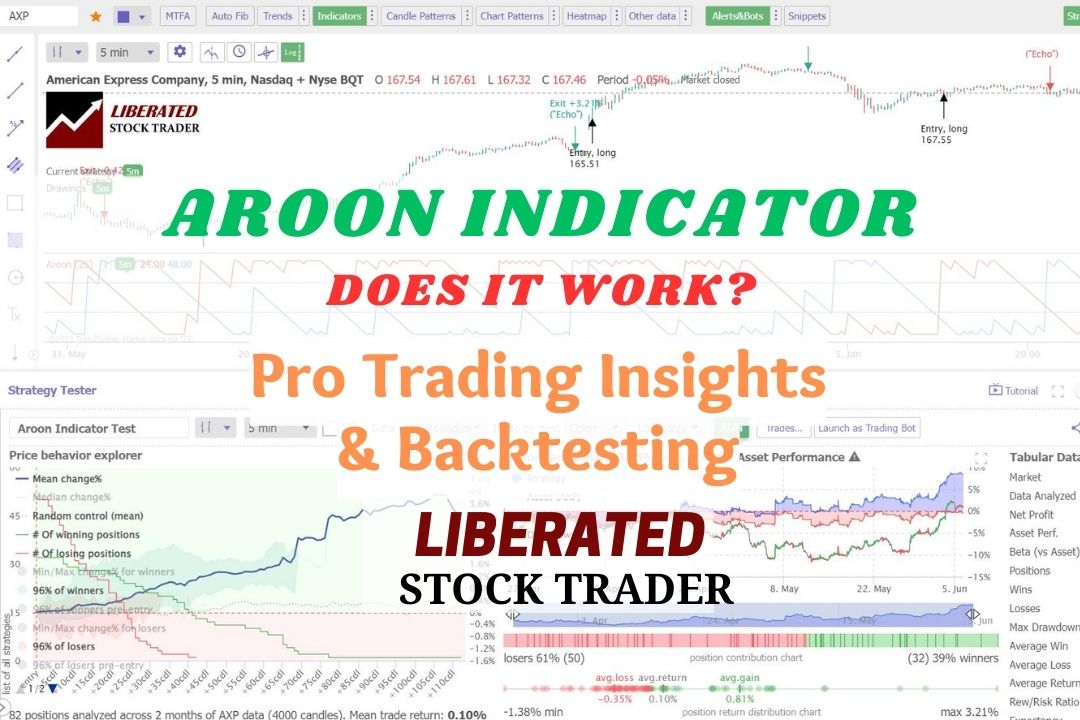
In technical analysis, the Aroon indicator identifies trend reversals and trend strength. This oscillating indicator has two parts: the "Aroon Up" line measures uptrend strength, and the "Aroon Down" line for downtrend strength.| Liberated Stock Trader
Day and swing trading uses technical chart analysis to trade short-term price moves, whereas growth and value investing use long-term fundamental financial analysis. The tools and strategies used for these types of trading are completely different.| Liberated Stock Trader
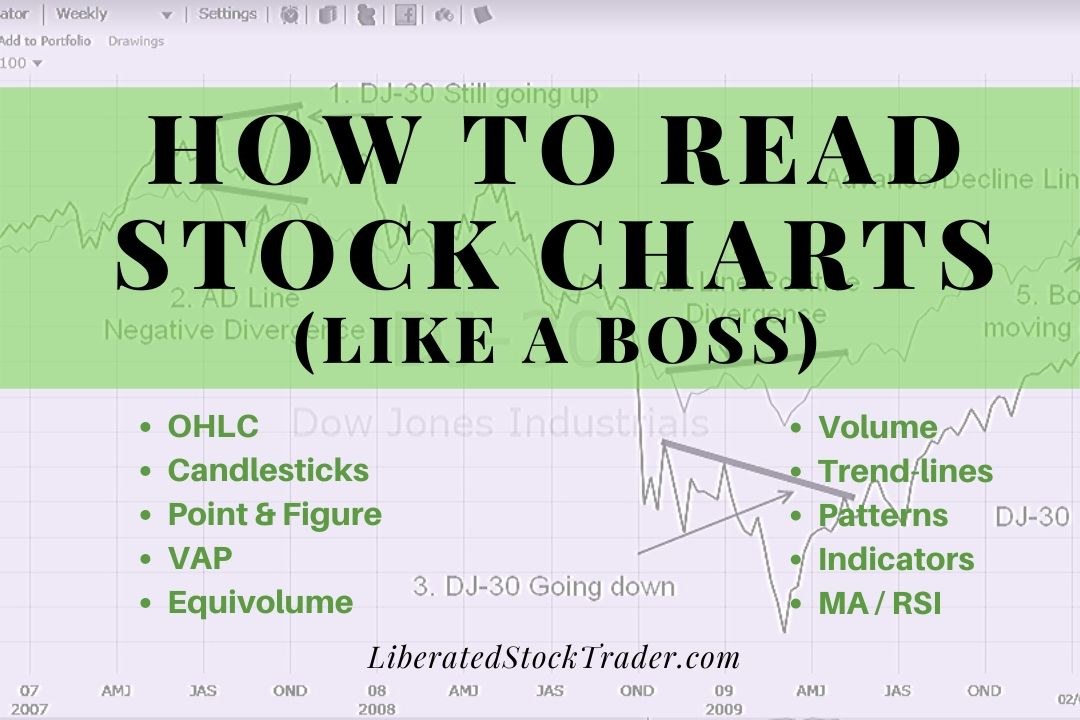
To read stock charts you need to use stock charting software, select your chart type, configure your timeframe, determine price direction using trendlines and use indicators to estimate future prices.| Liberated Stock Trader
My comparison of Stock Rover vs. Finviz reveals that Stock Rover is best for screening, stock research, and portfolio management. Finviz is better at stock pattern recognition and heat maps. I wholeheartedly recommend Stock Rover.| Liberated Stock Trader
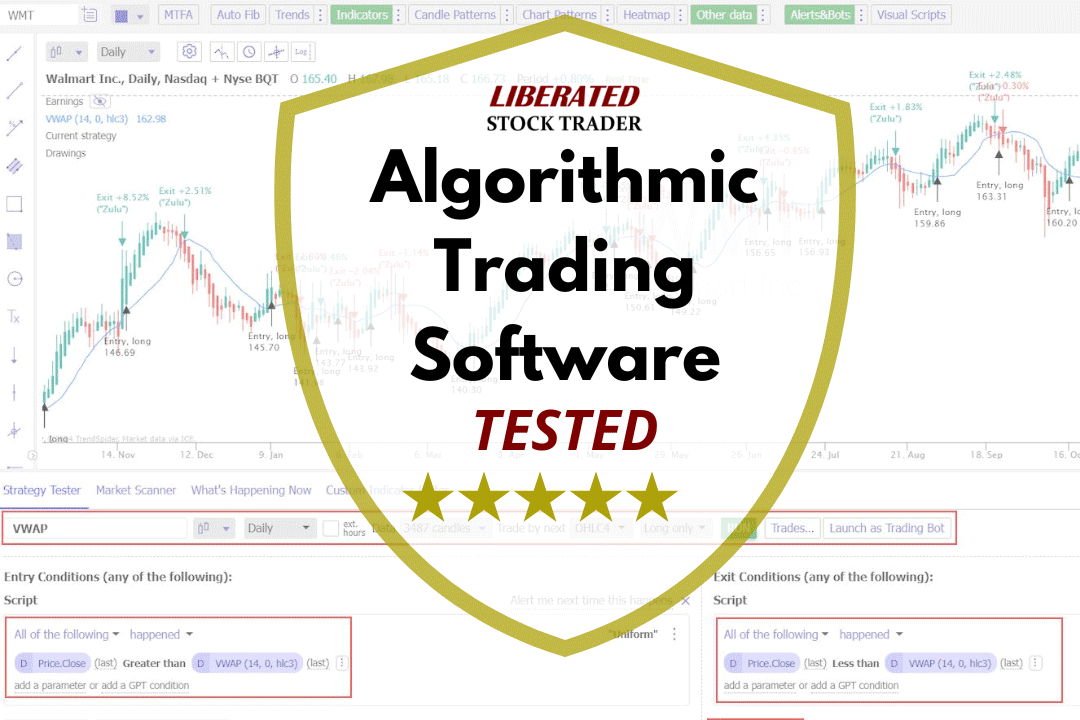
To create an algo trading system, you must choose a strategy, select a trading platform, choose the asset type, select the indicators and patterns, backtest, and refine the strategy.| Liberated Stock Trader
The simple moving average (SMA) technical analysis indicator helps identify stock price trends. It calculates an arithmetic average of prices, offering a smooth line that eliminates short-term price volatility.| Liberated Stock Trader
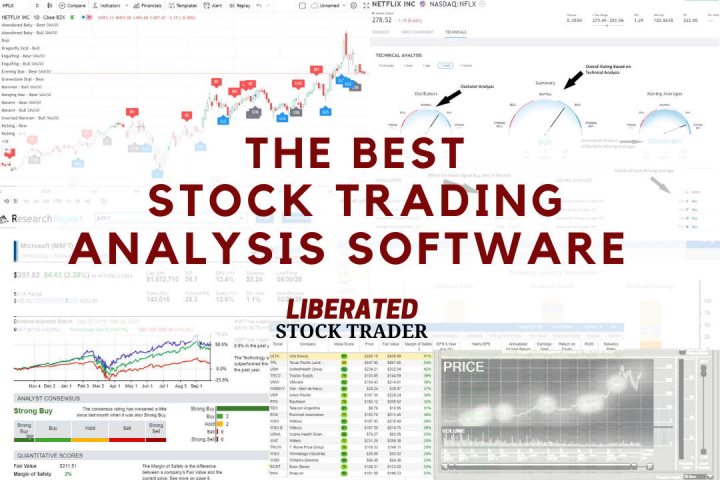
My in-depth testing shows that TradingView, TrendSpider, and Trade Ideas are the best tools for traders, and Stock Rover is superior for investors. Each provides unique benefits, features, and price points.| Liberated Stock Trader
My 2025 testing awards TradingView 4.8 stars due to its continued innovation in chart analysis, pattern recognition, screening, and backtesting. TradingView is my top recommendation for US and international traders.| Liberated Stock Trader
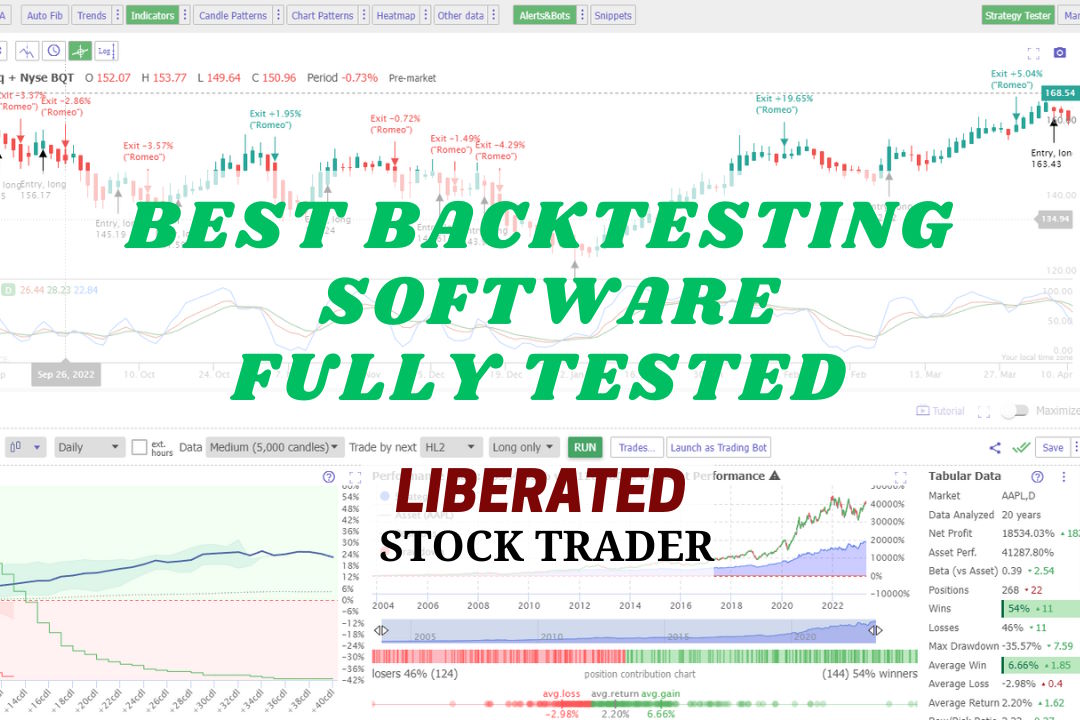
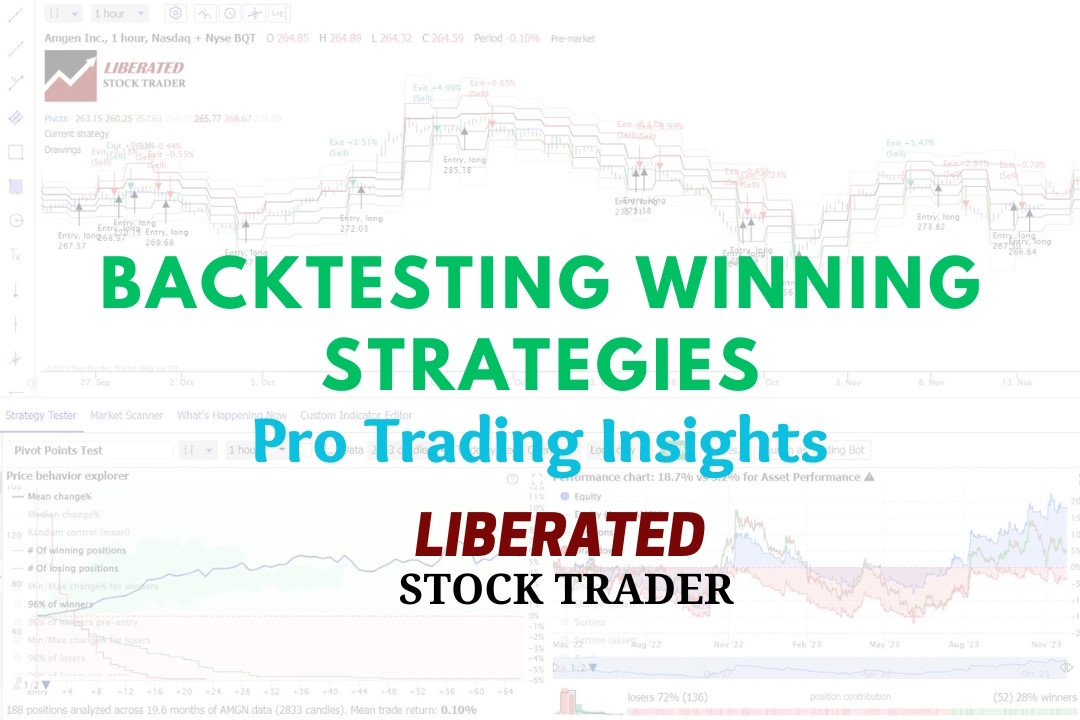
My research shows the best stock backtesting and auto-trade software are TrendSpider, Trade Ideas, and Tradingview. My testing process selected TrendSpider as the overall winner because it offers the most flexible, code-free, multilayer backtesting.| Liberated Stock Trader
My research identifies Trade Ideas and TrendSpider as the leaders in AI trading software. Trade Ideas offers automated trading and bots, while TrendSpider offers automated pattern recognition, auto-trading, and backtesting.| Liberated Stock Trader
The Hull Moving Average (HMA) is a highly responsive technical analysis indicator designed to reduce lag. Our research reveals it outperforms other moving averages.| Liberated Stock Trader
Experienced investors backtest their trading strategies to optimize their portfolios. Backtesting is a critical step that enables traders to assess the potential viability of a trading strategy by applying it to historical data.| Liberated Stock Trader
My in-depth testing shows Trade Ideas is the ultimate black box AI-powered day trading signal platform with built-in automated bot trading.| Liberated Stock Trader