Sell Signals In Stock Trading: How I Identify, Evaluate, and Act
A sell signal gives traders a heads-up on when to consider closing positions, helping them lock in gains or cut losses using actual triggers, not just hunches.| Liberated Stock Trader
A sell signal gives traders a heads-up on when to consider closing positions, helping them lock in gains or cut losses using actual triggers, not just hunches.| Liberated Stock Trader

Price action trading is a method of day trading that relies on technical analysis but ignores conventional fundamental indicators, focusing instead on the movement of prices.| Liberated Stock Trader
Swing Trading and Day Trading differ in the timeframe, strategy, tools, and leverage. Day traders trade intraday using leverage; swing traders hold positions for days or weeks. Swing traders use real-time news, patterns, and indicators to make decisions, whereas day traders typically look for volatility to enable price scalping.| Liberated Stock Trader
A buy signal is essentially an indicator or event that suggests it may be a good time to purchase a particular stock, whether based on technical data, chart patterns, or intrinsic value.| Liberated Stock Trader
Most AI trading tools do not use real AI machine learning and large language models. The majority of self-proclaimed AI trading tools are algorithmic and do not actually learn.| Liberated Stock Trader
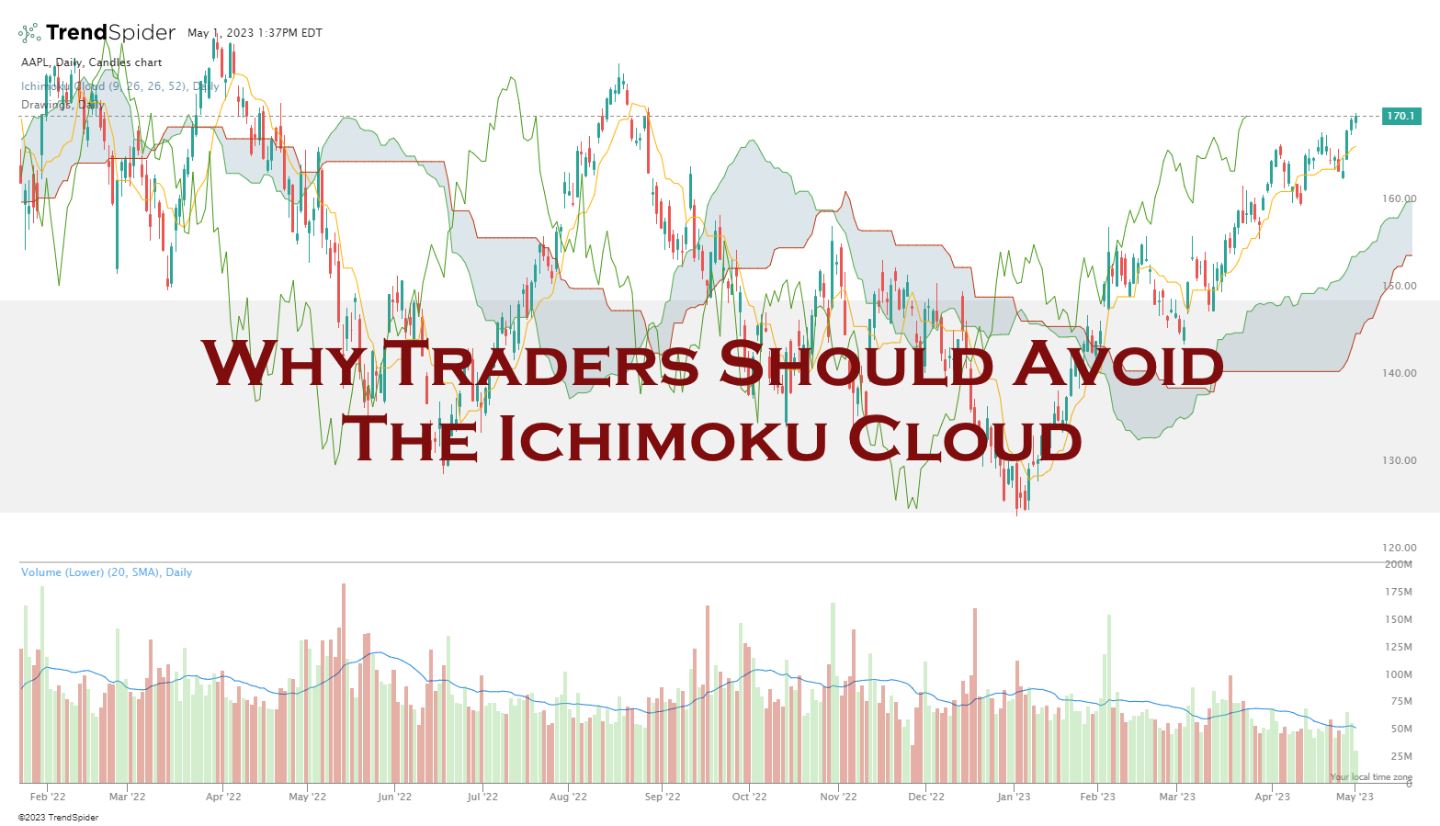
The Ichimoku test results are a dismal 10% win rate, underperforming a buy-and-hold strategy 90% of the time. The Ichimoku indicator is a poor choice for traders.| Liberated Stock Trader
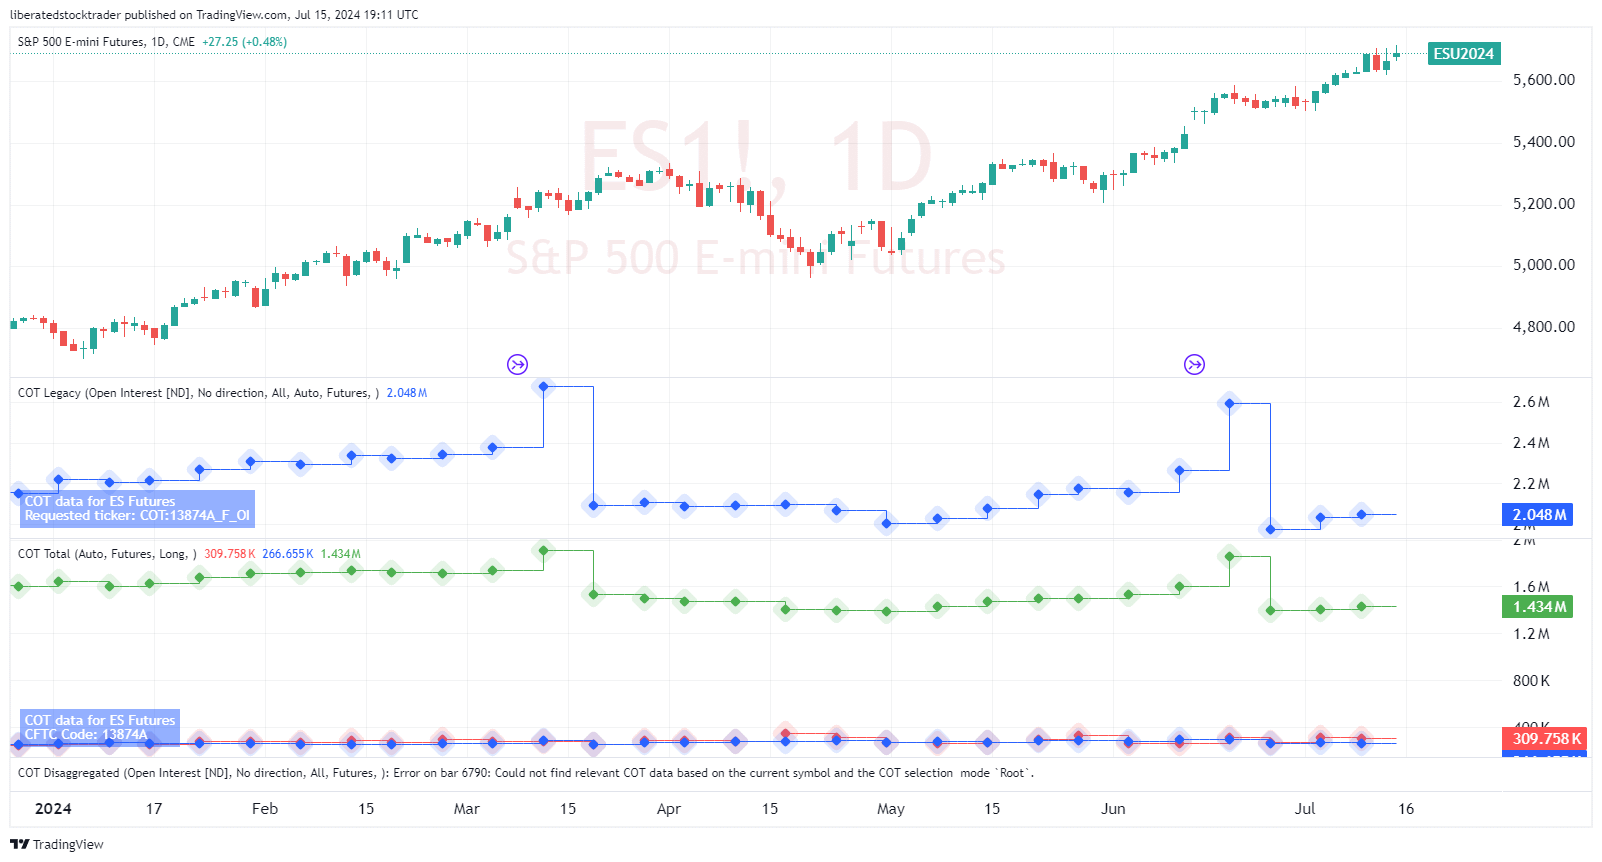
The Commitment of Traders (COT) Report is a valuable tool for traders wanting to understand market sentiment in the futures markets.| Liberated Stock Trader
Kagi charts provide traders with a unique perspective on price action, filtering out much of the noise and highlighting genuine trends. Getting a handle on how to use Kagi charts, dialing in the right settings, and understanding how they compare to other chart types can really sharpen your technical analysis and trading decisions.| Liberated Stock Trader
My testing shows the best TradingView indicators for advanced analysis are Volume Profile HD, VWAP, Supertrend, ATR, Relative Volatility, and RSI. TradingView's candlestick and chart pattern recognition algorithms are game changers for improving trading outcomes.| Liberated Stock Trader
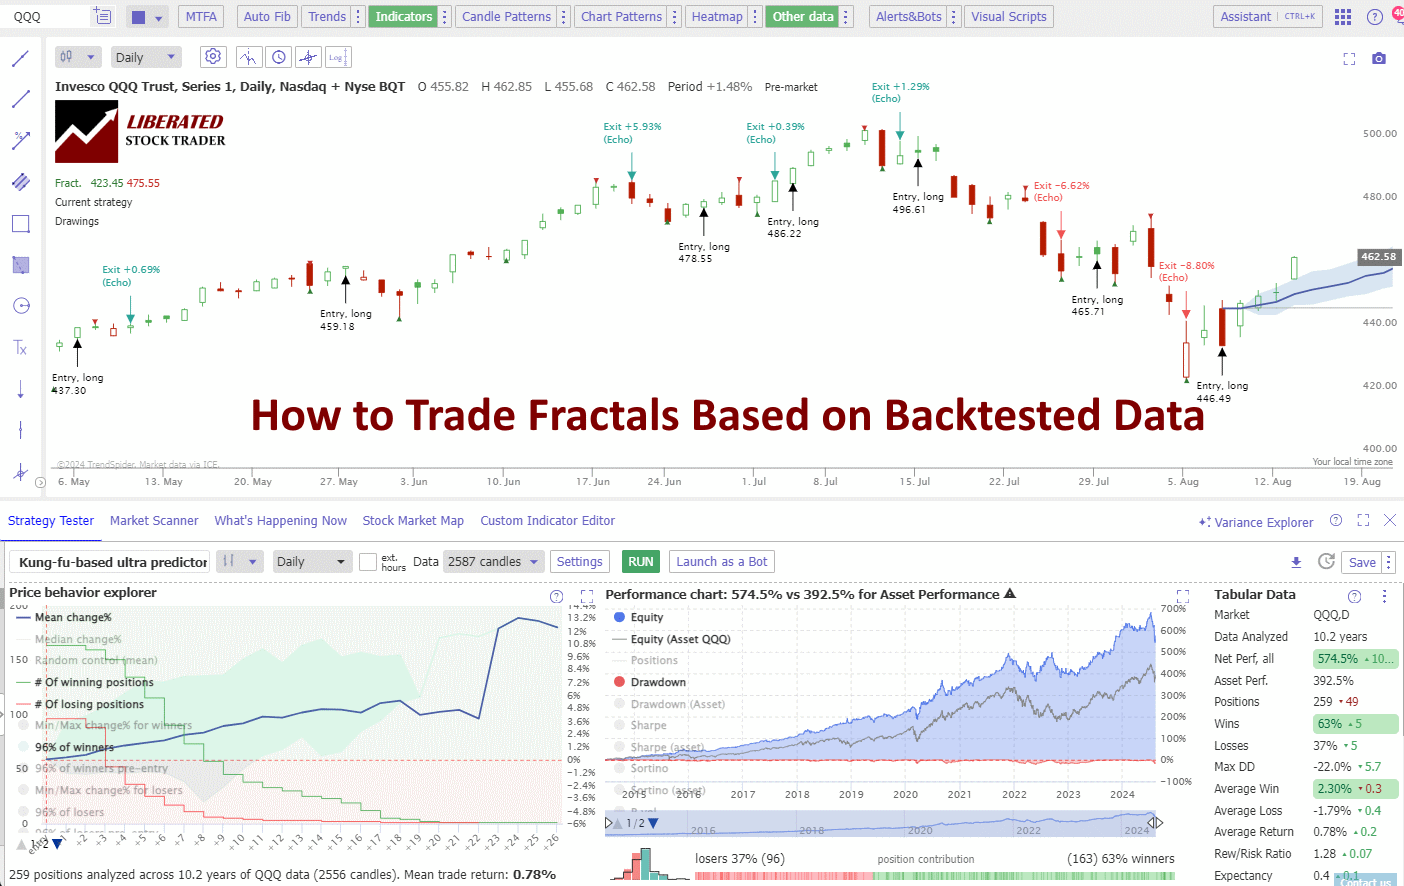
Based on 2,510 tested trades on 80 years of exchange data, I can confirm trading fractal patterns is profitable, with an average reward-to-risk ratio rate of 1.5 across all timescales.| Liberated Stock Trader
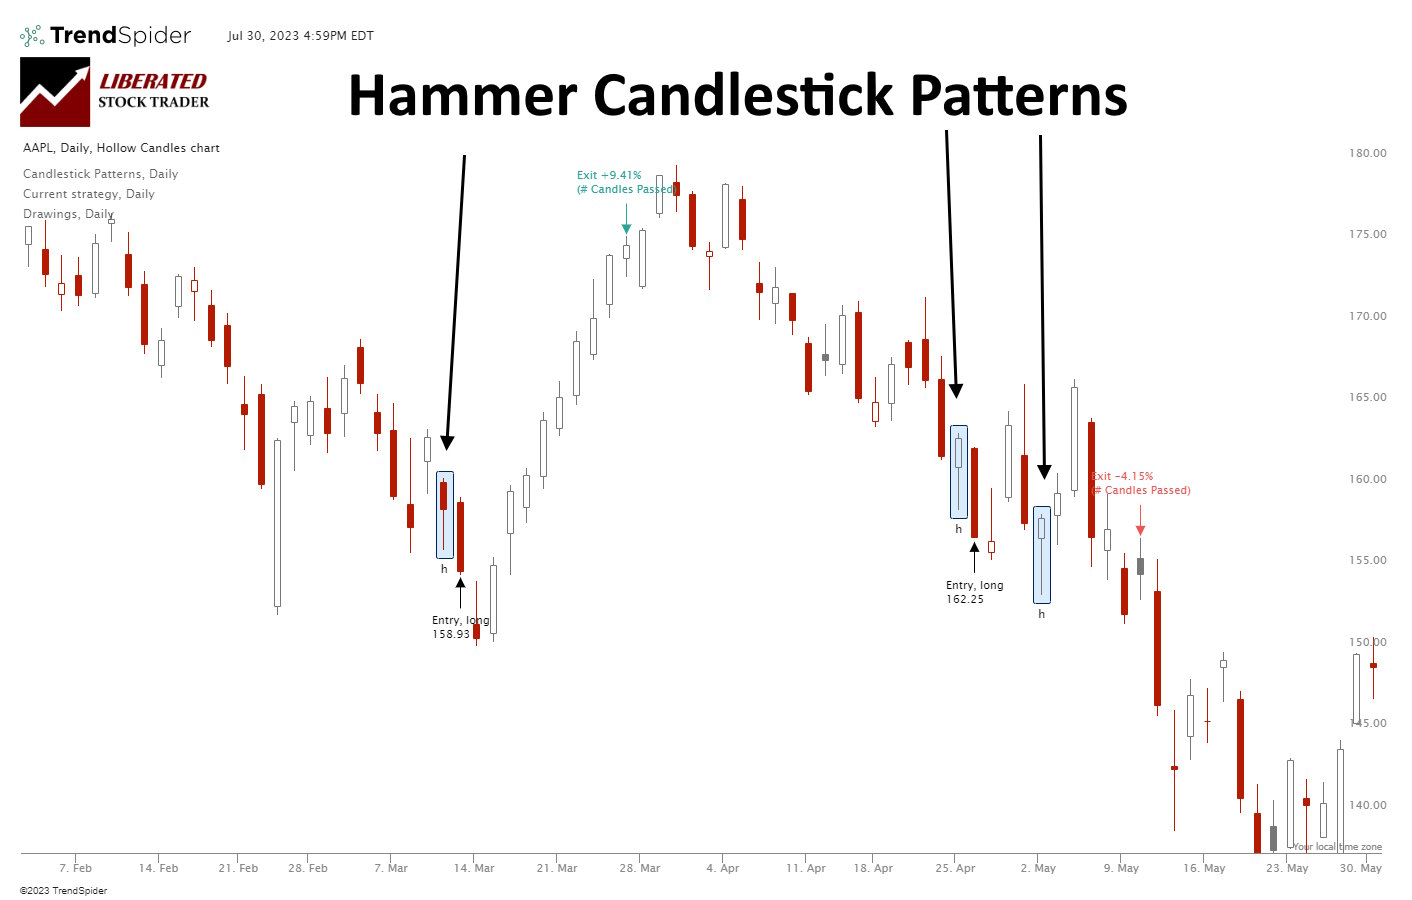
According to 2,219 tested trades, a Hammer is extremely unreliable and unprofitable. It has a low % accuracy rate of 52.1%, resulting in a razor-thin 0.18% profit per trade.| Liberated Stock Trader
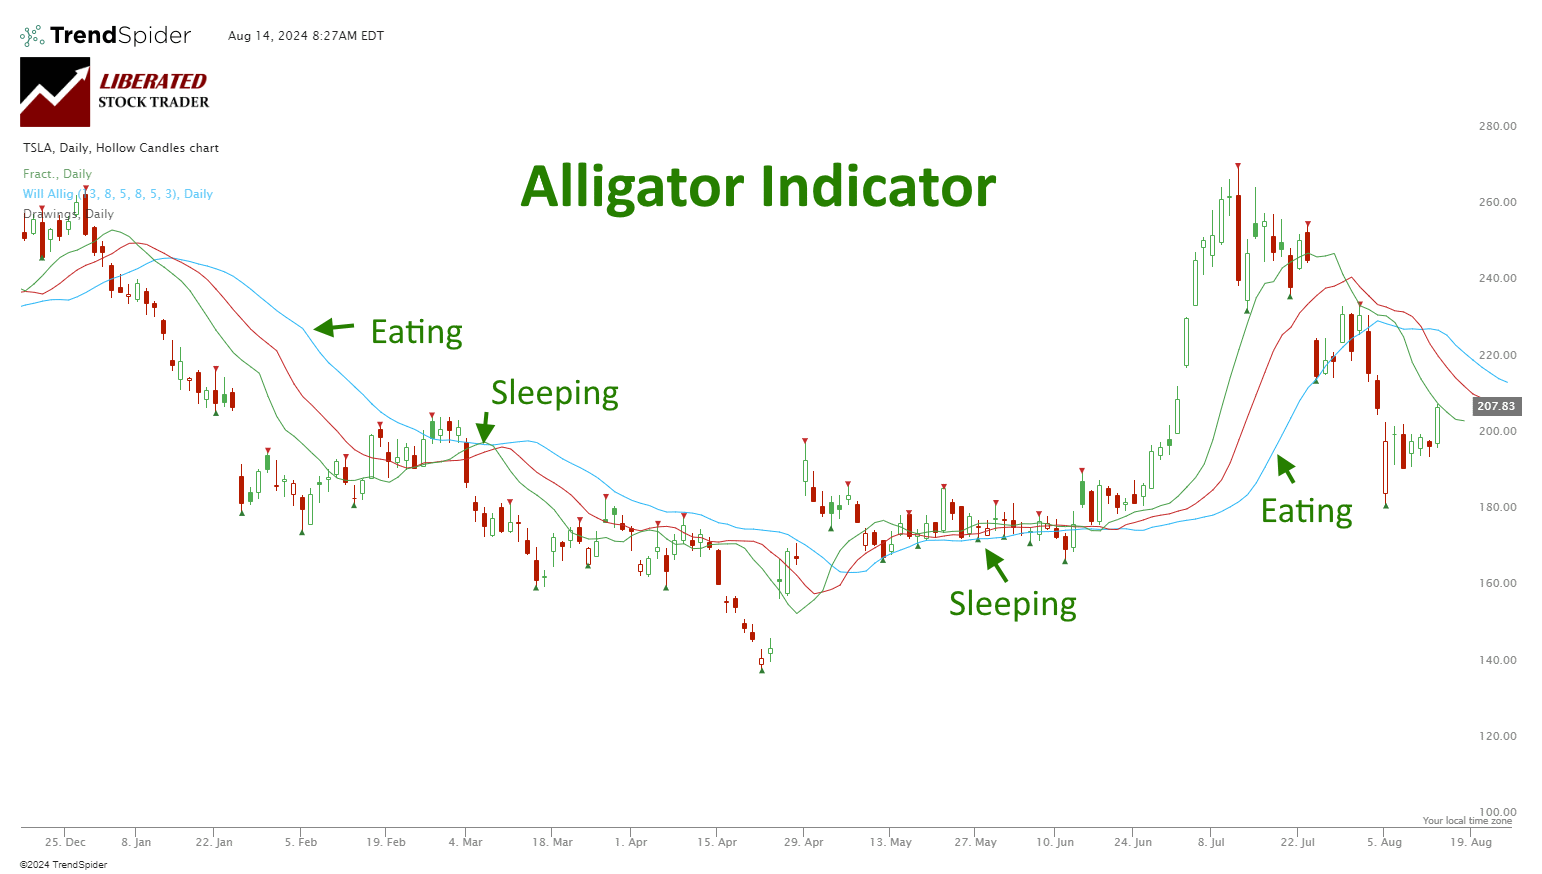
My unique research shows that the Alligator indicator is highly profitable in stocks and indices, using daily and weekly chart timeframes. It is also only profitable on a weekly chart for Forex.| Liberated Stock Trader

Ultimately, for 95% of speculators, day trading is not worth it. Although day traders can make significant money quickly, statistics show that most day traders lose money. Over a six-month period excessive commissions, poor trading decisions, weak strategies, and bad market timing cause losses.| Liberated Stock Trader
The mean reversion trading strategy suggests prices and returns eventually move back toward the mean or average. Reliable indicators like Stochastics, RSI, and Bollinger bands are based on mean reversion to identify overbought and oversold conditions.| Liberated Stock Trader
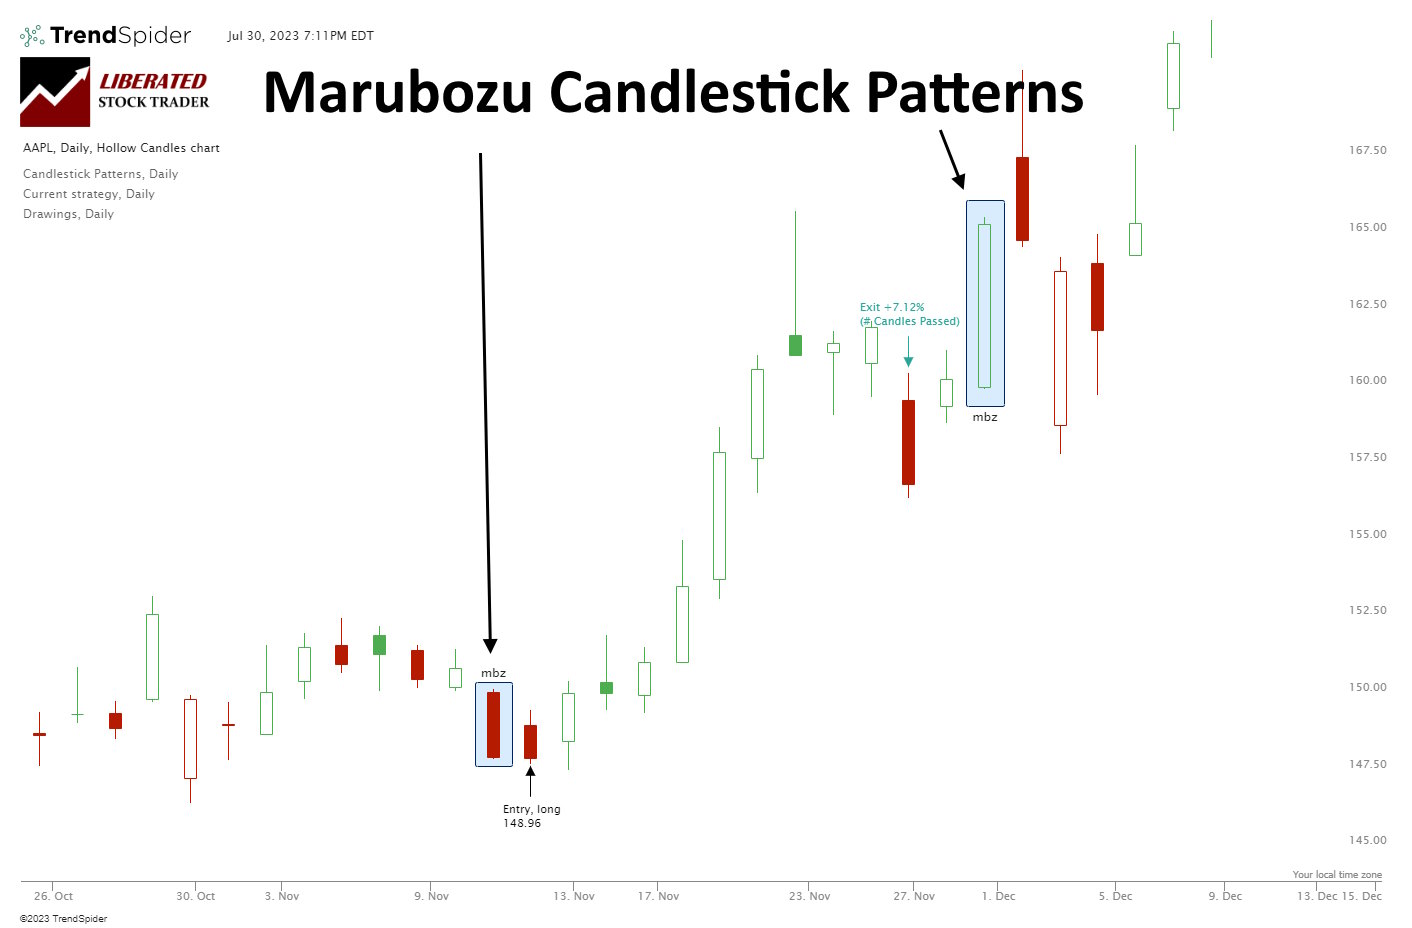
Our research shows Bearish Marubozu candles are among the most profitable patterns. Based on 568 years of data, it has a 56.1% success rate and an average win of 4.1%. Conversely, the Bullish Marubozu is one of the worst.| Liberated Stock Trader
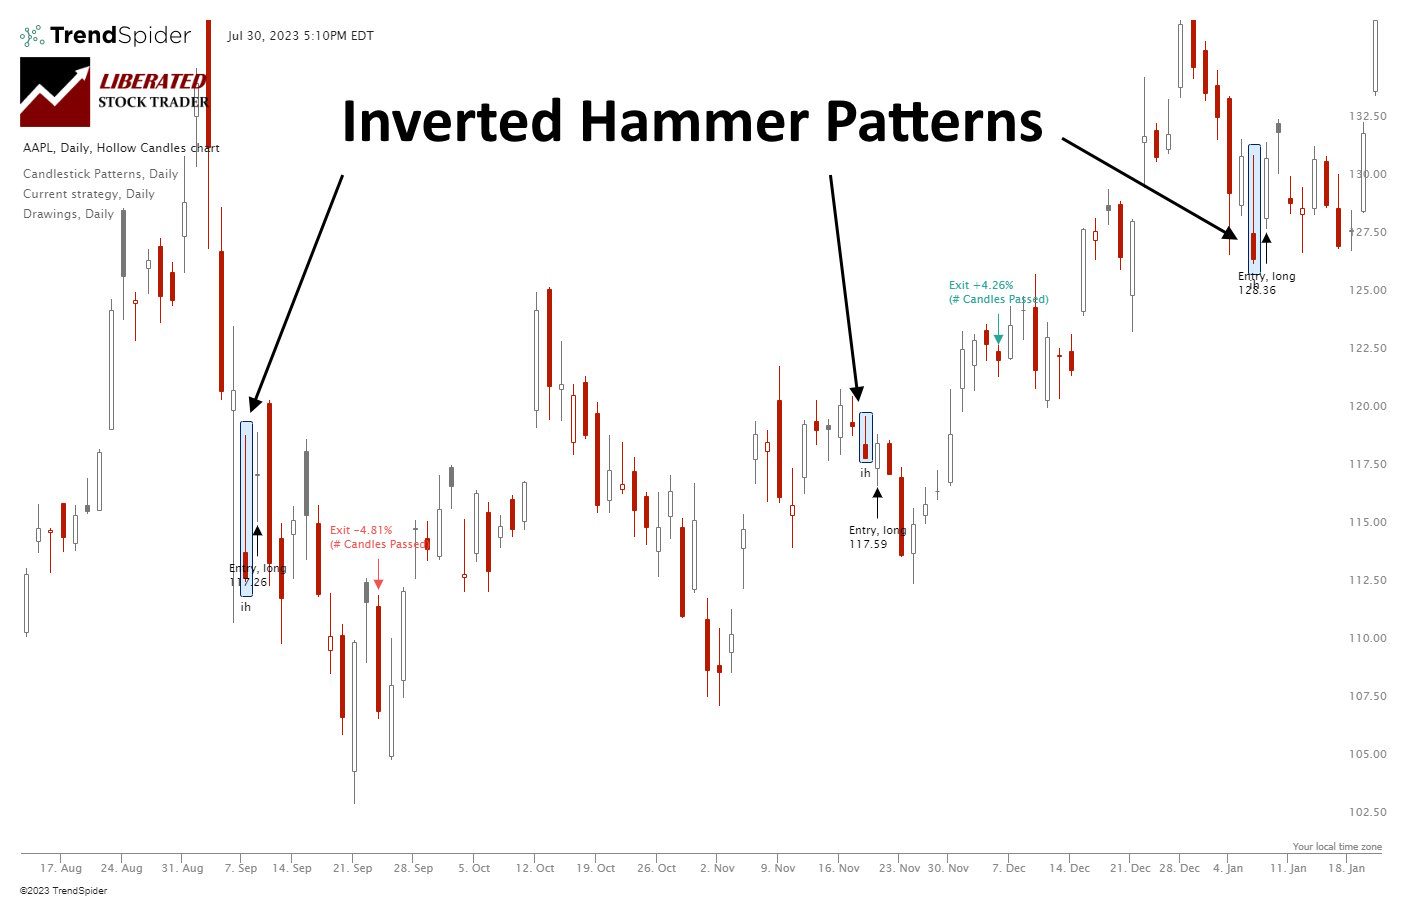
Our research shows the Inverted Hammer is the most accurate and profitable candlestick pattern. Used as a bullish signal, it has a 60% success rate and an average win of 4.2%, based on 588 years of data.| Liberated Stock Trader
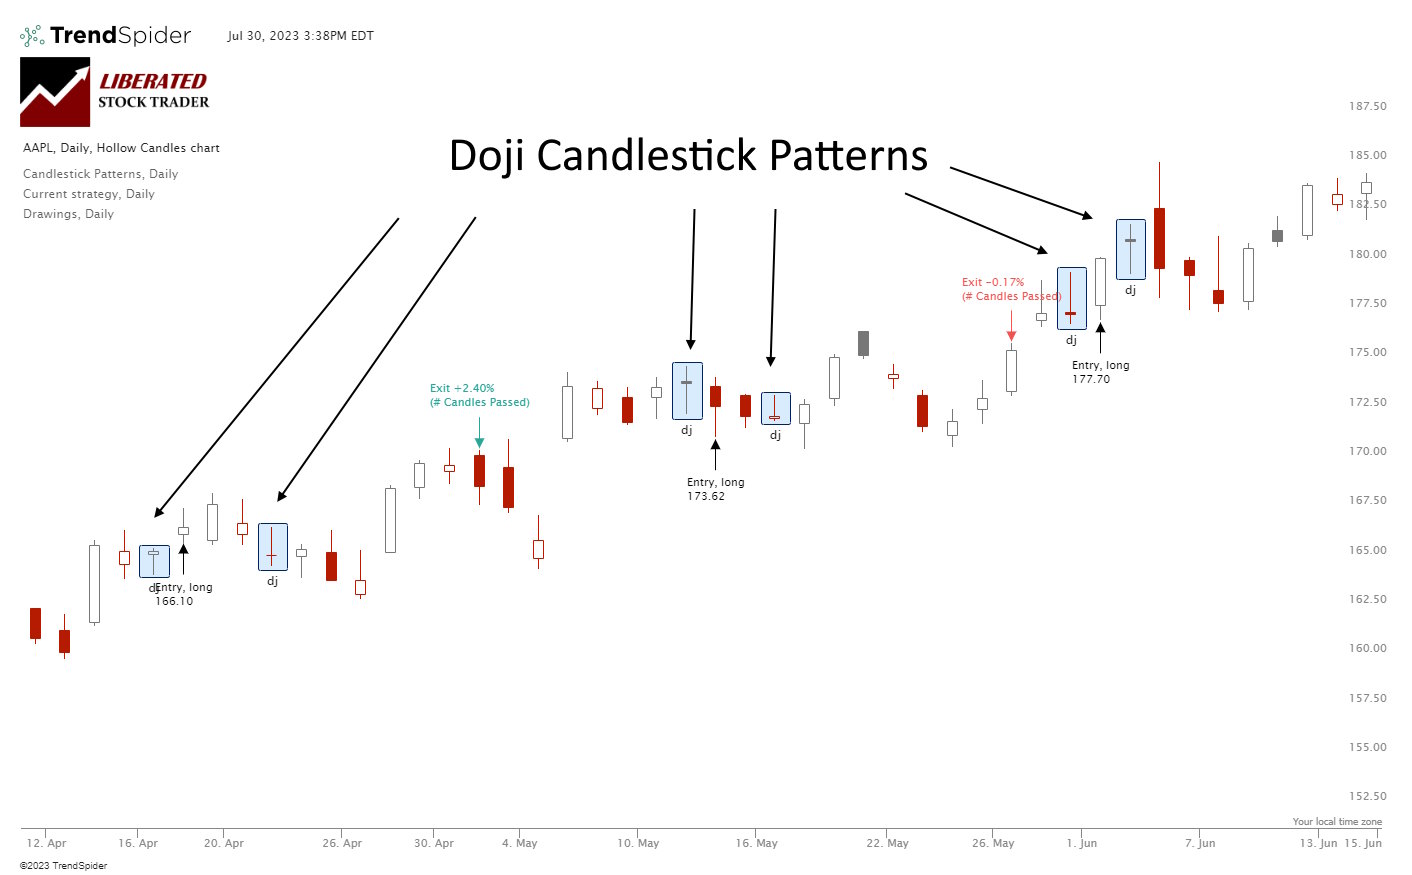
A Doji candlestick chart pattern indicates a battle between buyers and sellers, ending in equilibrium. The Doji marks a potential trend reversal. Is the Doji pattern profitable or accurate? Our evidence suggests its profitability is marginal.| Liberated Stock Trader
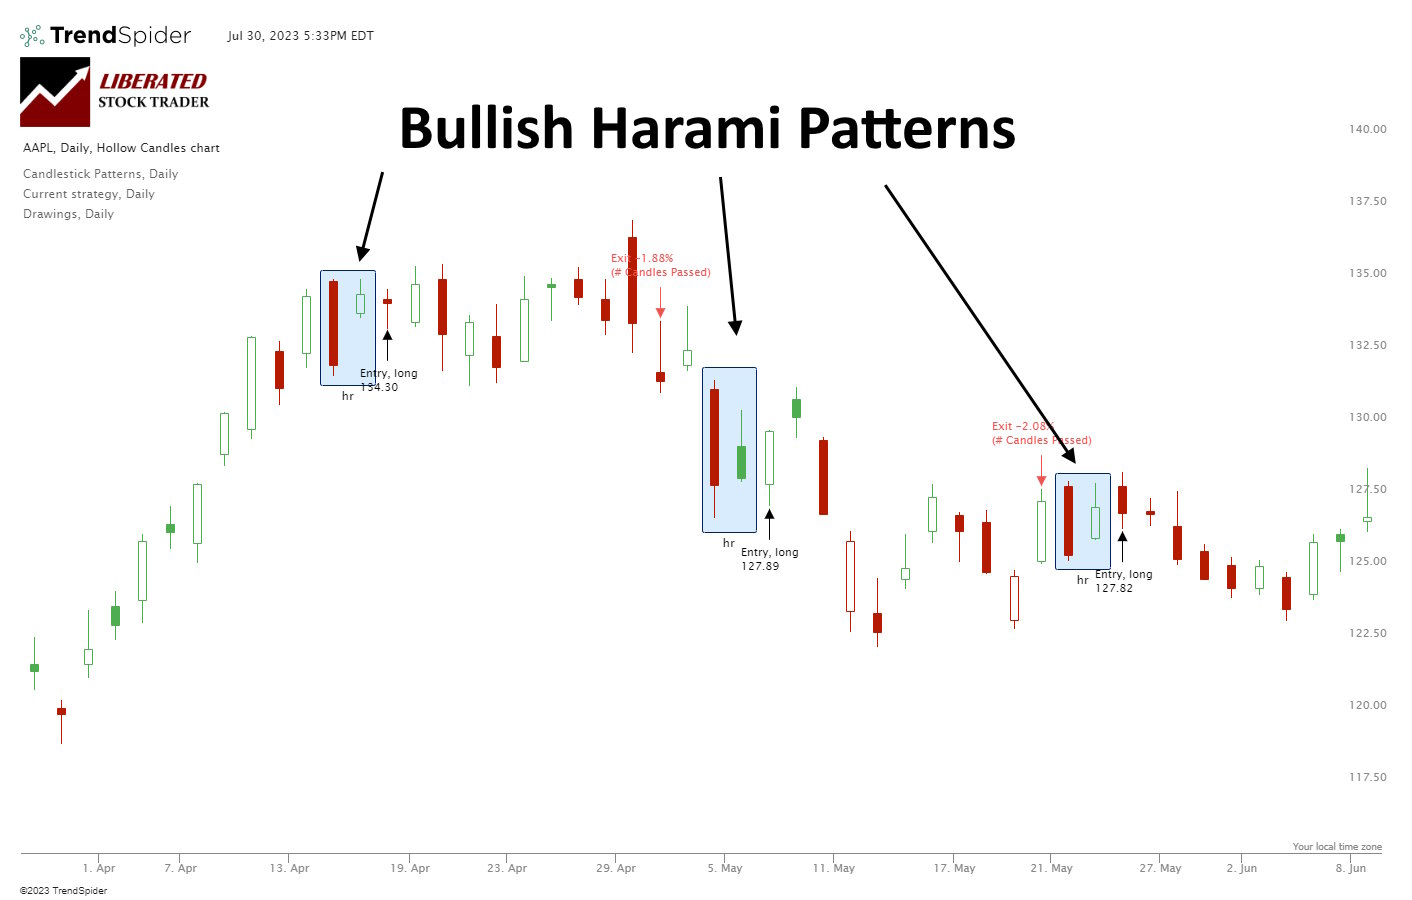
Our research shows Bullish Harami and Bullish Harami Cross are profitable patterns. Based on 1,112 years of data, the bullish Harami has an average profit per trade of 0.5% and the Harami Cross 0.58%.| Liberated Stock Trader
Renko charts filter out unnecessary price fluctuations to provide a clear stock price trend that traders can use in their investing strategies. Unlike a traditional bar or candlestick chart, Renko charts are based on price changes rather than time.| Liberated Stock Trader
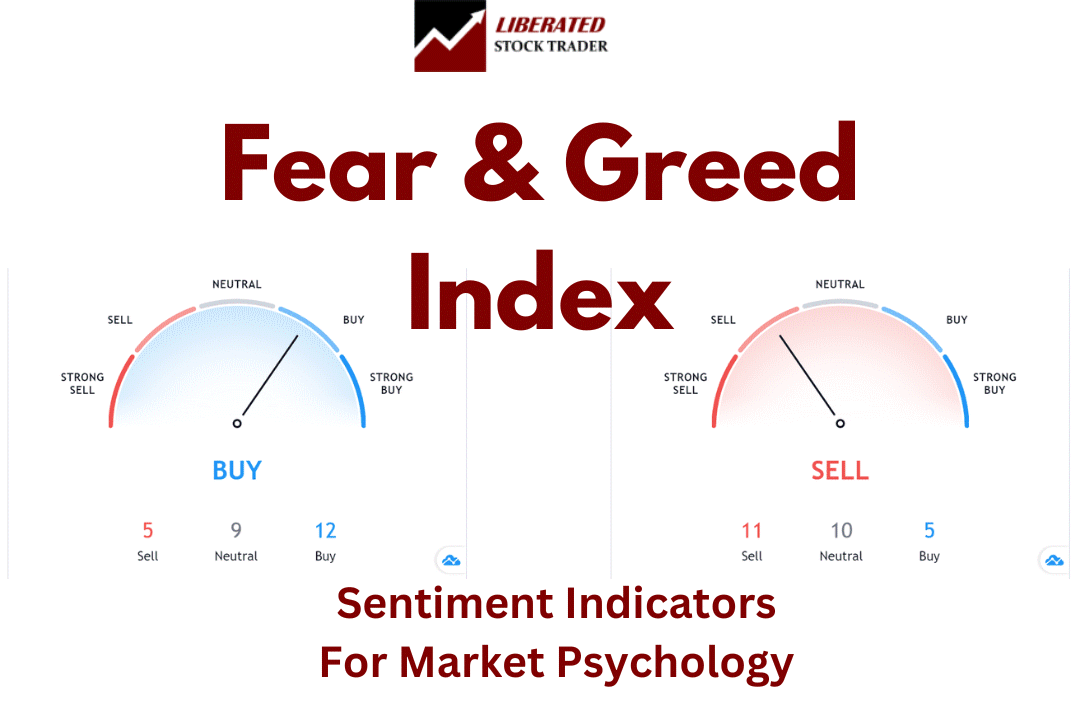
Our Fear and Greed Index goes beyond the basics, offering nine real-time and historical charts to help you stay ahead. With live data from the Federal Reserve, VIX CBOE, and 15 technical stock price signals, you'll have the tools to make smarter decisions today.| Liberated Stock Trader
I believe the best ways to learn stock trading include books, audiobooks, data-backed analytical research, and reputable investing courses taught by industry-certified instructors.| Liberated Stock Trader
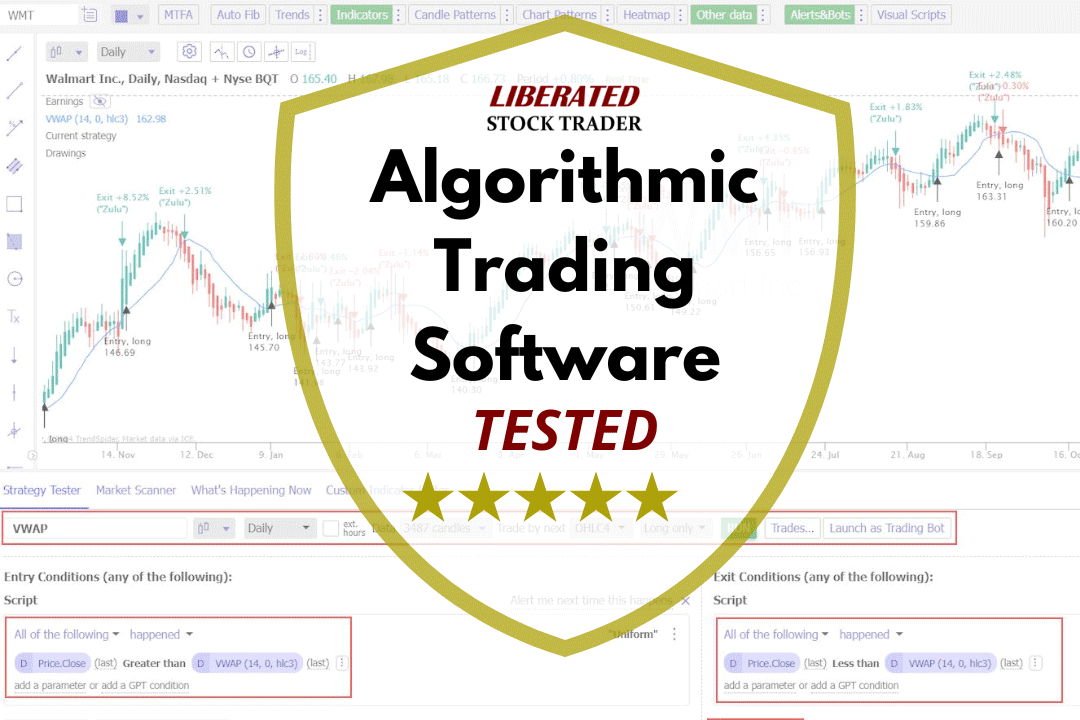
My testing shows that TrendSpider, Trade Ideas, TradingView, and Tickeron are the most effective software for creating, testing, and executing trading algorithms.| Liberated Stock Trader
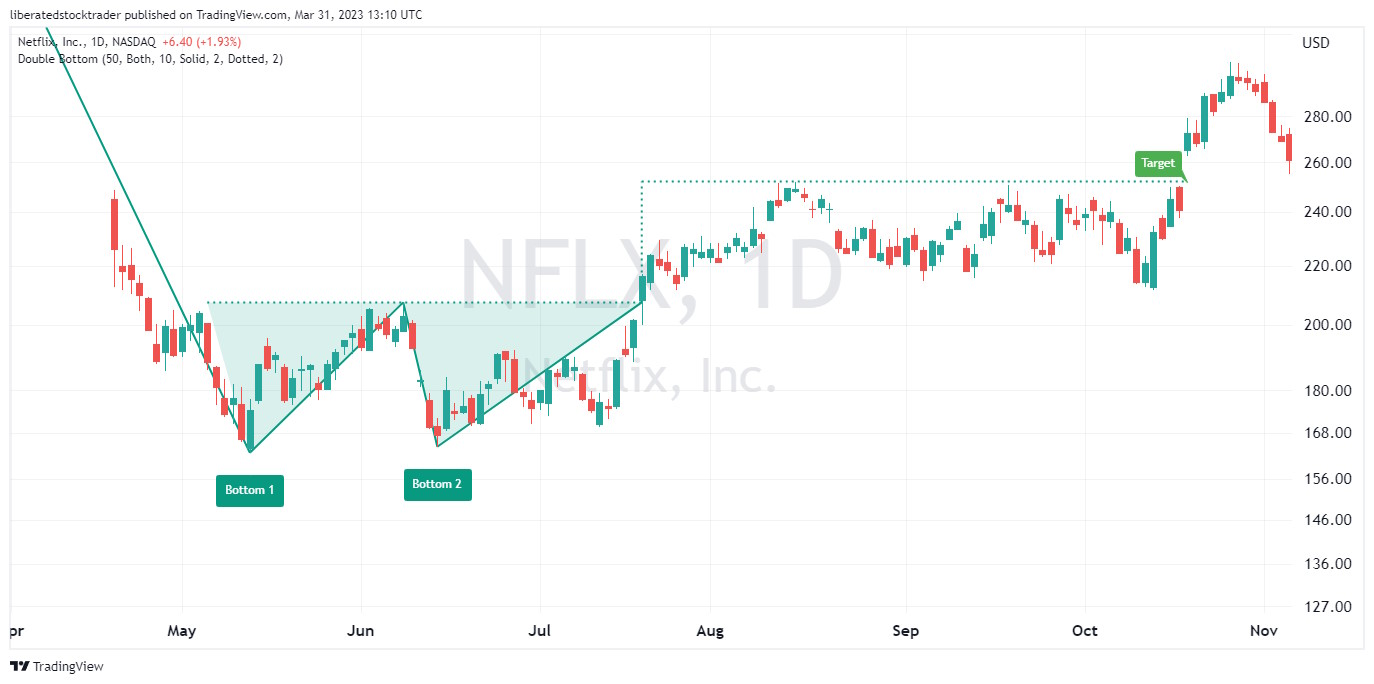
Decades of research reveal the double bottom pattern has an 88% success rate in bull markets and an average profit potential of +50%. The double-bottom chart pattern is one of the most reliable and accurate chart indicators in technical analysis.| Liberated Stock Trader
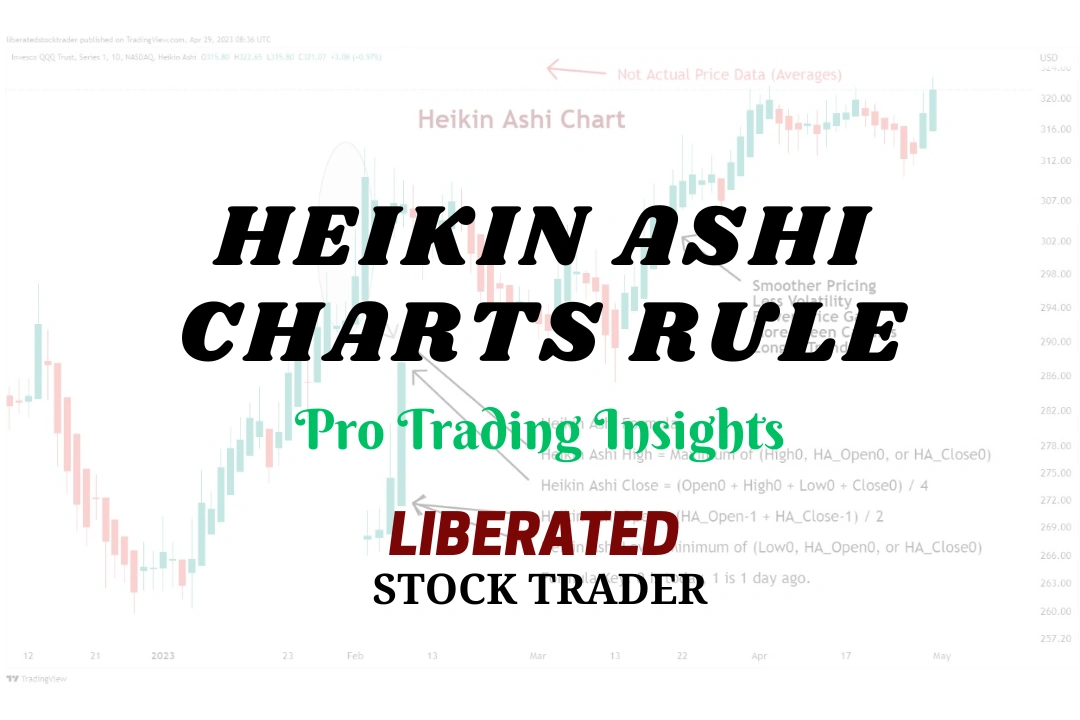
I backtested 360 years of data on the 30 most important US stocks, and our findings prove that Heikin-Ashi chart strategies outperform 66% of equities vs. a buy-and-hold strategy.| Liberated Stock Trader
Day and swing trading uses technical chart analysis to trade short-term price moves, whereas growth and value investing use long-term fundamental financial analysis. The tools and strategies used for these types of trading are completely different.| Liberated Stock Trader

The simple moving average (SMA) technical analysis indicator helps identify stock price trends. It calculates an arithmetic average of prices, offering a smooth line that eliminates short-term price volatility.| Liberated Stock Trader

The Relative Strength Index (RSI) is an oscillating momentum indicator that measures the speed and change of stock price movements. RSI uses a scale from 0 to 100 to indicate overbought or oversold conditions.| Liberated Stock Trader
My 2025 testing awards TradingView 4.8 stars due to its continued innovation in chart analysis, pattern recognition, screening, and backtesting. TradingView is my top recommendation for US and international traders.| Liberated Stock Trader
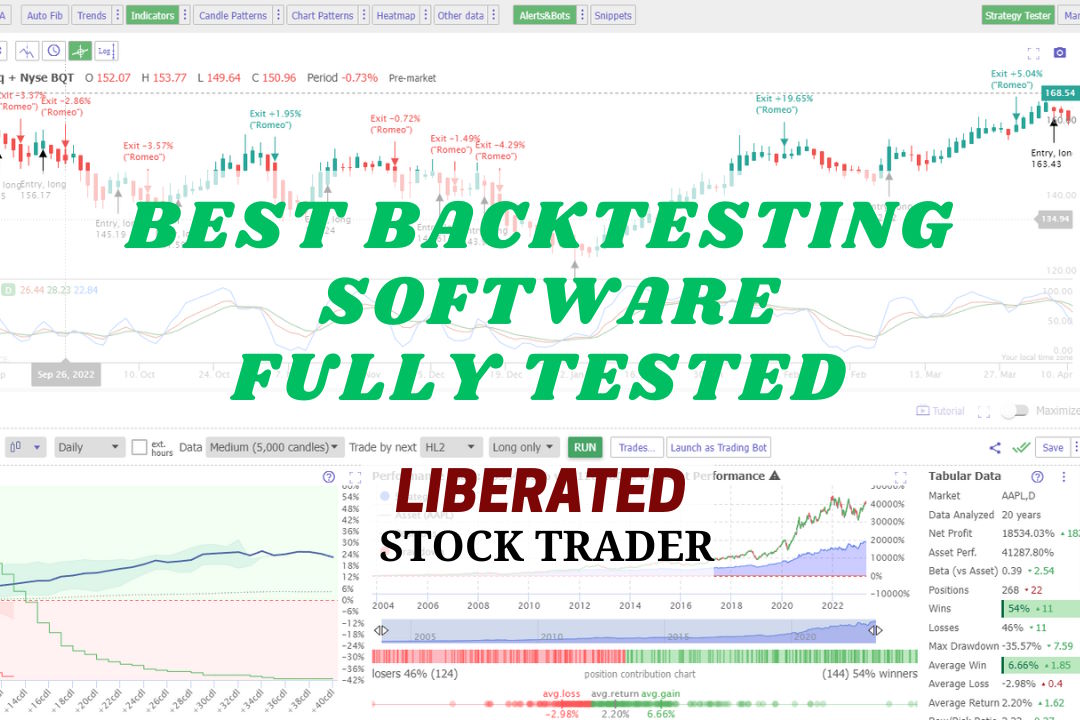
My research shows the best stock backtesting and auto-trade software are TrendSpider, Trade Ideas, and Tradingview. My testing process selected TrendSpider as the overall winner because it offers the most flexible, code-free, multilayer backtesting.| Liberated Stock Trader
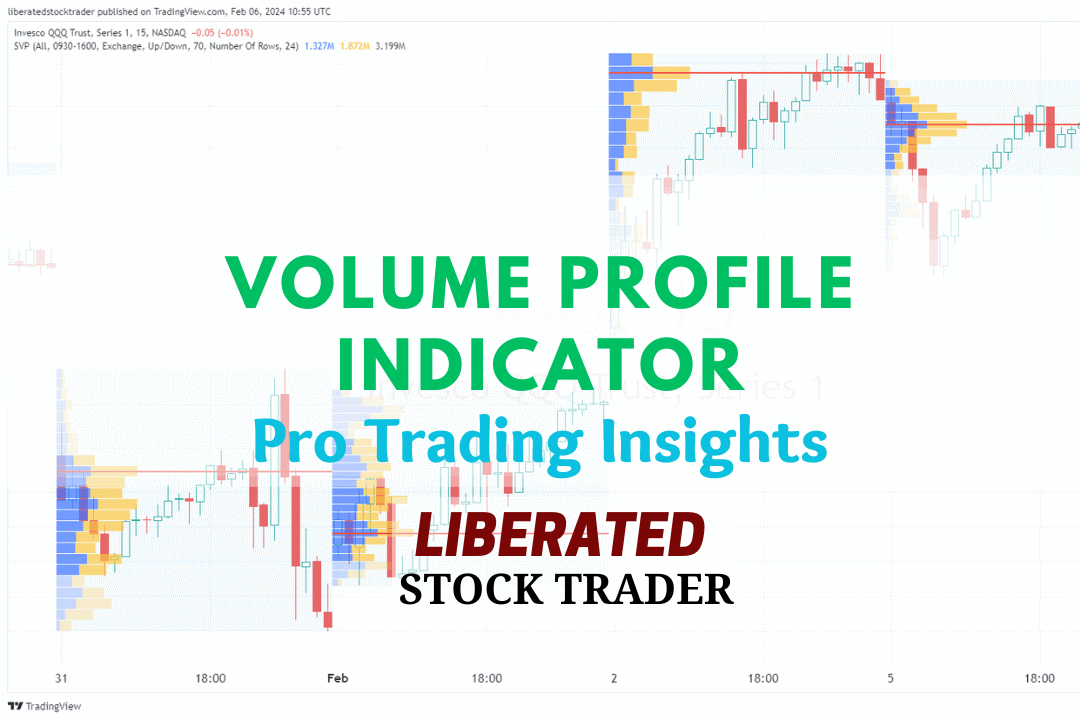
Volume profile technical analysis indicators provide a uniquely detailed overview of volume distribution across price levels, offering traders insights into market structure and supply and demand zones.| Liberated Stock Trader

Our research on 10,400 years of exchange data shows the best day trading indicators are the Price Rate of Change, VWAP, Weighted Moving Average, Hull Moving Average, Simple Moving Average, and RSI.| Liberated Stock Trader
The Hull Moving Average (HMA) is a highly responsive technical analysis indicator designed to reduce lag. Our research reveals it outperforms other moving averages.| Liberated Stock Trader
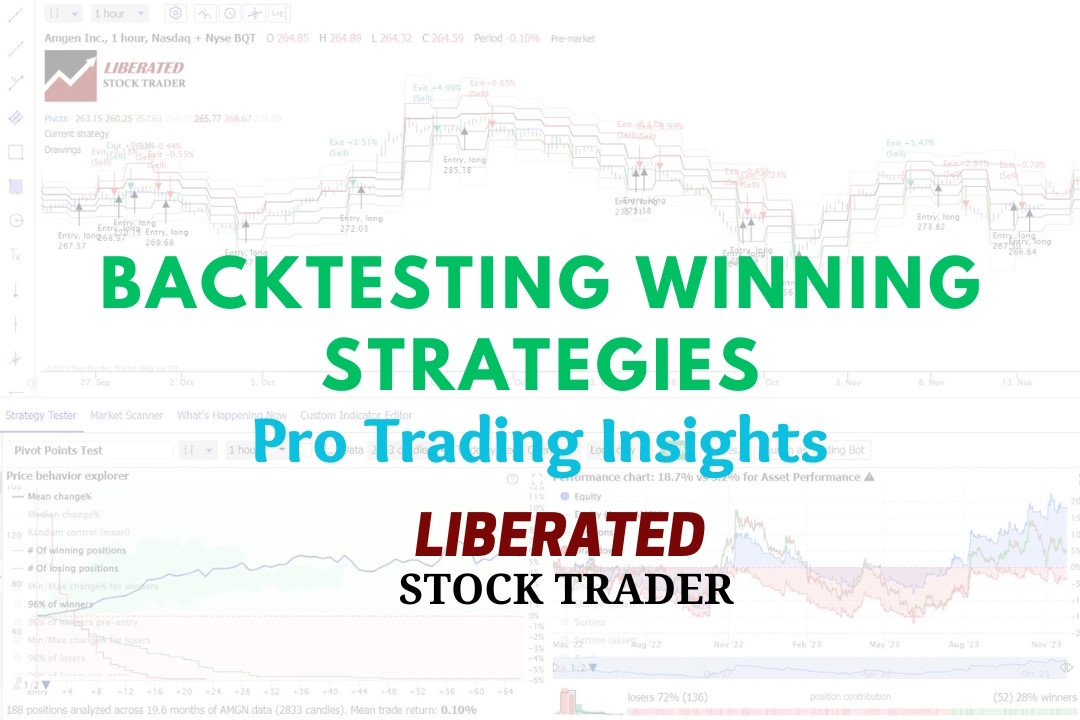
Experienced investors backtest their trading strategies to optimize their portfolios. Backtesting is a critical step that enables traders to assess the potential viability of a trading strategy by applying it to historical data.| Liberated Stock Trader
