
Top 10 errors in R and how to fix them - Stats and R
In this post, I highlight the 10 most common errors in R and how to fix them. I also mention a couple of warnings (which are different than errors).| Stats and R
In this post, I highlight the 10 most common errors in R and how to fix them. I also mention a couple of warnings (which are different than errors).| Stats and R

Learn more about survival analysis (also called time-to-event analysis), in which context and how it is used. Also learn how to apply it by hand and in R| Stats and R

Learn when and how to do a one-sample Wilcoxon test in R. See also how to visualize and interpret the results with a concrete example.| Stats and R

Learn how to perform the one-sample t-test by hand and in R in order to compare a sample to a hypothesized value, with known or unknown population variance| Stats and R

Make the the most correlated variables stand out via a correlogram. See also how to enhance a correlation plot to show significant correlations among variables| Stats and R

Learn the differences between the Chi-square test of independence and the Fisher's exact test. You will also learn how to implement the statistical test in R| Stats and R

Learn how to perform a descriptive analysis of your data in R, from simple descriptive statistics to more advanced graphics used to describe your data at hand| Stats and R
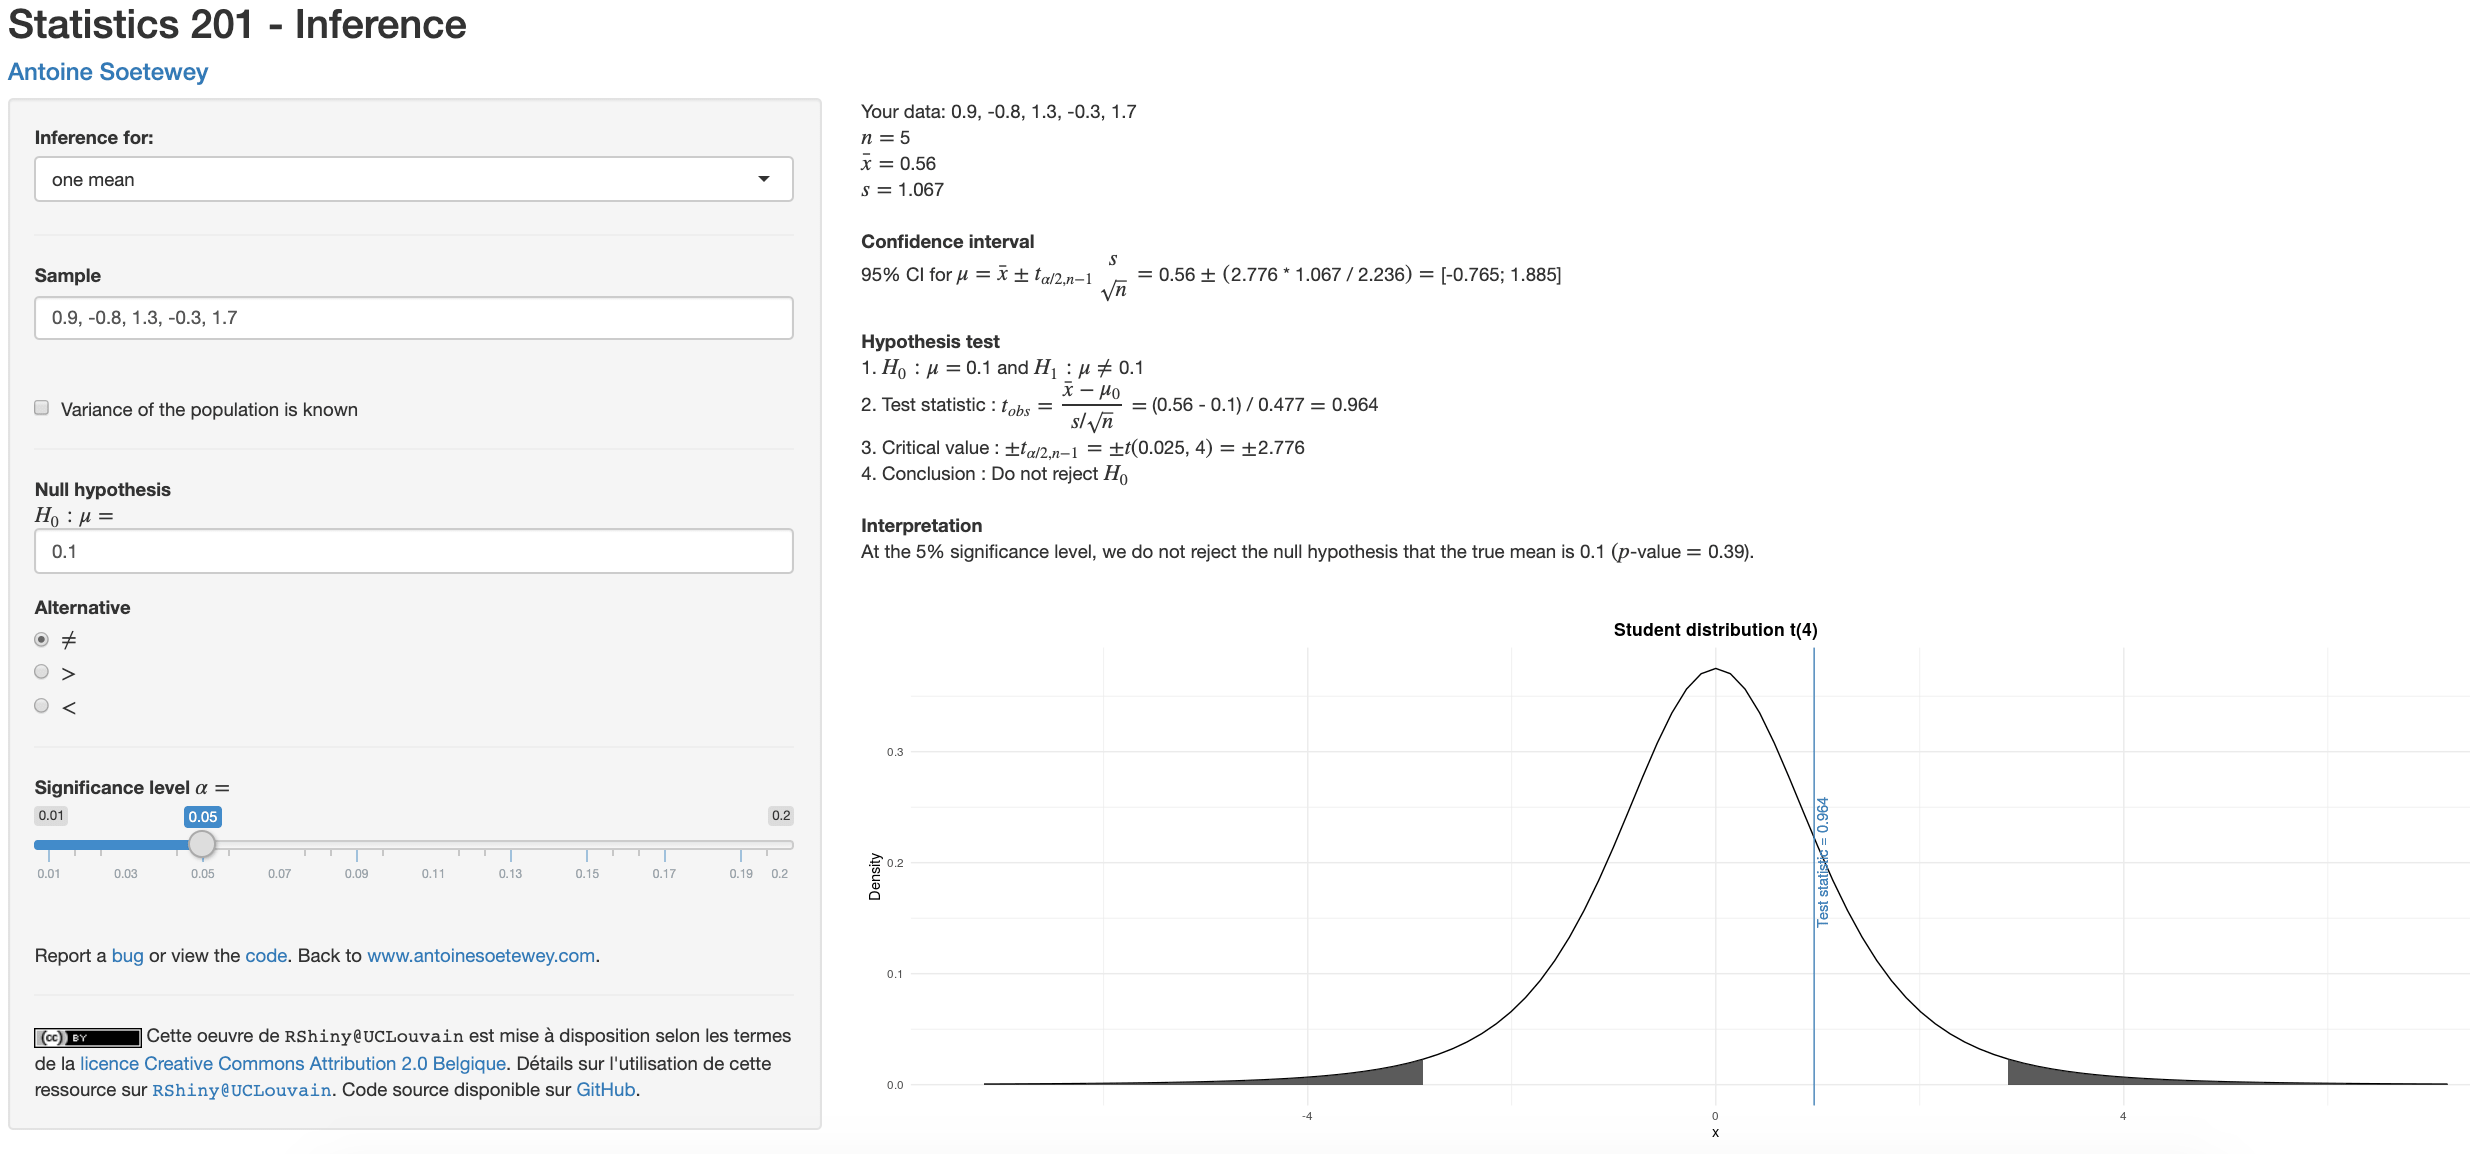
This article presents how to perform inferential statistics by hand, namely, confidence intervals and hypothesis tests for means, proportions and variances| Stats and R
