
Top 10 errors in R and how to fix them - Stats and R
In this post, I highlight the 10 most common errors in R and how to fix them. I also mention a couple of warnings (which are different than errors).| Stats and R
In this post, I highlight the 10 most common errors in R and how to fix them. I also mention a couple of warnings (which are different than errors).| Stats and R

Learn more about survival analysis (also called time-to-event analysis), in which context and how it is used. Also learn how to apply it by hand and in R| Stats and R

Learn how to analyze and visualize Universal Analytics (UA) and Google Analytics 4 (GA4) data for your blog or website via the googleAnalyticsR package in R| Stats and R

Learn when and how to do a one-sample Wilcoxon test in R. See also how to visualize and interpret the results with a concrete example.| Stats and R

Learn how to run multiple and simple linear regression in R, how to interpret the results and how to verify the conditions of application| Stats and R

Learn how to track the performance of your blog or website in R by analyzing page views, sessions, users and engagement with the {googleAnayticsR} package| Stats and R

Learn how to perform an Analysis Of VAriance (ANOVA) in R to compare 3 groups or more. See also how to interpret the results and perform post-hoc tests| Stats and R

Learn about the 7 seven main benefits and reasons of having a data science blog and sharing your code, expertise and knowledge through your blog| Stats and R

Learn how to detect outliers in R thanks to descriptive statistics and via the Hampel filter, the Grubbs, the Dixon and the Rosner tests for outliers| Stats and R

Make the the most correlated variables stand out via a correlogram. See also how to enhance a correlation plot to show significant correlations among variables| Stats and R

Learn the differences between the Chi-square test of independence and the Fisher's exact test. You will also learn how to implement the statistical test in R| Stats and R

Learn how to perform a descriptive analysis of your data in R, from simple descriptive statistics to more advanced graphics used to describe your data at hand| Stats and R
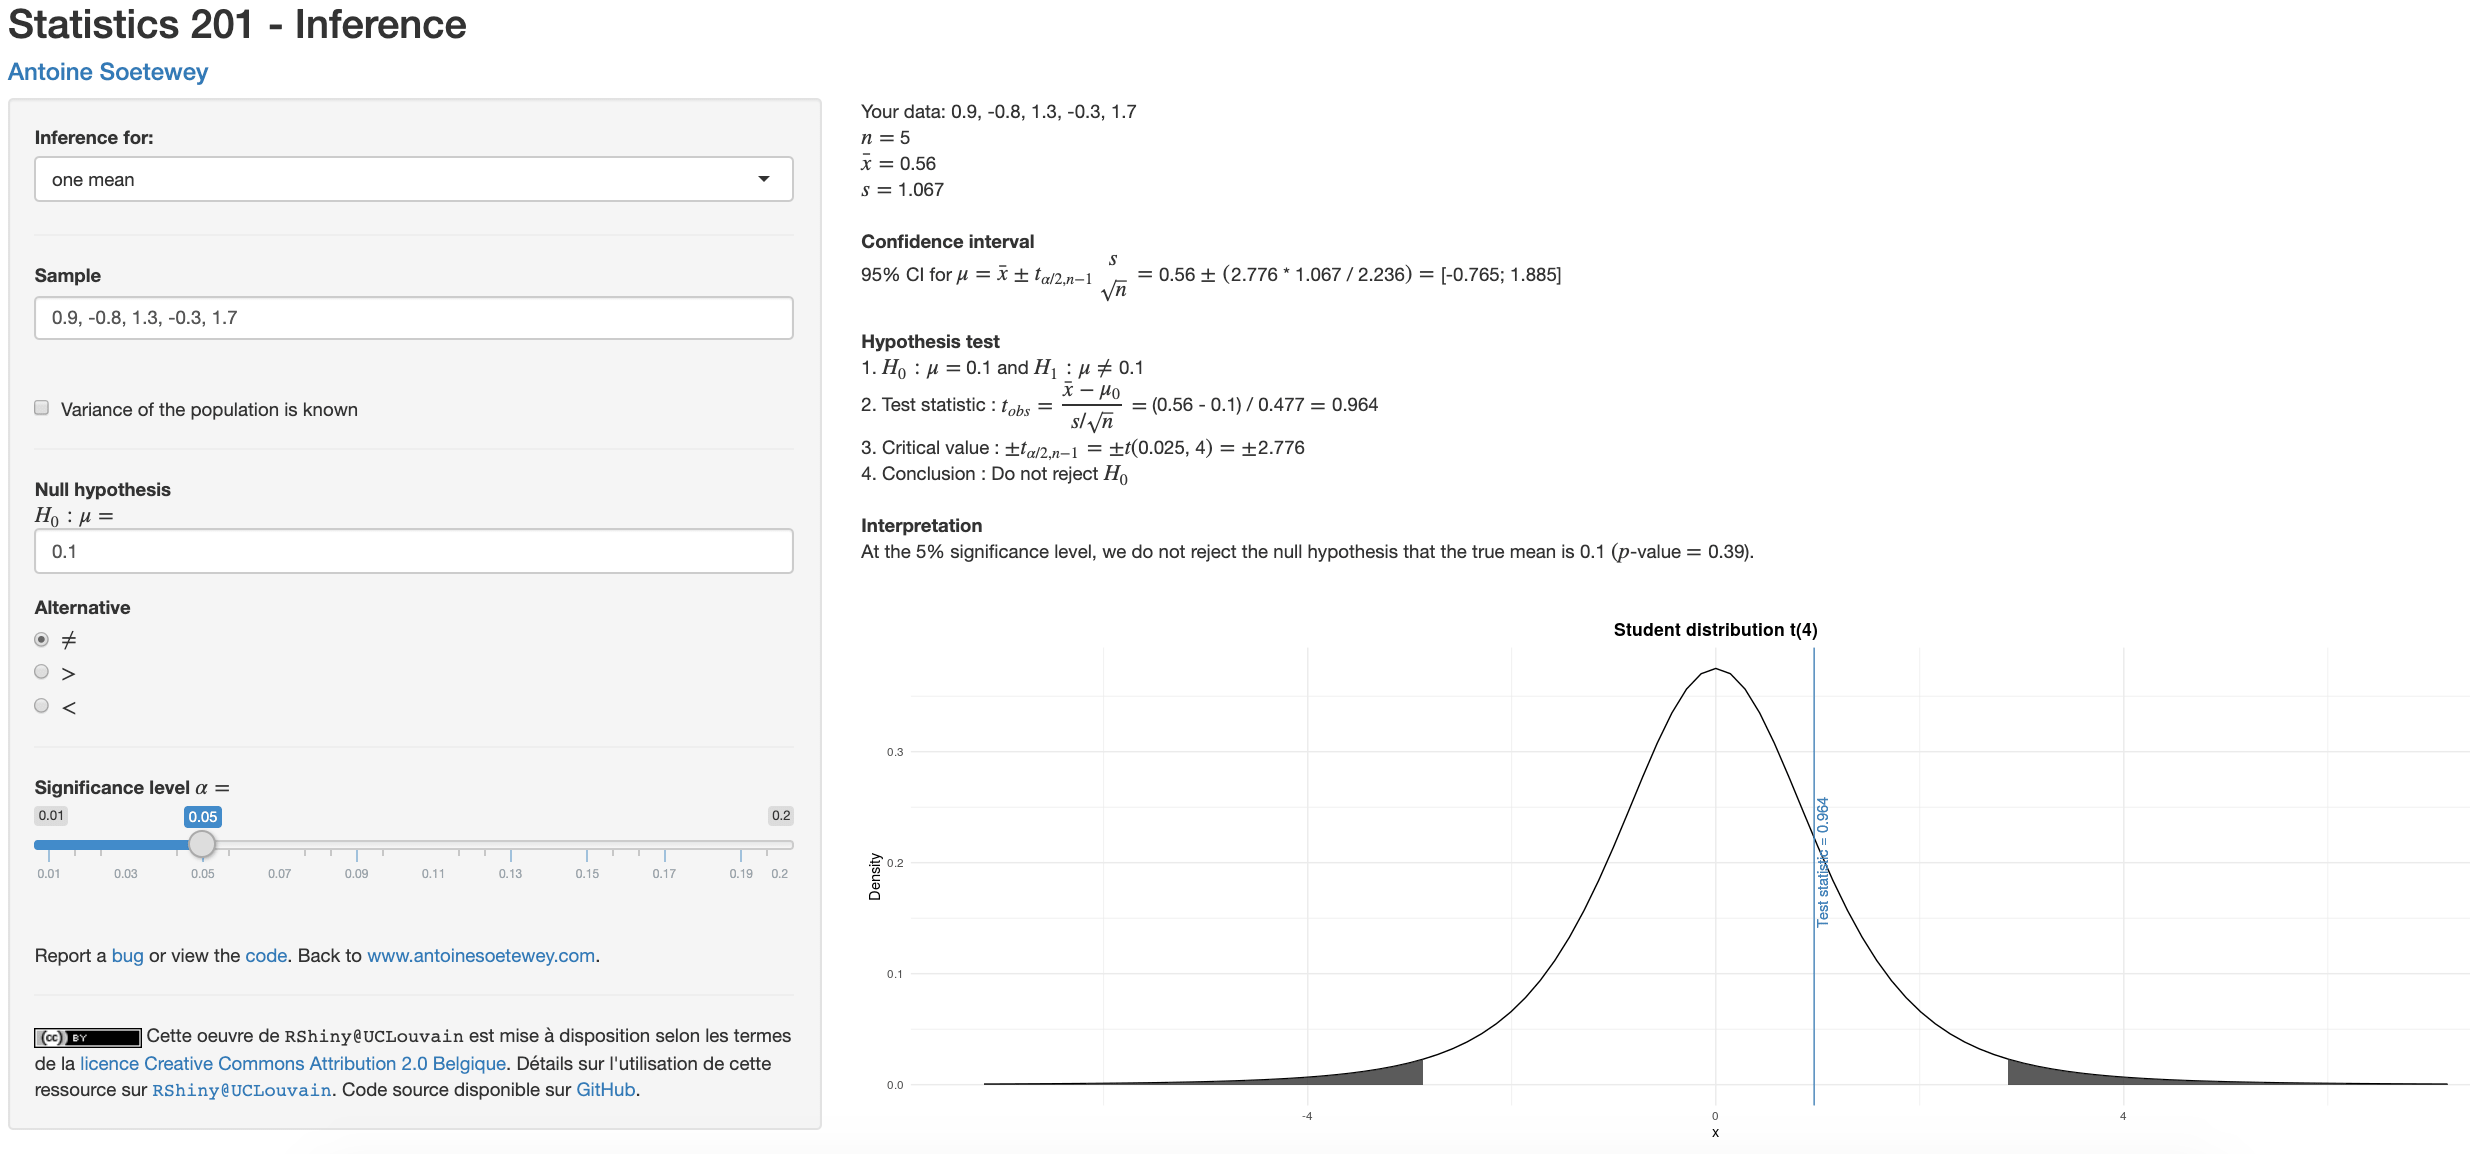
This article presents how to perform inferential statistics by hand, namely, confidence intervals and hypothesis tests for means, proportions and variances| Stats and R

See the main functions to manipulate data in R such as how to subset a data frame, create a new variable, recode categorical variables and rename a variable| Stats and R

Hello readers! This is the first article of a blog aimed at making statistics easy to understand by illustrating with concrete examples and using plain English| Stats and R
