
One-sample Wilcoxon test in R - Stats and R
Learn when and how to do a one-sample Wilcoxon test in R. See also how to visualize and interpret the results with a concrete example.| Stats and R
Learn when and how to do a one-sample Wilcoxon test in R. See also how to visualize and interpret the results with a concrete example.| Stats and R

Select the most appropriate statistical (hypothesis) test based on the number of variables and their types with the help of a flowchart| Stats and R

Learn how to run multiple and simple linear regression in R, how to interpret the results and how to verify the conditions of application| Stats and R

Learn the structure of a hypothesis test by hand, illustrated by 4 easy steps using the critical value, p-value and confidence interval methods| Stats and R

Learn how to perform an Analysis Of VAriance (ANOVA) in R to compare 3 groups or more. See also how to interpret the results and perform post-hoc tests| Stats and R

Learn how to perform a descriptive analysis of your data in R, from simple descriptive statistics to more advanced graphics used to describe your data at hand| Stats and R

Learn how to perform a descriptive analysis of your data by hand. You will learn how to compute both location and dispersion measures to describe your data| Stats and R
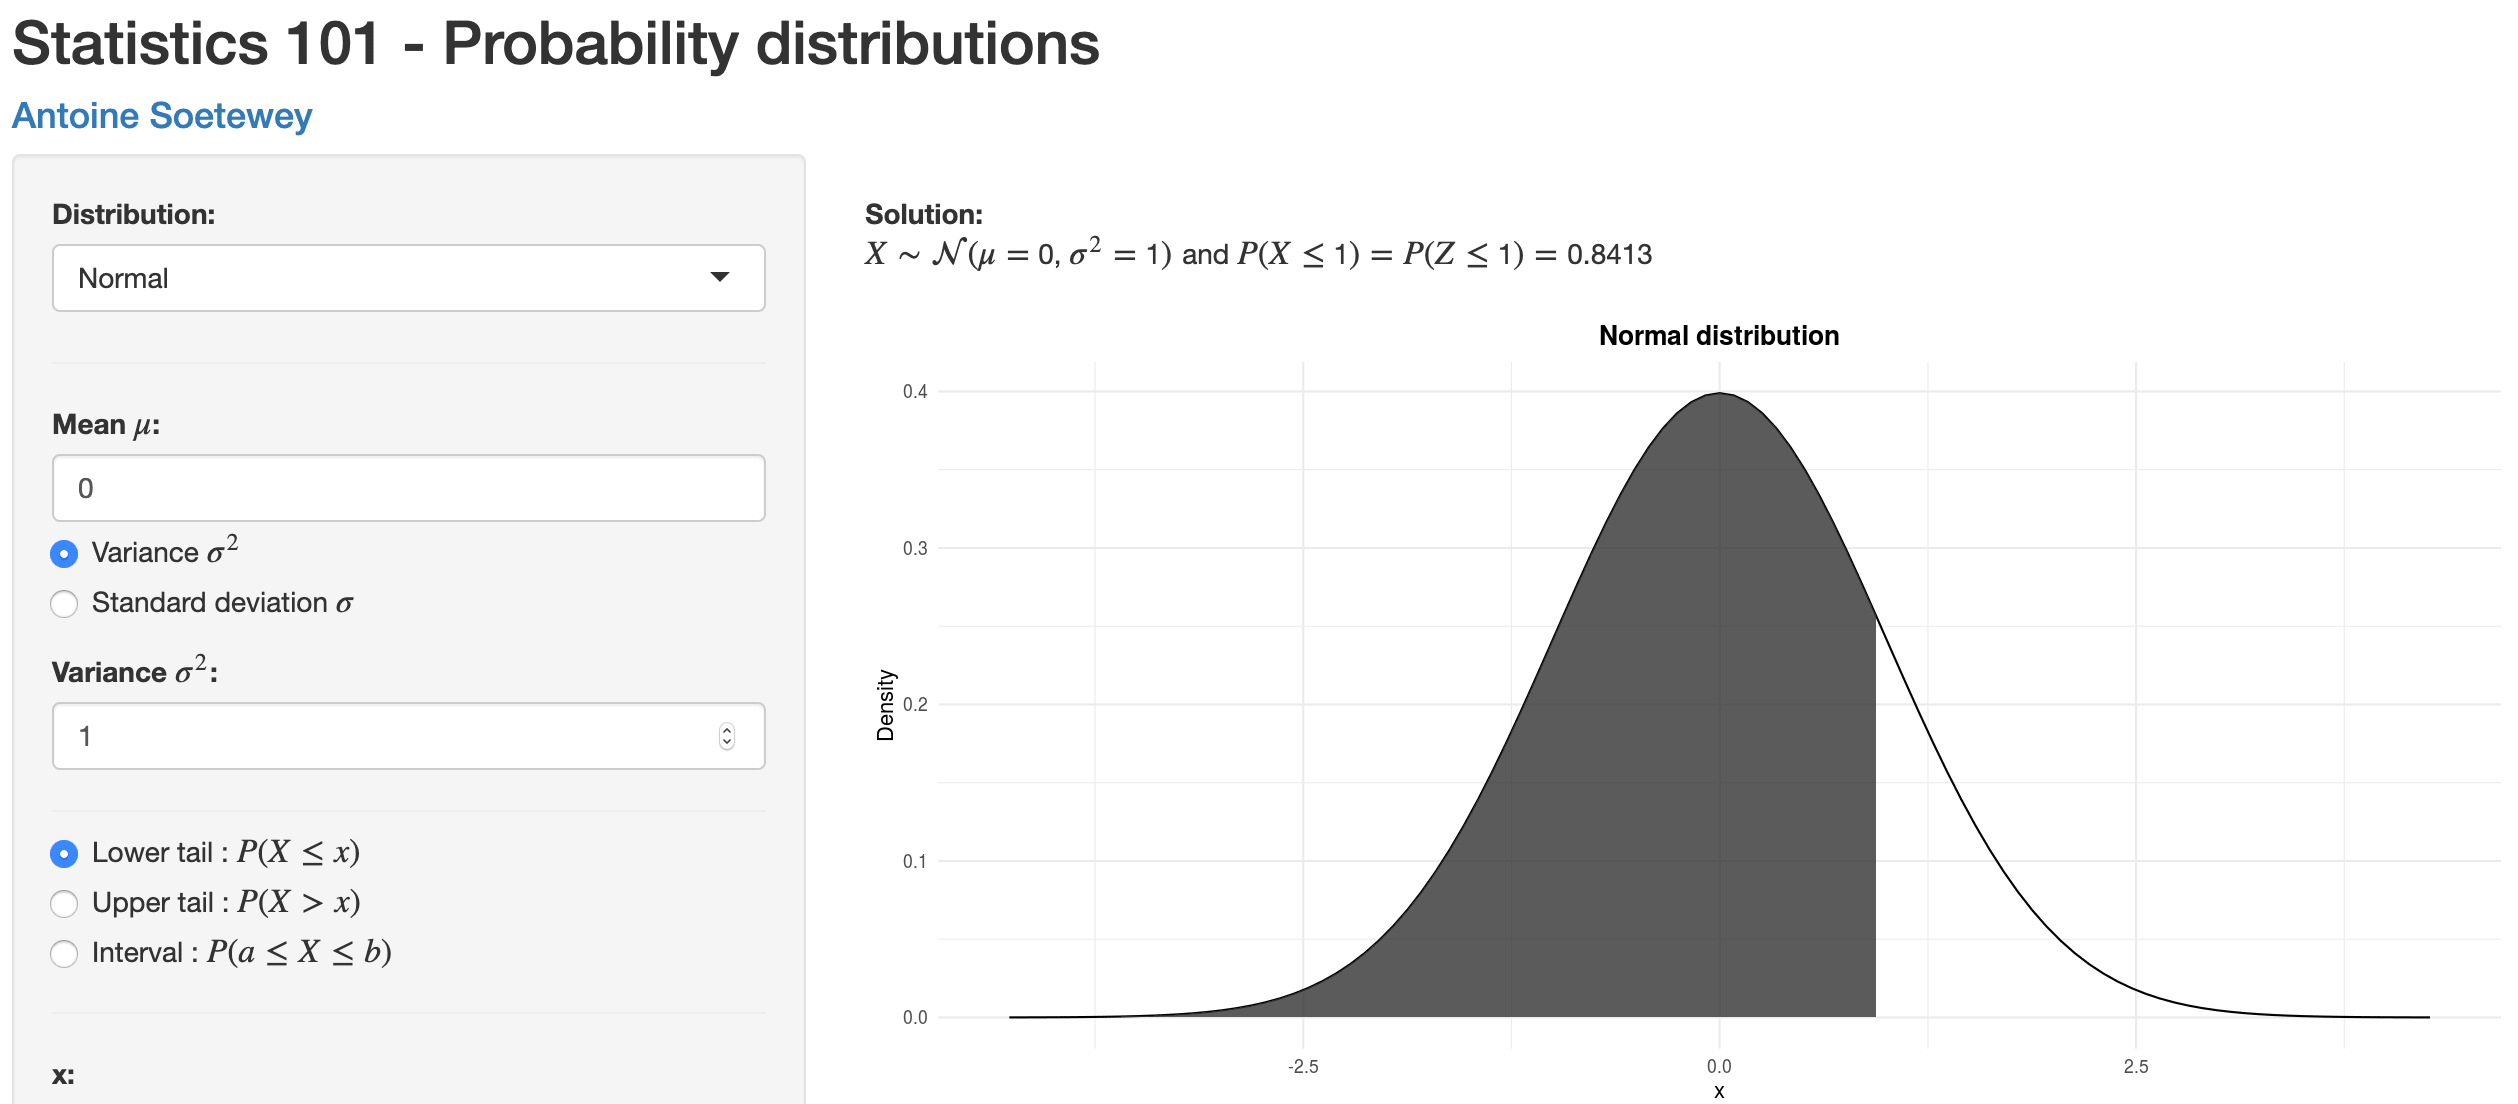
Learn how to use a Shiny app to compute probabilities for different probability distributions, used as a guide to read the most common statistical tables| Stats and R
