
Graphics in R with ggplot2 - Stats and R
Learn how to create professional graphics and plots in R (histogram, barplot, boxplot, scatter plot, line plot, density plot, etc.) with the ggplot2 package| Stats and R
Learn how to create professional graphics and plots in R (histogram, barplot, boxplot, scatter plot, line plot, density plot, etc.) with the ggplot2 package| Stats and R
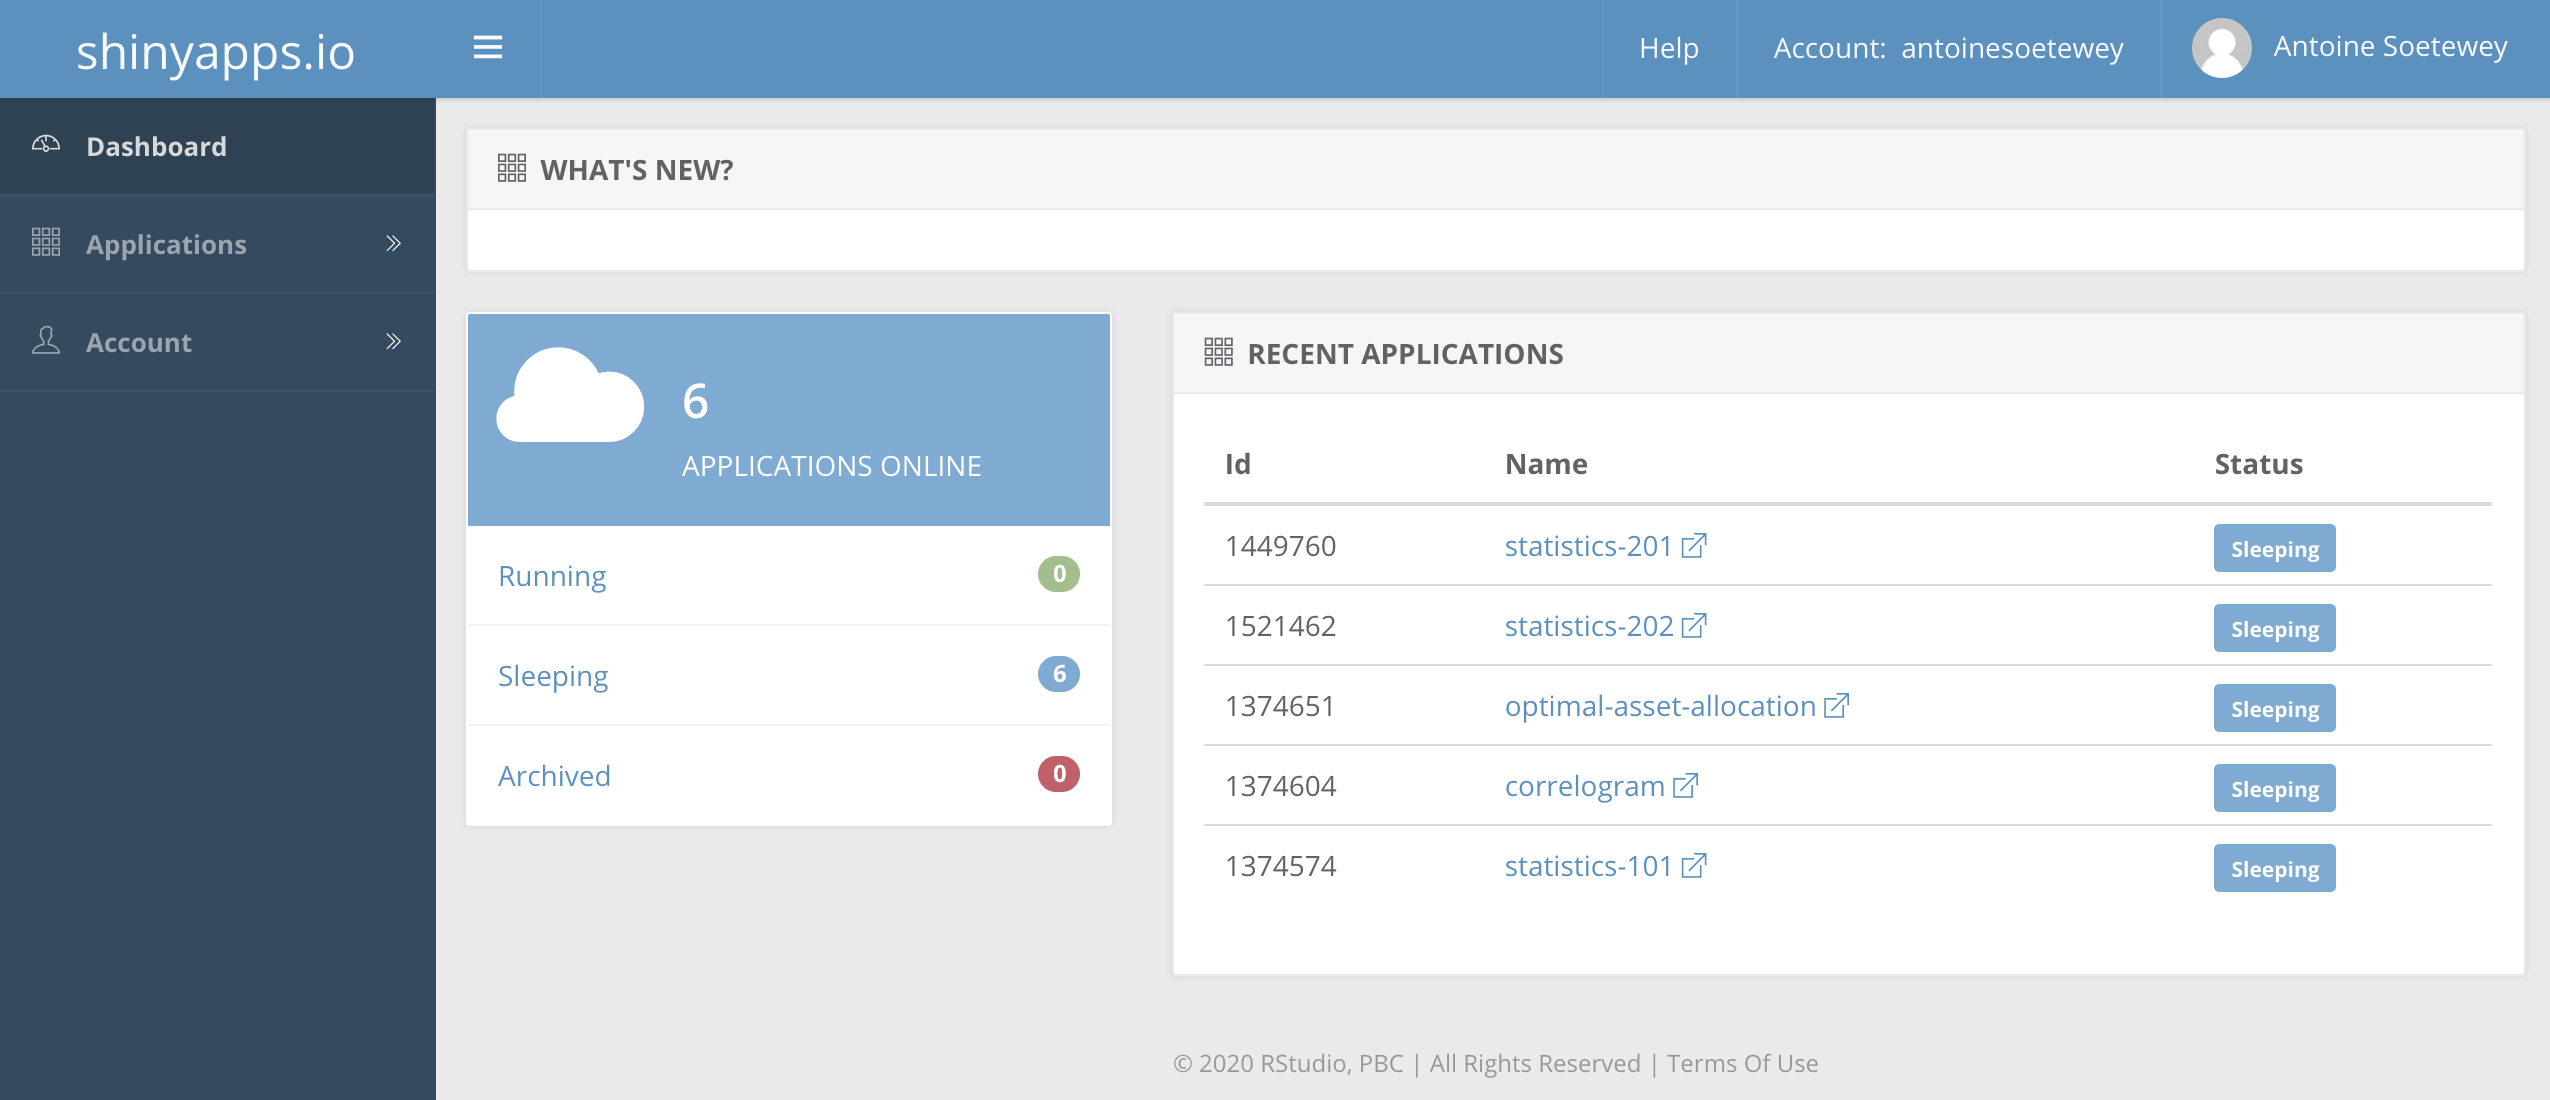
See a step-by-step guide (with screenshots) on how to deploy and publish online a Shiny app using shinyapps.io| Stats and R
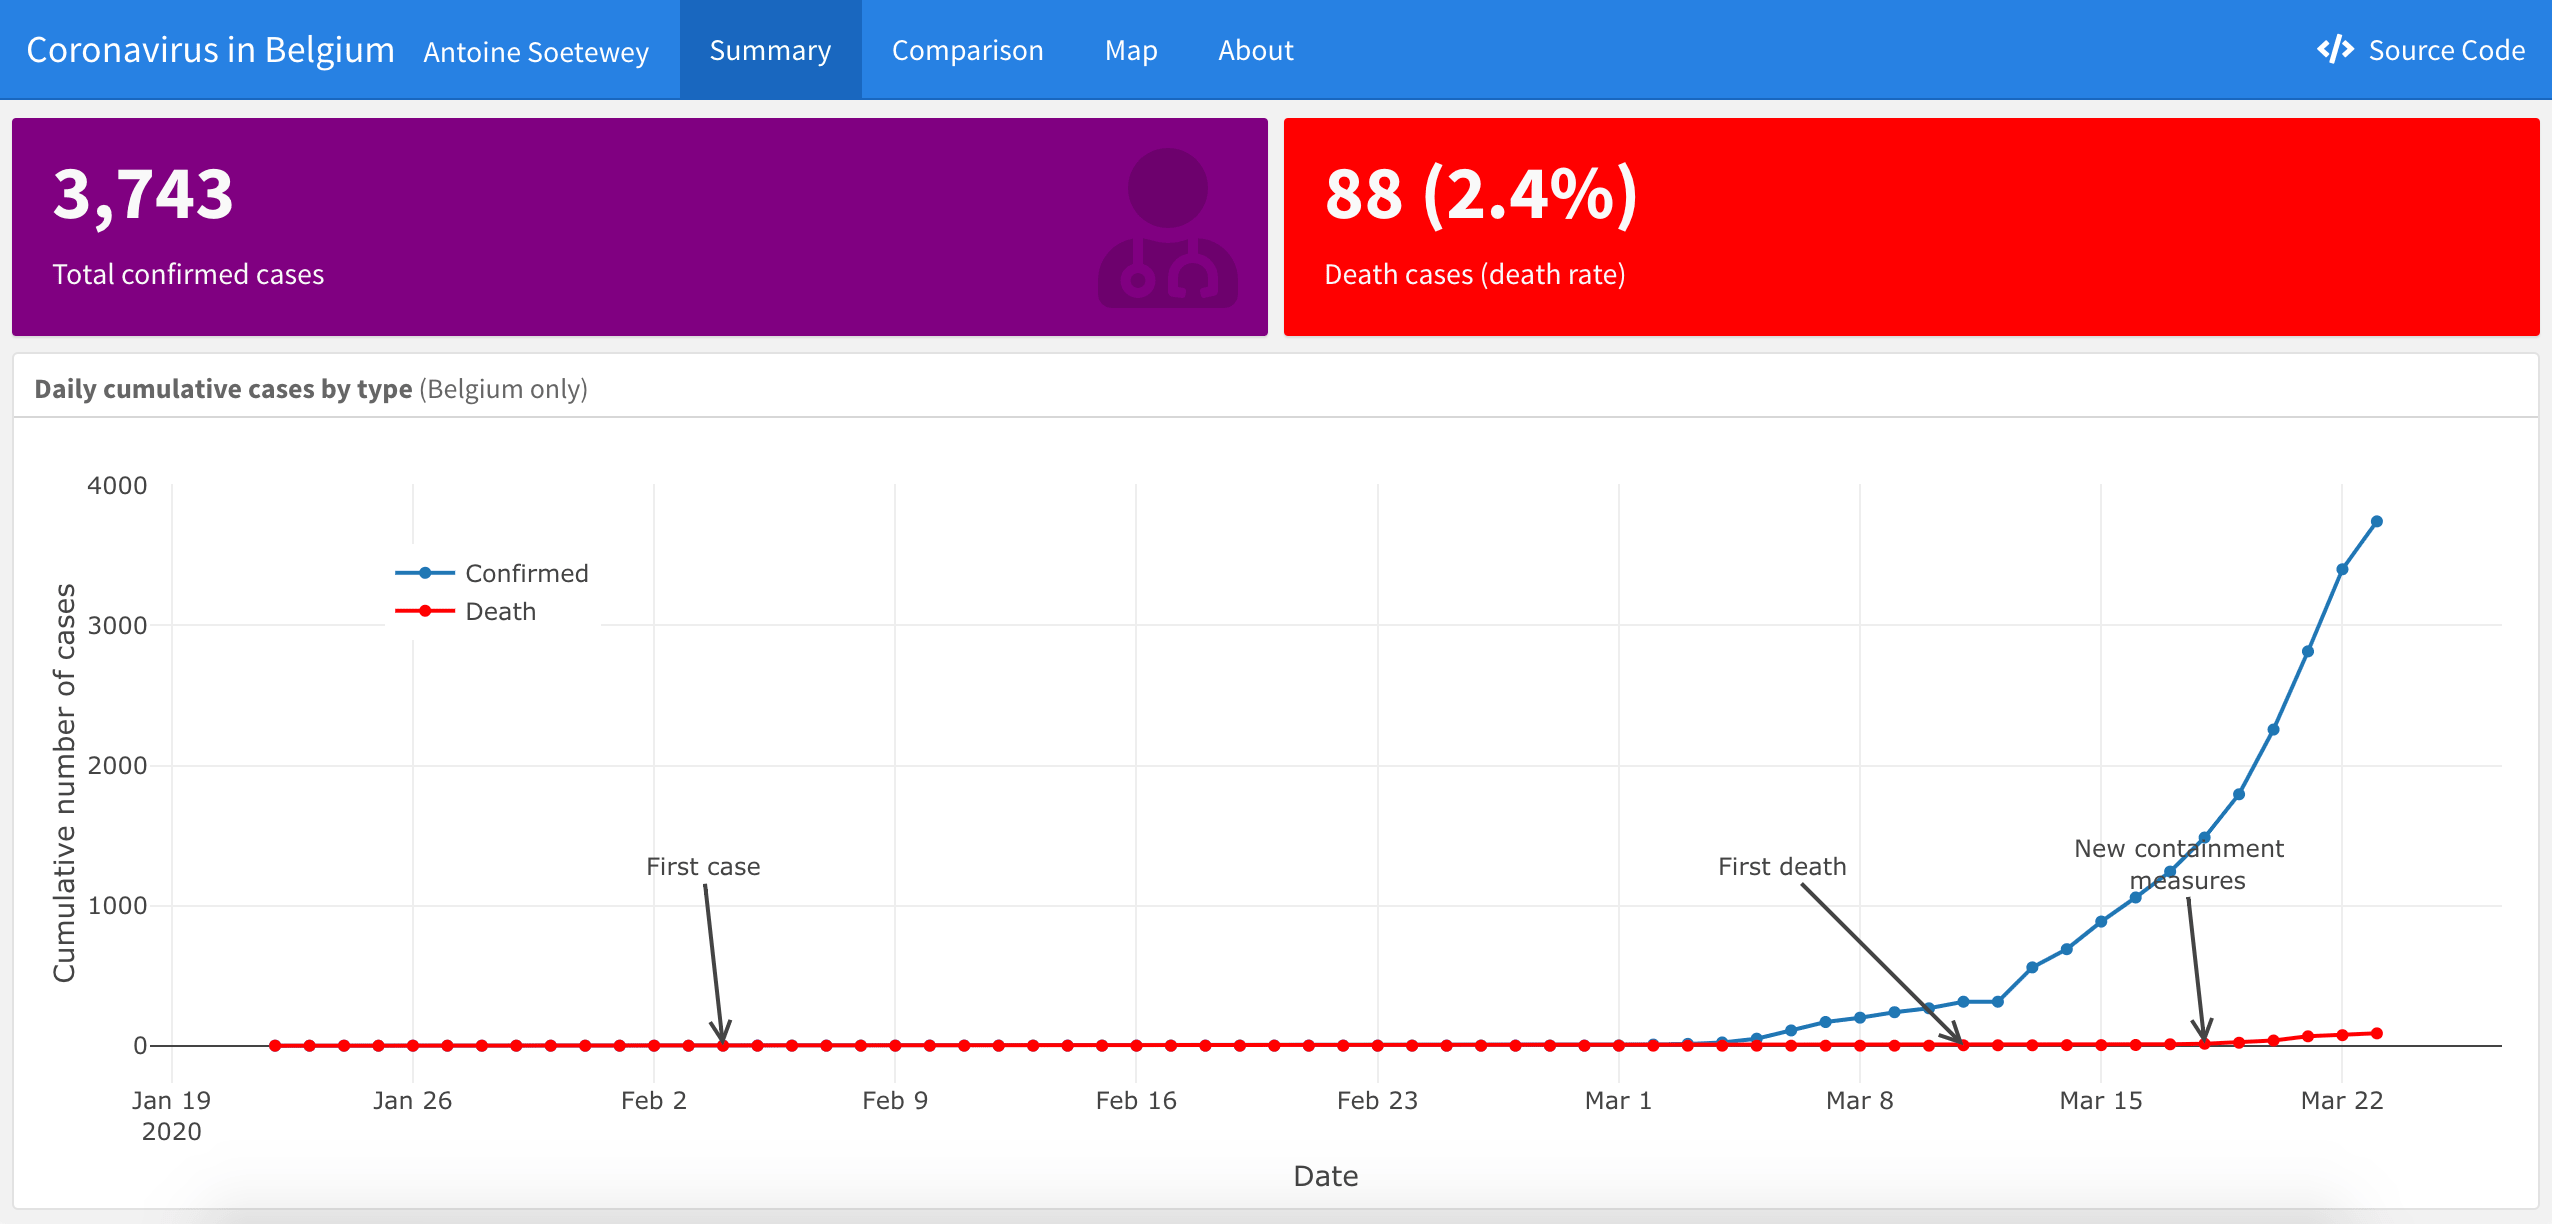
This article will help you to build a visually appealing dashboard about the spread of COVID-19 Coronavirus specific to a country in R using flexdashboard| Stats and R
Make the the most correlated variables stand out via a correlogram. See also how to enhance a correlation plot to show significant correlations among variables| Stats and R

Learn how to perform a descriptive analysis of your data in R, from simple descriptive statistics to more advanced graphics used to describe your data at hand| Stats and R

This article illustrates the main tips, tricks and shortcuts you can use in RStudio and R Markdown to write code more quickly and more efficiently| Stats and R
