
Pearson, Spearman and Kendall correlation coefficients by hand - Stats and R
Learn how to compute the Pearson, Spearman and Kendall correlation coefficients by hand to evaluate the relationship between two variables| Stats and R
Learn how to compute the Pearson, Spearman and Kendall correlation coefficients by hand to evaluate the relationship between two variables| Stats and R

Select the most appropriate statistical (hypothesis) test based on the number of variables and their types with the help of a flowchart| Stats and R

Learn how to perform an Analysis Of VAriance (ANOVA) in R to compare 3 groups or more. See also how to interpret the results and perform post-hoc tests| Stats and R

Learn how to create professional graphics and plots in R (histogram, barplot, boxplot, scatter plot, line plot, density plot, etc.) with the ggplot2 package| Stats and R

Learn how to detect outliers in R thanks to descriptive statistics and via the Hampel filter, the Grubbs, the Dixon and the Rosner tests for outliers| Stats and R

This article illustrates the main tips, tricks and shortcuts you can use in RStudio and R Markdown to write code more quickly and more efficiently| Stats and R
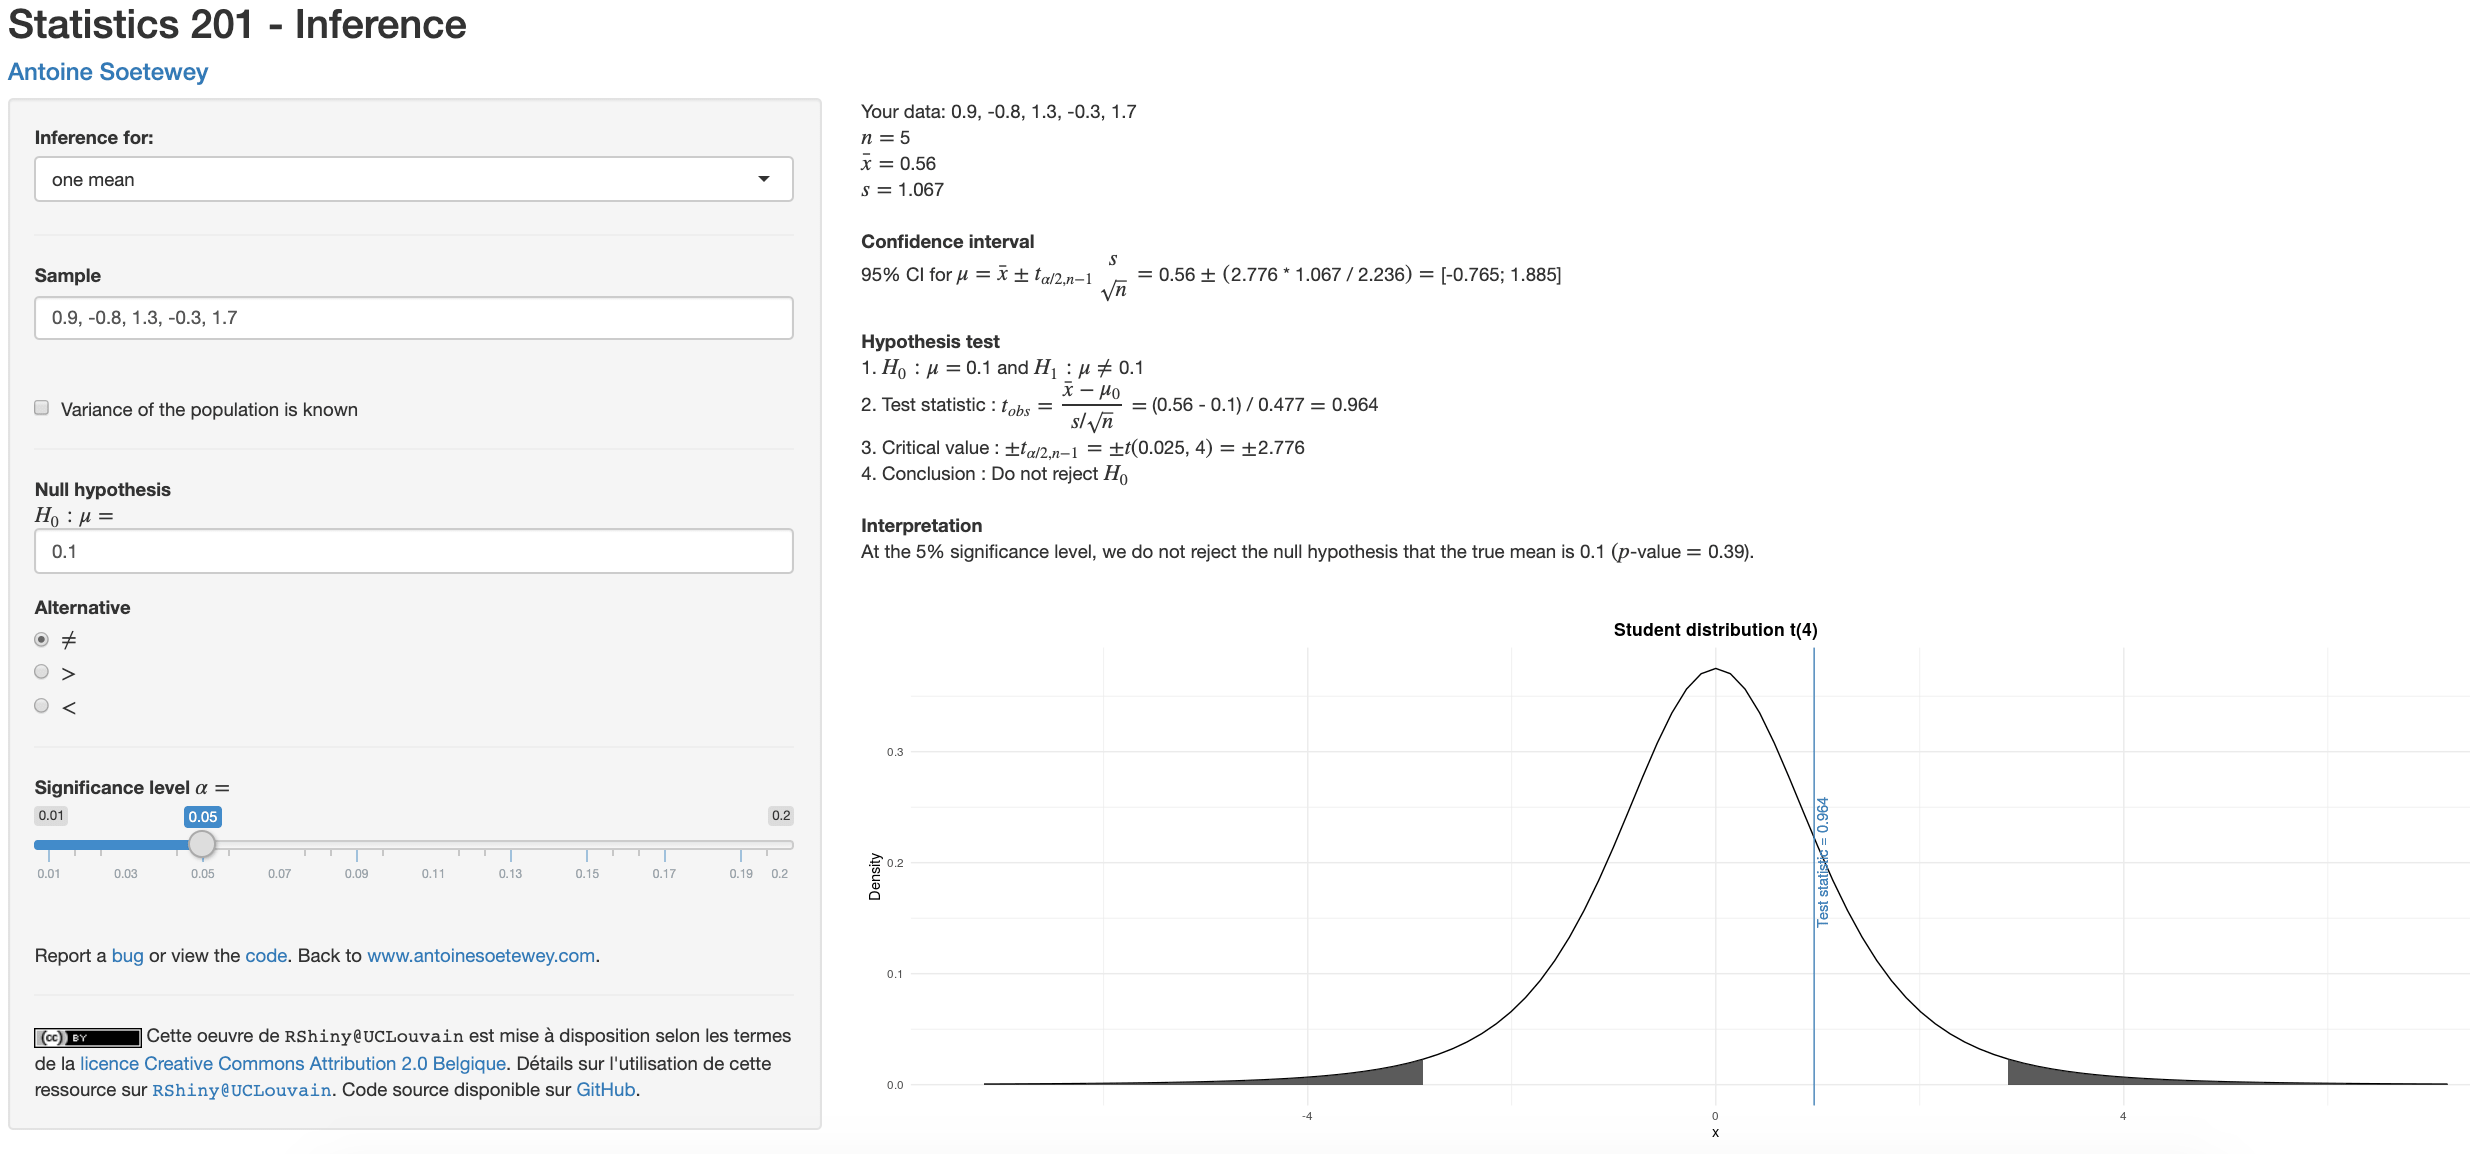
This article presents how to perform inferential statistics by hand, namely, confidence intervals and hypothesis tests for means, proportions and variances| Stats and R
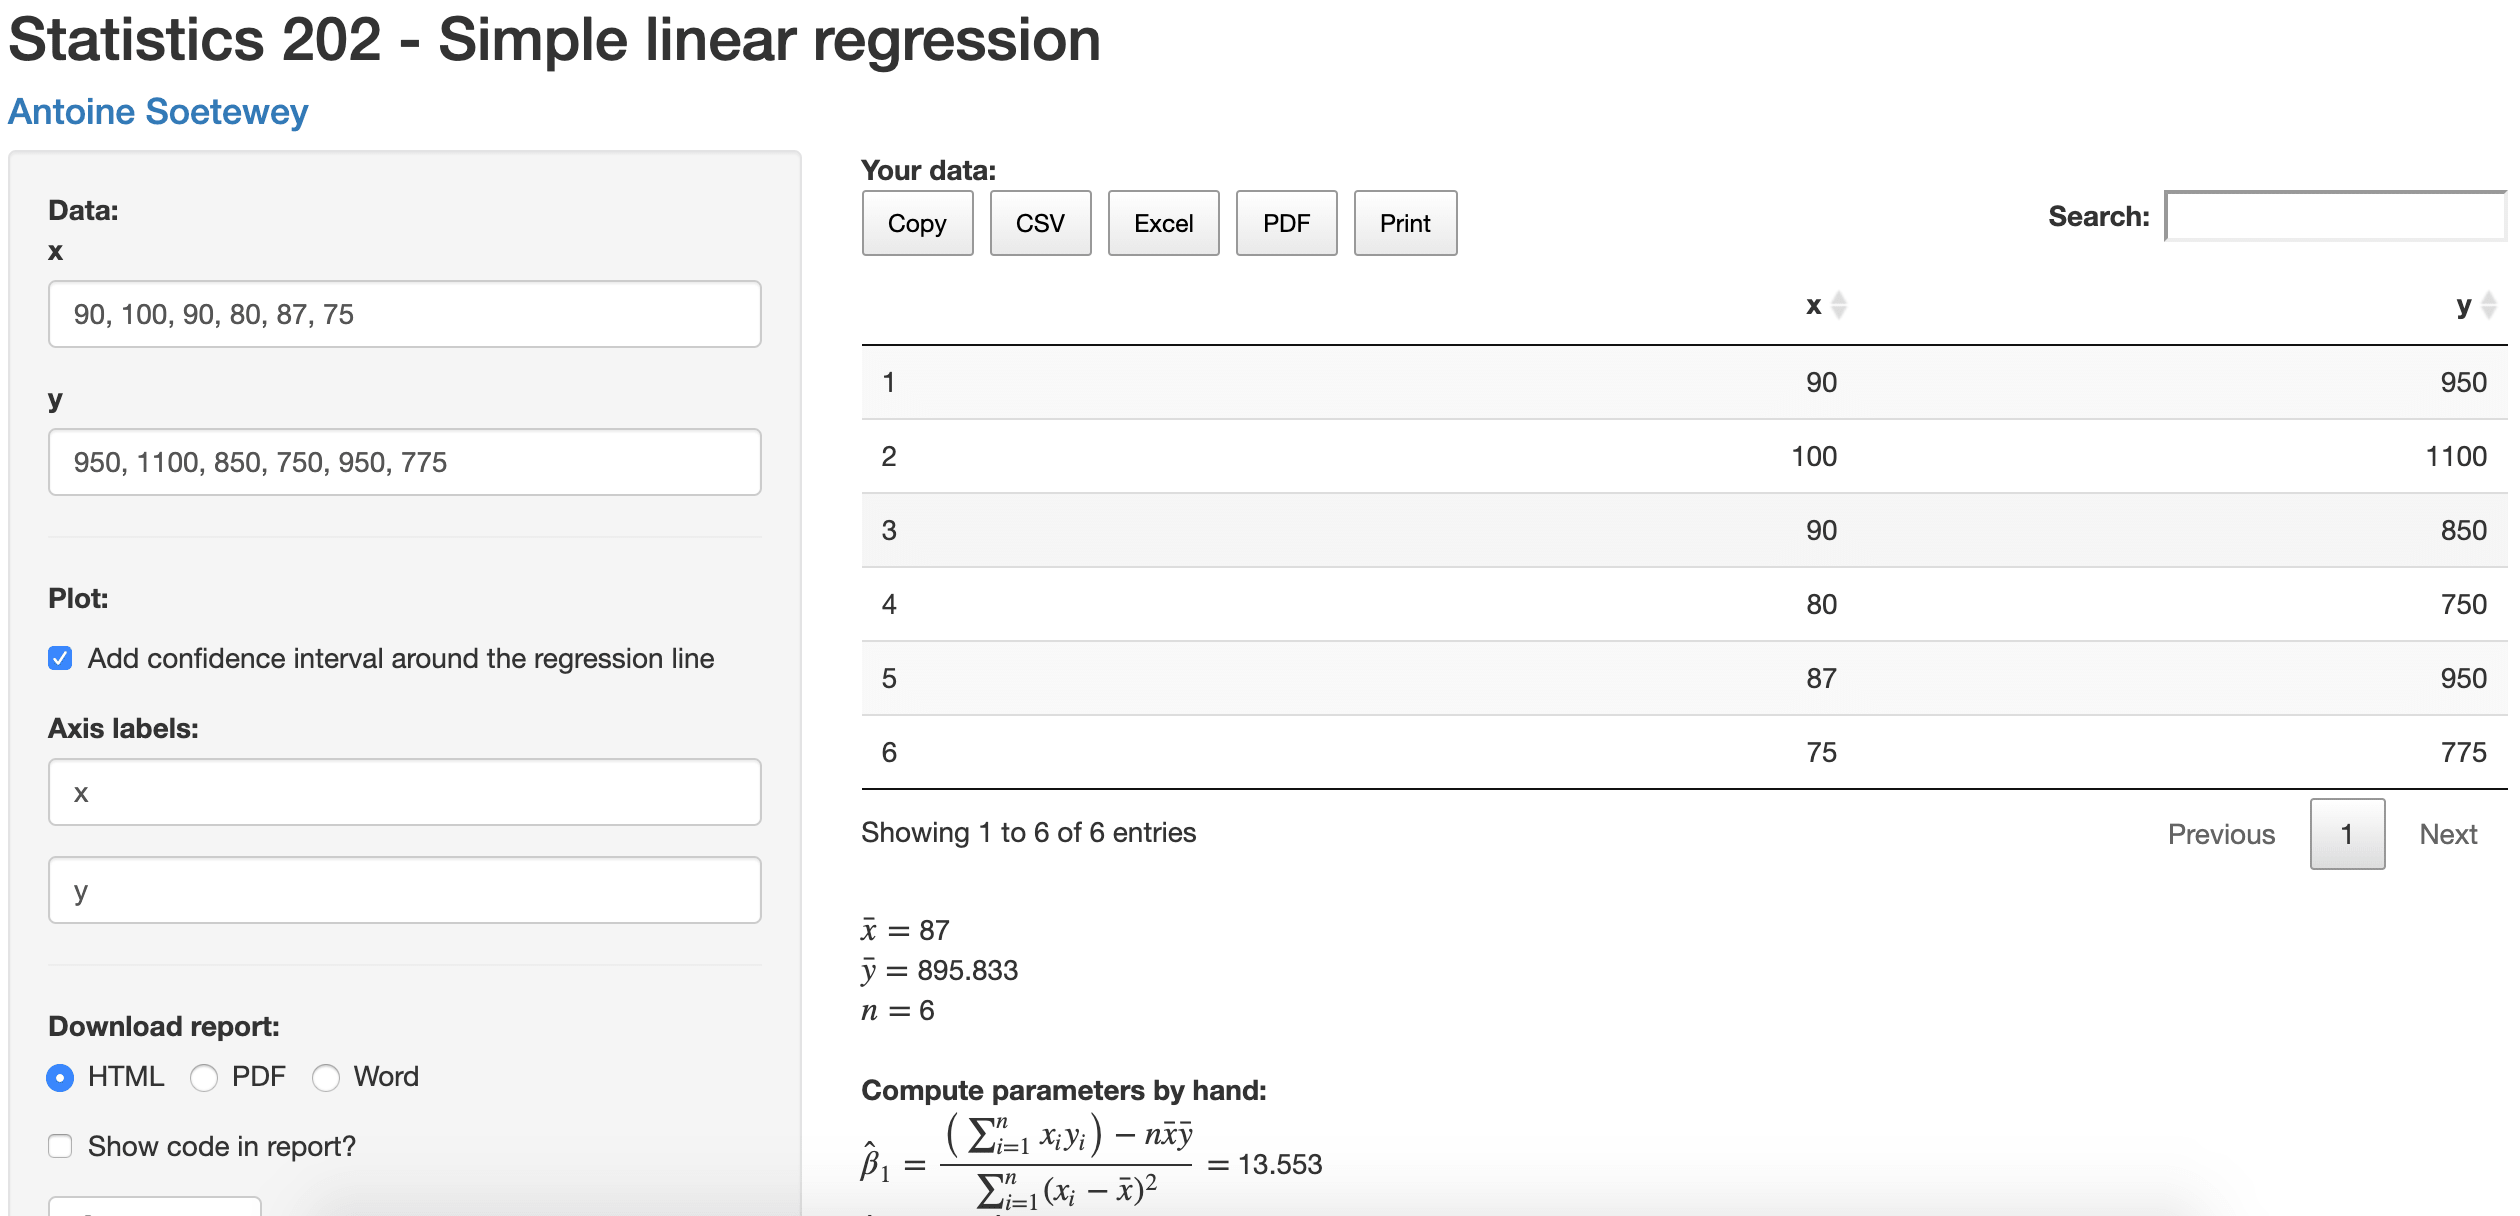
This article presents a Shiny app for computing simple linear regression by hand and in R. Add your own data, see the results and download them as a report| Stats and R
